This research investigates the influence of fair value accounting (FVA) on earnings quality (EQ) in European banking sector over the 2007 to 2016 period. As financial reporting system of banks is particularly exposed to FVA, we assume that FVA may produce significant effects on EQ for European banks. It can be expected that financial instruments’ prices are not available in illiquid markets, so Fair Values are estimated by applying valuation models. The application of valuation models (that is, market to model) in estimating Fair Value gives managers the opportunity to manipulate values, and thus could bring through lower quality of earnings. This study develops a multidimensional concept of EQ, and measures it using a set of attributes as persistence, predictability, variability, and earnings smoothing. The findings suggest that European banks with large Fair Value reporting in financial statements have higher rank of aggregate EQ.
Earnings deliver valuable information from firms to stakeholders, and are very significant in decision-making of investors (Schipper and Vincent, 2003; Francis et al., 2004; Francis et al., 2006). As earnings are widely measured in many circumstances, their quality has drawn the interest of scholars, standard setters, and professionals. Every business entity is judged by its earnings as one of the most important parameter to measure the financial performance of the organization. Also in the context of banks, the quality of earnings is an important benchmark to determine the ability to earn consistently in the future and to maintain quality, sustainability and growth in performance. Hence, earnings and especially the quality of earnings are investigated in the perspective of sustainability, competitiveness and healthy growth in banking sector (Gadhia, 2015).
Dechow et al. (2010) outlined that high quality reported earnings reveal present operating profitability, express upcoming performance and exactly represent the inherent value of the firm. Several empirical studies also showed that poor earnings quality (EQ) could increase information risks and eventually the cost of equity (Francis et al., 2004). With the adoption of International Accounting Standards (IAS)/International Financial Reporting Standards (IFRS), EQ has drawn keen attention from stakeholders since fair value accounting (FVA) may deteriorate EQ according to prior evidence in literature. The move from the traditional Historical cost-based accounting model to a Fair Value (market value)-based accounting model has significant consequences for the role and properties of financial reporting. When investigating the effectiveness of Fair Value, it is important to analyze how it achieves the overall target of financial reporting that is to supply decision-useful information to investors, creditors and other stakeholders (IASB, 2010).
Based on this overall objective, accounting has to provide valuation-relevant information as accounting information has one role: informativeness. Ronen and Yaari (2008) emphasized that informative purpose arises from investors’ request of information to forecast future earnings and cash flows. According to Kirschenheiter and Melumad (2004), high quality earnings are more useful as they better signify the future performance of the company. Revsine et al. (1999), instead, argued that earnings are of higher quality if they are maintainable. How a FVA approach is expected to influence EQ, and what EQ will appear within such a model is certainly a remarkable issue (DeFond, 2010).
According to prior studies (Francis et al., 2004; Dechow et al., 2010), this study inspects the impact of FVA on four most usually applied measures of EQ: persistence; predictability, variability and smoothness. Furthermore, to moderate the possible implications of valuation mistakes and omitted variables, an aggregate EQ measure is fashioned by means of the earnings attributes specified previously.
Findings show that earnings under a FVA-based accounting system have higher aggregate quality ranks for banks in European countries. Specifically, we discover primary evidence that Fair Value gains (losses) through profit or loss (FVTPL) and through other comprehensive income (FVTOCI) are positively associated with banks’ aggregate EQ. Though, the impact of net gains (losses) reported at Fair Value through banks’ income statement on EQ variation is less statistically significant.
The likely involvement of this study to current literature can be found by various means. First, no prior studies assessed the impact of FVA on EQ in European banking sector. Second, this is the first study examining a wide variety of earnings attributes in addition to an aggregate EQ measure in such a context. Previous studies have mostly examined individual EQ measures or a subgroup of EQ measures to demonstrate their hypotheses. Our research advances a multidimensional concept of EQ based on four earnings attributes.
Numerous prior studies addressed the assessment of EQ in financial reporting. For instance, several empirical studies inspected EQ variations over time and their determinants; others quantified the impacts of particular changes in corporate governance requirements, enforcement systems and accounting standards within or across countries. Many studies attempted to investigate the effects of IAS/IFRSs adoption as it is conceptually perceived to improve the proxies of accounting quality (Pascan, 2015).
However, there is a large debate about relative benefits of accounting under IAS/IFRSs era, and prior literature verified conflicting effects of IAS/IFRSs adoption on EQ. That is, several studies documented accounting quality improvements of voluntary IAS/IFRSs adoption (Gassen et al., 2006) but there are some papers that found no evidence on favorable effects of IAS/IFRSs in this regard (Sodan, 2015). Under both US GAAPs and IAS/IFRSs, the word “Fair Value” usually states for the current market value (that is, the price that would be received to sell an asset or paid to transfer a liability in an orderly transaction between market participants at the measurement date) when available, and it encompasses an estimated value when the existing one is not directly recognizable because the market for an asset or a liability is illiquid (IASB, 2008).
FAS 157 - Fair Value Measurements and IFRS 13 - Fair Value Measurement provide a precise description of Fair Value and detailed disclosure requests for its use within IFRSs. To improve reliability and comparability in Fair Value measurements, both the IFRS 13 and the FAS 157 comprise a Fair Value hierarchy based on a three-tiered valuation process. Precisely, three steps of Fair Value measurement are established: Level 1 is used when the present price in a liquid market for just the same instrument can be achieved (that is, mark to market); Level 2 is related to the current price in a liquid market for a similar instrument, which must be applied to evaluate the Fair Value of the instrument to be measured (that is, mark to matrix); Level 3 needs to apply valuation models (that is, mark to model).
At Level 3, estimations embrace valuation techniques (that is, discounted cash flow model, income approach, etc.) that rely upon internal information and assumptions. In this respect, an additional result of the information delivered by Fair Value measurement is the subjective estimate that certainly occurs in valuating assets or liabilities for which inputs are unobservable. This discretionary appears through managerial decision, application of earmarked information, and the inherent uncertainty about the reliability of the expectations assumed in the estimation (Power, 2010). In Level 3 estimate of discretionary fair value implies probable adjustments of the earnings since assumptions need inputs (that is, cash flow or income predictions) that are themselves exposed to valuation error.
Chen et al. (2010) emphasized the more biased nature of Level 3 as Fair Value measurement may be exposed to manipulation in inactive markets whereas quoted market prices are not available (Dechow et al. 2010). Fair Value evaluations possibly lead to more information asymmetry and therefore to more valuation errors, even without the intended misrepresentation of managers. In this regard, the opponents of fair value accounting (FVA) disapprove its reliability, particularly in using valuation models (mark to model) that are prejudiced by viewpoints and estimations arising from management.
Although the use of FVA looks credibly rational in well operating markets, the reliability, relevance and integrity of this approach decrease when markets do not run. In these circumstances, Fair Values is likely to be measured through valuation techniques which allow earnings management and could result in lower quality of reported earnings. Valuation of Fair Value (mark to model) opens doors for the application of management judgment and intended prejudice which can reduce the quality of financial reporting (Nissim, 2003; Hitz, 2007; Ryan, 2008; Chen et al., 2010).
Opponents of FVA claim that sometimes fair value measurements don’t reflect probable cash flows and underlying economic conditions as the measures comprise “noise” attributed to market sensitivity instead of to economic fundamentals. Then, in illiquid financial markets the procedure of market prices to measure assets and liabilities may not be useful since in these circumstances prices are not related to the correctly discounted value of expected cash flows. Existing research also demonstrated that Fair value estimations are less significant when they are based on unreliable observable inputs (Nelson, 1996; Simko, 1999; Song et al., 2010). Besides, value relevance of FVA is not constant across time, specifically it decreases during periods of economic turmoil owing to information risk and superior illiquidity (Hung, 2000; Allen and Carletti, 2008).
On the contrary, prior literature has advanced some reasons why IAS/IFRSs could improve accounting quality (Barth et al., 2008; Daske et al., 2008; Liu et al., 2011; Bartov et al., 2005). The majority of previous studies on FVA investigated effectiveness of fair value information for investors in capital markets and in this regard proponents of FVA argued that market prices offer the most significant and appropriate measures of assets and liabilities (Barth, 1994; Barth and Clinch, 1998; Ryan 2008).
Empirical evidence mostly advises that the application of FVA has really improved level of informativeness of the accounts, and researchers mostly agreed that FVA delivers valuable information concerning the volumes, timing and uncertainty of future cash flows (Landsman, 2007; Hitz, 2007; Barth, 2008).
An essential statement in value relevance literature is that FVA is able to predict cash flows in future realizations (that is, fair value estimations signify the present value of predictable future cash flows). Therefore, usefulness of FVA can be directly studied by its predictive aptitude in assessing forthcoming cash flows and earnings. As fair value valuations are consistent measures of assets’ values, adjustments in fair values (that is, unrealized Fair Values gains and losses) should involve future performance variations (Barth, 2000).
Since the financial reporting system of banks is particularly exposed to FVA, a number of studies investigated predictive ability of FVA in the banking sector performance. Specifically, balance sheet of bank contains predominantly financial instruments which are mostly recognized at fair value. For example, within the performance literature on banking industry, Hill (2009) argued that amplified exposure to FVA in financial reporting improves the capacity of earnings to forecast cash flows.
However, Hill (2009) also underlined that these empirical findings concerning prognostic aptitude of fair value could not be generalised because variations in fair values reported in net income or in other comprehensive income could be temporary within more volatile market conditions, and could not amplify earnings capacity to expect future operating performance (Dhaliwal et al., 1999; Jones and Smith, 2011) in a particular circumstance. In this regard, previous empirical studies linked high ranks of earnings volatility with FVA (Bernard et al., 1995; Barth et al., 1995; Barth (2004); Hodder et al., 2006; Plantin et al., 2008; Magnan, 2009; Solé et al., 2009; Sun et al., 2011).
Barth (2004) pointed out that financial statement volatility itself is not a signal of defective financial reporting. It is apparent that estimation error volatility outcomes from defective measurements, since future cash flows are uncertain. Estimation error volatility tends to be lesser if fair value is measured using the prices that the active markets provide (mark to market). On the contrary, estimation error tends to be larger when prices are not available in active markets and Fair Value is based on valuation models and subjective estimations.
We assume that the use of FVA may have significant effects on EQ for European banks since large portion of financial instruments are reported at fair value in banks’ balance sheets. Even though managers could behave opportunistically in situations with weak shareholders protection (Hung, 2000), we argue that they are more likely to use discretionary power in order to deliver reserved information to stakeholders and subsequently to increase EQ.
To summarize, when examining prior research concerning the relationship between the use of FVA and EQ measures, conclusions can be resulting as follows. First, there are varied and unreliable evidences from prior studies. Second, existing literature examined EQ applying single earnings attributes or a subgroup of earnings attributes. Third, most of previous researches on this issue are implemented in countries such as US, United Kingdom or Australia and there is usually an absence of investigation about the impact of FVA on EQ in European banking sector (Sodan, 2015).
We test whether the higher exposure to FVA is related with the quality of reported earnings in European banking sector. We expect FVA to influence EQ but we do not expect a direction of the relationship. Hence, the study hypothesis is stated as follows:
H1: Fair value accounting (FVA) affects banks’ EQ
EQ is challenging to define and, although there are no definitive criteria to evaluate it, there are many factors that can be considered in assessing the quality of earnings. Prior literature classified some attributes of reported income that are commonly appreciated as required characteristics of reported earnings (Francis et al, 2004; Barton et al., 2010). Pratt (2010) describes EQ as “the extent to which net income reported on the income statement differs from true earnings”.
Penman (2003) specifies that EQ depends upon the quality of expected earnings in addition to present reported earnings. Schipper and Vincent (2003) delineate EQ as “the extent to which reported earnings faithfully represent Hicksian income”, which consists of “the change in net economic assets other than from transactions with owners”. A consequence of the difficulty to give a unique definition of EQ is the multiplicity of measures that have been used in literature to approach EQ. In literature, it’s difficult to find either an agreed significance of the concept or a commonly unanimous methodology to assess it (Schipper and Vincent, 2003). For example, according to Dechow and Schrand (2004), “a high-quality earnings number is the one that accurately reflects the company’s current operating performance” and it is a useful summary measure for assessing firm value. EQ is a multidimensional and contextual concept lacking of a shared explanation and depending on each user’s perspective. Hence, EQ is difficult to quantify and current empirical studies evaluate it by taking into account a single attribute of earnings or various earnings characteristics related to EQ (Francis et al., 2004; Dechow et al., 2010; Gaio, 2010, Kousenidis et al., 2013).
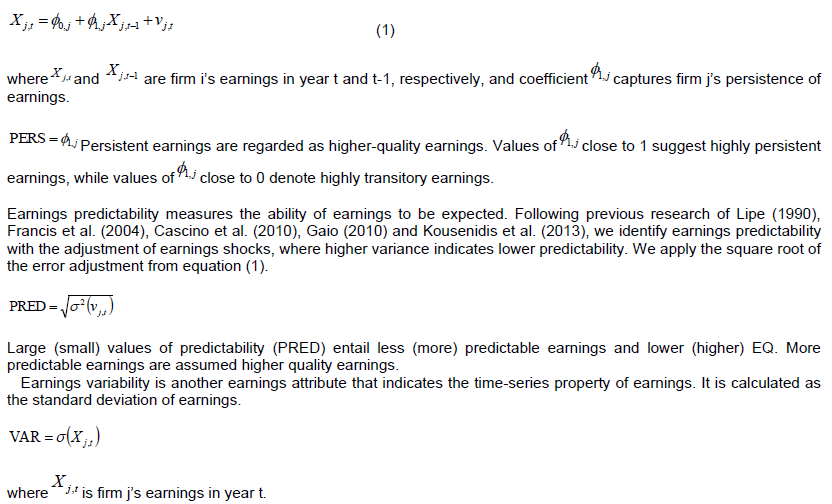
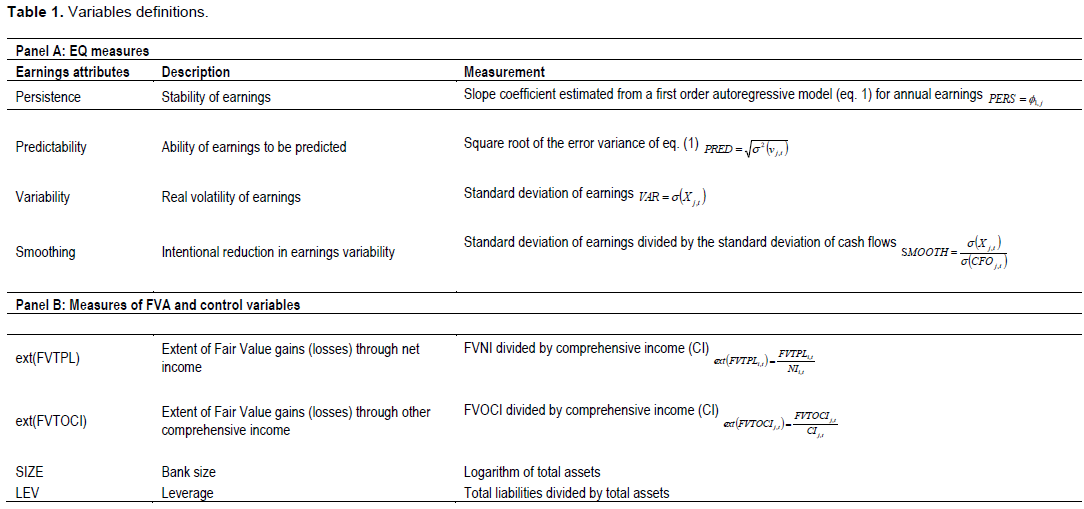
This study considers EQ as a multidimensional concept using four accounting-based earnings qualities that do not rely on market insights (Leuz et al., 2003; Francis et al., 2004; Burgstahler et al., 2006; Gaio, 2010; Kousenidis et al., 2013). Considering the accounting-based characteristics, time-series qualities of earnings express the spreading of profits over time and the statistical properties of the procedure that produces earnings (Schipper and Vincent, 2003). Precisely, we contemplate the subsequent four individual selected earnings attributes: persistence, predictability, variability and smoothness. In addition, we clarify how prior studies have described each attribute as desirable and then we consider an aggregate EQ measure based on Gaio (2010) methodology.
Earnings persistence is regarded as a desired earnings attribute and typically represents the capacity of present recognized earnings to be maintained in the future (Francis et al., 2004). Persistence accounts earnings sustainability and it is related with constancy and return of earnings over time (Schipper and Vincent, 2003). Persistence is a measure of earnings information quality, and it is calculated as the slope coefficient of the regression function of a period’s earnings per share (EPS) compared to the preceding period’s EPS (Francis et al., 2005; Mehri et al., 2011).
A value of the slope coefficient nearer to 1 indicates high earnings persistence while a value closer to 0 stands for a low persistence of earnings. Oei et al. (2008) replicated the Francis et al. (2005) approach modifying it by changing EPS with the ratio of earnings before interest and after tax to total assets. According to Lipe (1990) and other researchers (Francis et al., 2004; Dichev and Tang, 2009; Cascino et al., 2010; Gaio, 2010). In this study, Kousenidis et al. (2013), earnings persistence is calculated as the slope coefficient estimated from autoregressive models of earnings.
According to prior research (Francis et al., 2004; Francis and Wang, 2008; Dichev and Tang, 2009), higher (lower) values imply higher (lower) ranks of earnings variability, which are assumed as lower (higher) EQ. It is supposed that less volatile earnings are more persistent and predictable.
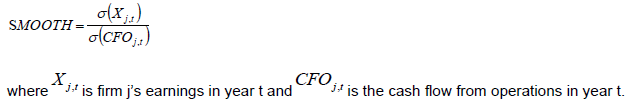
Earnings smoothing is a manipulative technique to decrease normal earnings variability that is often connected with risk. In this viewpoint, smoother earnings represent lower EQ (Dechow and Skinner, 2000; Zeghal et al., 2012). Earnings smoothing is generally calculated as the ratio of earnings variability to cash flow variability (Leuz et al., 2003).
Researchers who used this measure of earnings smoothing are Francis et al. (2004), Burgstahler et al. (2006), Van Tendeloo and Vanstralaen (2008), Cascino et al. (2010), Gaio (2010) and Kousenidis et al. (2013). In line with prior literature (Leuz, 2003; Francis et al., 2004; Hodder et al., 2006; Gaio, 2010), we measure earnings smoothing as the ratio of earnings variability to operating cash flow variability as follows:
High (low) values show low (high) variability in cash flows than in earnings and, consequently, a low (high) degree of artificial earnings smoothing. High values of SMOOTH suggest low quality of earnings. Table 1, Panel A sum up the description and the calculation of the attributes individually. According prior studies (Leuz et al., 2003; Gaio, 2010), we construct an aggregate EQ measure. High ranks of SMOOTH imply a high value of EQ; hence, high degree of the aggregate index of EQ indicates high EQ.
Fair value accounting (FVA)
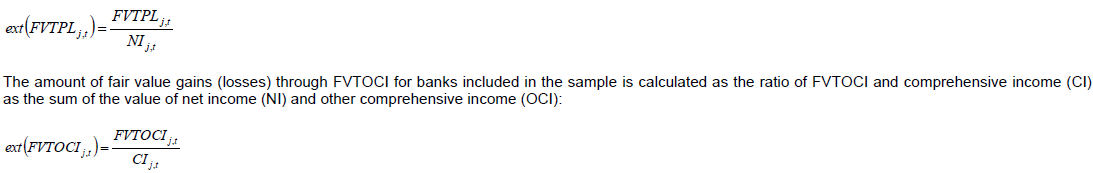
Exposure to FVA is computed by income statement approach (Hodder et al., 2006; Bratten et al., 2012). We accept that banks report a large amount of financial instruments (assets and liabilities) that are recognized at fair value according to IAS 39 - Financial Instruments: Recognition and Measurement (IFRS 9 - Financial Instruments will be effective for annual periods beginning on or after 1 January 2018). Hence, reported net gains (losses) at FVTPL and at FVTOCI are applied to measure the extent of fair values recognized in banks’ income statements. We match two different measures of reported income (that is, net income and other comprehensive income) and we focus on the impact of both fair value gains (losses) through net income (that is, profit and loss - FVTPL), and fair value gains (losses) at FVTOCI on EQ.
If assets are recognized at fair value in subsequent recognition, gains and losses are either reported completely in profit and loss or in other comprehensive income. The FVTOCI classification is required for certain debt instruments assets unless the fair value option is adopted. The statement of comprehensive income aggregates net income (profit and loss) and other comprehensive income which comprises mostly fair value adjustments that are not permitted to be included in profit and loss statement. Comprehensive income is the sum of net income and other comprehensive income, which includes items that are not recognized in income statement because they have not been realized. Thus, relative amount of FVTPL is designed as the ratio of FVTPL and net income (NI) for every bank:
Finally, control variables have been included in the regression model to lessen the noise in quantifying the influence of accounting changes on EQ (Francis et al., 2004; Ball and Shivakumar, 2005; Goncharov and Hodgson, 2008; Gaio, 2010). Based on prior EQ studies, we include in the model size and leverage as control variables (Francis et al., 2004; Burgstahler et al., 2006; Cascino et al., 2010; Gaio, 2010).
Firm size (SIZE) is often chosen as a control variable in empirical research because it is associated with the amount of cash flow and accruals, which are intrinsically related to EQ. The coefficient of the variable SIZE is estimated to be positive (Francis et al., 2004; Gaio, 2010). The variable size (SIZE) is calculated as the logarithm of total assets (Francis et al., 2004; Cascino et al., 2010; Gaio, 2010).
Leverage (LEV) is the second control variable. Leverage stands for the trade-off between tax benefits and bankruptcy costs. Particularly, the amount of leverage reveals the firm’s possible risk affecting the firm’s reporting and accrual accounting policies. The coefficient of the variable LEV is estimated to be positive (Francis et al., 2004; Gaio, 2010). The variable leverage (LEV) is calculated as the ratio of total liability to total assets (Francis et al., 2004; Cascino et al.,2010; Gaio, 2010). Table 1, panel B illustrates the definition and the construction of the explanatory variables.
Regression model
With the aim of investigating the impact of FVA on EQ, the cross-section and time series data have been scrutinized using a panel data OLS-regression model. As in many prior studies, we adopted both a descriptive analysis and a regression one to explore the combined effects of FVTPL and FVTOCI on aggregate EQ (AEQ) for selected banks.
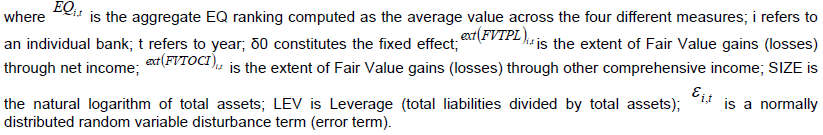
According to Gaio (2010) research methodology, we computed EQ measures for the period 2007 to 2016 for banks separately and we created an aggregate EQ measure on firm level to moderate the possible consequences of valuation errors and omitted variables bias. To calculate the aggregate EQ measure (AEQ), we constructed the AEQ variable by averaging the single EQ measures. In the first step, we calculated EQ for each bank through four specific measures: persistence, predictability, variability and smoothness. Secondly, we built the AEQ measure for each bank by averaging the ranks of the four individual quality measures.
To check the hypothesis of this research, we applied a linear regression model by including the panel data of European banks in the period 2007-2016. We selected panel data because they paved way for the variations of the cross-sectional units over time. Hence, a multivariate analysis is designed by means of an ordinary least square (OLS)-regression model. We applied a pooled least squares (OLS) method as the dataset signals that European banks react to cyclical economic trends likewise. OLS-regression model is the most reliable regression method due to its overall approach to minimize biases and alterations (Koutsoyiannis, 2003; Greene, 2004). To inspect the impact of FVA on European banks’ EQ, a linear regression model is constructed as follows:

Finally, control variables have been included in the regression model to lessen the noise in quantifying the influence of accounting changes on EQ (Francis et al., 2004; Ball and Shivakumar, 2005; Goncharov and Hodgson, 2008; Gaio, 2010). Based on prior EQ studies, we include in the model size and leverage as control variables (Francis et al., 2004; Burgstahler et al., 2006; Cascino et al., 2010; Gaio, 2010).
Firm size (SIZE) is often chosen as a control variable in empirical research because it is associated with the amount of cash flow and accruals, which are intrinsically related to EQ. The coefficient of the variable SIZE is estimated to be positive (Francis et al., 2004; Gaio, 2010). The variable size (SIZE) is calculated as the logarithm of total assets (Francis et al., 2004; Cascino et al., 2010; Gaio, 2010).
Leverage (LEV) is the second control variable. Leverage stands for the trade-off between tax benefits and bankruptcy costs. Particularly, the amount of leverage reveals the firm’s possible risk affecting the firm’s reporting and accrual accounting policies. The coefficient of the variable LEV is estimated to be positive (Francis et al., 2004; Gaio, 2010). The variable leverage (LEV) is calculated as the ratio of total liability to total assets (Francis et al., 2004; Cascino et al.,2010; Gaio, 2010). Table 1, panel B illustrates the definition and the construction of the explanatory variables.
Regression model
With the aim of investigating the impact of FVA on EQ, the cross-section and time series data have been scrutinized using a panel data OLS-regression model. As in many prior studies, we adopted both a descriptive analysis and a regression one to explore the combined effects of FVTPL and FVTOCI on aggregate EQ (AEQ) for selected banks.
According to Gaio (2010) research methodology, we computed EQ measures for the period 2007 to 2016 for banks separately and we created an aggregate EQ measure on firm level to moderate the possible consequences of valuation errors and omitted variables bias. To calculate the aggregate EQ measure (AEQ), we constructed the AEQ variable by averaging the single EQ measures. In the first step, we calculated EQ for each bank through four specific measures: persistence, predictability, variability and smoothness. Secondly, we built the AEQ measure for each bank by averaging the ranks of the four individual quality measures.
To check the hypothesis of this research, we applied a linear regression model by including the panel data of European banks in the period 2007-2016. We selected panel data because they paved way for the variations of the cross-sectional units over time. Hence, a multivariate analysis is designed by means of an ordinary least square (OLS)-regression model. We applied a pooled least squares (OLS) method as the dataset signals that European banks react to cyclical economic trends likewise. OLS-regression model is the most reliable regression method due to its overall approach to minimize biases and alterations (Koutsoyiannis, 2003; Greene, 2004). To inspect the impact of FVA on European banks’ EQ, a linear regression model is constructed as follows:
Descriptive statistics
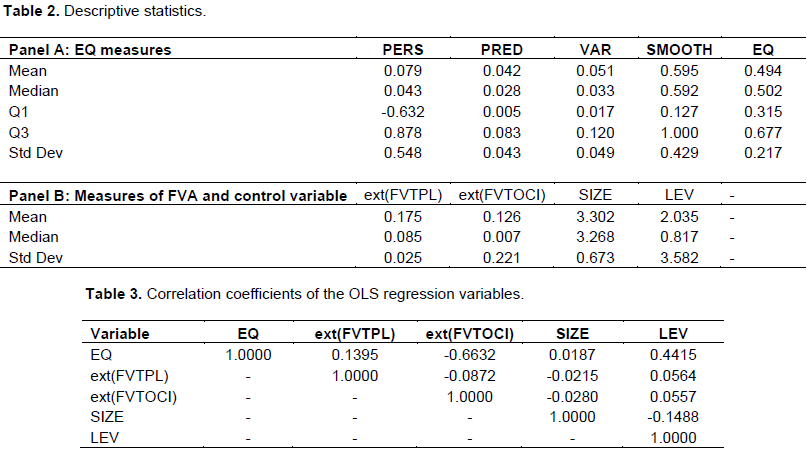
In the initial step of this empirical research, a descriptive analysis is performed. Table 2 summarizes descriptive statistics for dependent and independent variables included in the regression model for the pooled sample of banks. Panel A reports the individual EQ measures and the index of AEQ. Persistence (PERS) has a mean (median) value of 0.079 (0.043), Predictability (PRED) has a mean (median) value of 0.042 (0.028), Variability (VAR) reports a mean (median) value of 0.051 (0.033) and Smoothing (SMOOTH) has a mean (median) value of 0.595 (0.592).
Panel B lists the explanatory variables (measures of FVA) and the control variables. The mean of FVTPL is 0.175 which is lower than the proportion of banks’ Fair Value through other comprehensive income (FVTOCI) (0.426). However, median values are significantly low-grade (0.081 and 0.407) showing that most of the banks have recognized a small percentage of FVTPL and FVTOCI. EQ considers persistence, predictability, variability and smoothness.
Table 1 shows the variables definitions. We check the presence of an econometric problem of dataset included in the multivariate statistical analysis through the correlation matrix (Table 3), which contains pair wise correlations among the variables comprised in the regression analysis. By examining individual correlations between independent and dependent variables, the coefficients indicate that a multivariate regression analysis can be applied.
The variables’ independence (that is, the lack of multi collinearity problems) that may modify the findings was verified. To examine the EQ determinants, we carry out a univariate analysis. First, we estimate the Pearson and Spearman correlations to analyze the relationships between AEQ and the explanatory variables. The following Table specifies the correlation coefficients of the variables used in the regression model.
Table 3 displays that the correlation between the bank specific variables is satisfactory signifying that multi collinearity criticalities do not subsist and endorsing that the model utilized is sound and reliable (Kennedy, 2008). The correlation between each of the variables is low and the supreme degree of it is very acceptable. The highest value of the correlations is 0.4415 between LEV and AEQ. The correlations between the independent variables (FVTPL and FVTOCI) and the control variables do not exceed an absolute value of 0.0564.
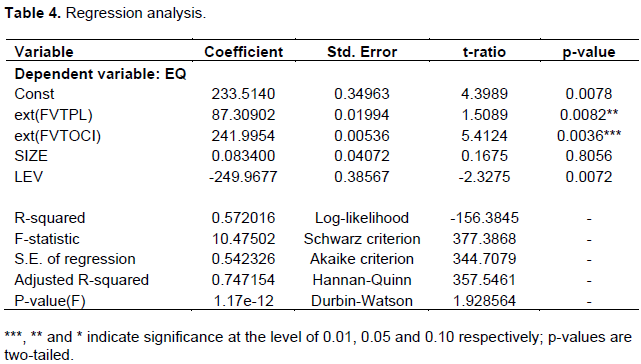
Hence, the results demonstrate that no collinearity problem exists between the independent variables since multi collinearity is a problem when the correlation exceeds 0.80 (Kennedy, 2008). Therefore, the coefficients demonstrate that a multivariate analysis can be applied. The regression results are displayed in Table 4. To save space, the full regression findings concerning each measure of EQ (which comprise both time and bank-specific fixed effects) are not described here.
In line with the study specified hypothesis, we found a relationship between AEQ and fair value measures. The preliminary results suggest that higher exposure to FVA is positively correlated to higher quality of reported earnings in European banks. FVTPL and FVTOCI have a positive impact on EQ. R-square of 0.572016 indicates that the estimated model is overall statistically significant. The coefficient of ext(FVTPL) is positive and statistically significant (coefficient = 87.30902, p-value = 0.0082), suggesting that European banks with more FVTPL result in a major level of AEQ measure.
Similar results can be found for Fair Value gains (losses) reported through FVTOCI. Estimated coefficient of ext(FVTOCI) is also positive and statistically significant (coefficient = 241.9954, p-value = 0.0036), showing that European banks with large percentage of FVTOCI have higher level of AEQ measure.
The empirical analysis confirms different estimation results. In particular, the R-square specifies how fair value gains (losses) influence AEQ and the adjusted R-squared states for the reliability of additional predictor variables with statistical shrinkage. The range between R-square and adjusted R-squared (that is, shrinkage degree) is not elevated, revealing an adequate degree of correlation between independent and dependent variables. The value of F-statistic is significant attesting the validity and the reliability of the model applied in the research.
The explanatory power of the model is soundly high as 75% of the variation of the dependent variable AEQ depends on the independent variables (the value of the R-squared adjusted is 0.747154). The EQ index is positively associated with FVTPL. Consistent with H1, the coefficient of the variable ext(FVTPL) is positive and significant at 0.05 level. Thus, the application of FVTPL increases EQ by 0.0082. The coefficient (0.0036) of FVTOCI is more significant (at the level of 0.01), but it slightly decreases in magnitude. Although the FVTOCI has the significant predictable positive sign in the model, its impact on EQ is weaker than the influence of FVTPL. Hence, the overall results show that FVA influences positively AEQ.
Regarding the association between IAS/IFRSs’ adoption and EQ, the findings confirm that the application of fair value increases EQ. The movement from HCA towards FVA is appraised to result in more relevant, timely, credible and transparent financial statements. The application of Fair Value enhances the relevance of the reported numbers because it reflects current value and has more economical meaning than HCA. Accordingly, proponents of FVA suggested several benefits resulting from its application. First, FVA well reports the bank’s exposure towards risk, especially in unstable circumstances (Hodder et al., 2006; Blankespoor et al., 2010).
Thus, market values develop effectiveness and guides toward an early revealing of bankrupt banks. Second, income smoothing and earnings management can be realized under HCA (for example, if economic results deteriorate, management can edit reported income by selling revalued assets) while under FVA the opportunity of income smoothing is reduced since Fair Value gains and losses from subsequent valuations are reflected in the income statement when they are generated.
On the contrary, opponents of FVA argue that it grows the volatility of bank’s earnings and it decreases their predictability although this additional volatility doesn’t appear to have been returned in bank share prices (Barth et al., 1995; Nelson, 1996; Eccher et al., 1996). Second, the valuation transparency in performance assessment may be uncertain in illiquid markets or when valuation techniques are applied in a particular financial report (Allen and Carletti, 2008). Third, FVA may conduct to undue leverage in booms and write-downs in busts, hence causing prociclicality (Laux and Leuz, 2009; 2010).
This study investigates the influence of FVA on EQ in European banking sector over the 2007 to 2016 period. Following prior literature, we assert that there is a gap of research concerning the impact of FVA on EQ in European banking sector.
Furthermore, most prior research examined the effects of FVA on a single earnings attribute or a subset of properties of earnings but it derived mixed and unreliable evidence. We suppose that the application of FVA may originate significant effects on EQ in European banking sector. Many empirical results from prior studies largely reinforce our hypothesis.
However, our findings demonstrate that earnings under Fair value-based reporting model have higher aggregate quality ranks for European banks. Specifically, we find primary evidence that net gains (losses) reported at Fair Value through banks’ income statement (FVTPL) and through other comprehensive income (FVTOCI) are positively associated to banks’ aggregate EQ. Moreover, findings show that the extent of Fair Value recognized through other comprehensive income (FVTOCI) is less significant in implying positive variation of EQ extents. Regarding the relation between IAS/IFRSs and FVA, we note that the design of IFRS 9 improves accounting quality and favours capital market participants and other stakeholders in decision-making process.
This research accepts the concept of EQ as a multidimensional measure and deepens the issue of EQ in European banking sector. First, we construct a multidimensional measure of EQ through four earnings attributes: persistence, predictability, variability and earnings smoothing. This study calculates EQ proxy based on reported earnings attributes; on the contrary, prior literature on the subject of FVA founded the construction of the EQ proxy on looking back adjusted income analyses or simulation procedures. Second, we analyze the role of specific accounting measurements (that is, FVTPL and FVTOCI) in influencing EQ. This allows us to offer a more comprehensive portrait of the relationship between accounting variables and EQ in the European banking sector.
This study adds to the recent discussion about FVA and, particularly, proposes different conclusions in relation to those included in earlier studies, which usually associate lower ranks of EQ with FVA. Overall, our findings provide new evidence within the banking sector in Europe and advocate the relevance of examining a number of banks’ specific accounting variables to assess the financial reporting quality of a bank. If EQ is a crucial variable employed by stakeholders to make economic decisions, it would be necessary to observe the influence of its possible determinants.
Higher quality disclosure supports investors to decide more efficiently and to reduce risk in capital allocation decisions. Our results can also assist bank managers in their decision-making and are beneficial to users of financial statements in evaluating EQ performs. Moreover, the findings may guide academics, standards setters and regulators to assess the quality of earnings in various industries other than banking industry. The empirical outcomes are robust to numerous adjustments of the model, i.e., changes of the sample composition and the extension of the time period. Nevertheless, our research has some limitations and concerns which open the way for future research.
Despite various sensitivity analyses, some questions about the “true” influence of FVA on EQ persist. Although consistent results support our prediction, these findings may potentially suffer from biases related with our intrinsic value estimation procedure. For instance, prior studies found that banks smooth earnings using discretionary loan loss provisions (Whalen, 1994; Collins et al., 1995; Beaver and Engel, 1996; Ahmed et al., 1999; Beatty et al., 2000) whereas, this research design does not consider any earnings management strategies. Since our conceptualization of earnings volatility considers reported earnings, it may be influenced by smoothing behavior. Finally, we accept earnings smoothing as a typical quality of earnings although some authors believe that earnings smoothing is also a measure of earnings management (Leuz et al., 2003).