Full Length Research Paper

ABSTRACT
Reversals of foreign portfolio equity due to a shift in investor risk appetite may have a drastic impact on the value of shares of commercial banks hence the effect on stock returns. Uncertainties in the flow of foreign portfolio investments (FPI) result in unpredictable behaviour of stock returns in Kenya’s economy and also at the firm level. The objective of this study was to find out the effect of foreign portfolio equity and exchange rate risk on stock returns of listed commercial banks in Kenya. The target population of the study was 11 commercial banks listed on the Nairobi Securities Exchange. The study used purposive sampling technique and concentrated on 10 commercial banks. This study used a causal research design and adopted a panel data regression using the Ordinary Least Squares (OLS) method where the data included time series and cross-sectional. Hausman test was carried out and findings indicated that random effects model was preferable for this study. Results from panel estimation showed that exchange rate risk affect stock returns of listed financial institutions in Kenya. The study recommended that policies that would attract foreign portfolio investment should be pursued by commercial banks in order to enhance stock returns.
Key words: Foreign portfolio equity, stock returns, exchange rate risk, commercial banks, Nairobi securities exchange, Kenya.
INTRODUCTION
Foreign portfolio investment (FPI) has become an increasingly significant part of the world economy and an important source of funds to support investment not only in developed but also developing countries. Foreign investors enter emerging markets for diversification and also to maximize returns. Financial market theory suggests that, over the long run, higher returns should compensate for the higher risks of emerging market (Tokat, 2004).
In Kenya, participation of foreign investors in the Nairobi Securities Exchange (NSE) can be traced back to 1954 when trade in shares was confined to the resident European community. The presence and dominance of foreign investors in the market declined after independence, however, protection of foreign investor interest was still given prominence and thus the Foreign Investment Protection Act (1964) was passed. The Act focused on foreign direct investors and allowed for repatriation of earnings and capital by foreign firms (Ngugi, 2003).
Foreign portfolio investment increases the liquidity of commercial banks and domestic capital markets, and can help develop market efficiency as well. As markets become more liquid, as they become deeper and broader, a wider range of investments can be financed. New enterprises, for example, have a greater chance of receiving start-up financing. Savers have more opportunity to invest with the assurance that they will be able to manage their portfolio, or sell their financial securities quickly if they need access to their savings. In this way, liquid markets can also make longer-term investment more attractive (APEC, 2000).
According to Bekaert et al. (2002), foreign portfolio investments (FPI) are reversible and tend to leave as fast as they come in an economy. Due to this, portfolio flows may have a drastic impact on Kenya’s economy and on the value of shares of companies in which foreign investors offload their holdings, hence the stability of the market in general.
An increase in FPI leads to changes in information flow, efficiency and liquidity thereby affecting stock market returns. Volatility or rapid reversal of foreign portfolio flow increases risk and uncertainty in the stock market, leading to high macroeconomic instability. Thus, it affects the value of the firm by pushing stock prices up when they come in, but down when they offload. FPI also affects the net foreign assets in form of foreign currency, hence undermining competitiveness. Sudden and large inflows of FPI lead to exchange rate appreciation and widening current account deficits.
During the past three decades, the relationship between firms’ stock returns and foreign exchange rates have been empirically analysed. Theory explained that a change in the exchange rates would affect a firm’s foreign operation and overall profits which would, in turn, affect its stock prices, depending on the multinational characteristics of the firm. Conversely, a general downward movement of the stock market will motivate investors to seek for better returns elsewhere. This decreases the demand for money, pushing interest rates down, causing further outflow of funds and hence depreciating the currency. While the theoretical explanation was clear, empirical evidence was mixed.
METHODOLOGY
Research design
The design of the study was causal as it seeks to test for the existence of cause-and-effect relationships among variables (Cooper and Schindler, 2004). This design is suitable in studies which aim to determine whether a group of variables together influence a given dependant variable (Saunders et al., 2009). The design was suitable for this study as it aimed to establish the effect of foreign portfolio investments on stock returns.
Target population
The study focused on a population of 11 listed commercial banks in
Kenya. The 11 listed commercial banks trade the securities in NSE.
Data collection
The study used panel financial data over the seven year period (January, 2008 to December, 2014) to find the effect of foreign portfolio equity (sales, purchases and turnover) and exchange rate risk on stock returns of listed commercial banks in Kenya. Regression coefficients were interpreted using the E-views software output. To ensure that enough degrees of freedom in the models to be estimated are available, monthly data covering the entire study period was collected resulting to 7392 observations. The method of data collection was secondary research, which essentially involved reviewing data sources that were collected for some other purpose than the study at hand. Thus, all the relevant data for this study were available in secondary form. The main sources of data were: Central Bank of Kenya, Capital markets Authority, Nairobi Securities Exchanges and Kenya Bureaus of Statistics.
Measurement of variables
Stock returns (SR)
Stock return is defined as the increase in the value of an investment over a period of time, expressed as a percentage of the value of the investment at the start of the period. Stock return in this study was computed as:

It is measured by changes in share prices.
Exchange rate risk (ERR)
ERR is measured as the change in monthly exchange rate to the US dollar. Changes in exchange rate create uncertainty in the market about the stability of macroeconomic policy. Exchange rate risk reduces confidence in the market and hence affect share prices either because of uncertain future returns or because investors will be pulling out of the market. Change in exchange rate is expected to be negatively related to stock returns.
Data analysis
This study adopted a panel data regression using the Ordinary Least Squares (OLS) method where the data included time series and cross-sectional data that was pooled into a panel data set and estimated using panel data regression.
Justification for use of panel data approach
Panel data is also called pooled or combined data since there are elements of both time series and cross section data. According to Damodar and Sangeetha (2007), panel data has a number of advantages. First, since panel data relate to individuals e.g. firms over time, there is bound to be heterogeneity in these units. The technique of panel data estimation takes such heterogeneity explicitly into account by allowing for individual specific variables. Secondly, by combining time series of cross section observations, panel data give more informative data, more variability, less collinearity among variables, more degrees of freedom and more efficiency. Thirdly, by making data available for several units, panel data can minimise the bias that might result if the study aggregate individuals into broad aggregates. These advantages enrich panel data empirical analysis in ways that may not be possible if only cross-section or time series data is used, hence the use of panel data in this study.
Descriptive Statistics
Descriptive statistics was essential in determining the statistical properties of the model so as to select the proper functional form of the estimable model. Therefore the study sought to determine the spread of the data which included calculating for the mean, standard deviation, standard errors, maximum and minimum values of the variables overtime. This also involved finding correlation matrix so as to check which variables were highly correlated so as to avoid the problem of multi-collinearity which is a common problem in time series data.
Model specification, estimation and rationale of variables
The study hypotheses were measured using one panel data regression equation. The equation had Stock returns (SR) as the dependent variable and Foreign portfolio equity sales (FPES), Foreign portfolio equity purchases (FPEP), Foreign portfolio equity turnover (FPET) and Exchange rate risk (ERR) as independent variables. Treasury bill rate (TBIL), Inflation rate (INFL) and Market capitalization (MCAP) were the control/intervening variables in the study. The regression analysis used E-views 7 data analysis software. The hypotheses were tested using the following regression model;
SRit = α + β1FPESit+ β2FPEPit+ β3FPETit+ β4ERRit + β5TBILit + β6INFLit + β7MCAPit + μit
Where;
SRit = Stock returns at time t
FPESit = Foreign portfolio equity sales at time t
FPEPit = Foreign portfolio equity purchases at time t
FPETit = Foreign portfolio equity turnover at time t
ERRit = Exchange rate risk at time t
TBILit = Treasury bill rate at time t
INFLit = Inflation rate at time t
MCAPit = Market capitalization at time t
α = The intercept
βi = The parameter of explanatory variables of FPES, FPEP, FPET, ERR,TBIL, INFL and MCAP
μi = The disturbance term
Unit root tests
A unit root test was carried in this study to examine stationarity of variables because it used panel data which combined both cross-sectional and time series information. A variable is said to be stationary if it displays mean-reverting behaviour implying that its mean remains constant over time (Hlouska and Wagner, 2005). Any regression with non-stationary variables is invalid and hence, any time series application must start with testing stationarity of the data (Charito, 2010). This study used Levin, Lin and Chu unit root test to examine stationarity. Levin, Lin and Chu suggested the following hypothesis:
H0 = each time series contains a unit root
H1 = each time series is stationary
Choice of model: Testing for the validity of the fixed effects model
Panel data analysis has three more-or-less independent approaches: Pooled panels; assumes that there are no unique attributes of individuals within the measurement set, and no universal effects across time. Fixed effects models; assumes that there are unique attributes of individuals that are not the results of random variation and that do not vary across time. It assumes differences in intercepts across groups or time periods. Random effects models; assumes there are unique, time constant attributes of individuals that are the results of random variation and do not correlate with the individual regressors. This model is adequate if the study want to draw inferences about the whole population, not only the examined sample.
The choice of the appropriate model depends upon the objective of the analysis, and the problems concerning the exogeneity of the explanatory variables. The last two models were considered in this analysis since pooled regression model assumes that all the financial institutions are the same which is not the case. The Pooled regression model assumes that the coefficients (including the intercepts) are the same for all the financial institutions. The fixed and random effects models cater for heterogeneity or individuality among the financial institutions by allowing each financial institution to have its own intercept value which is time invariant. As to which model between the fixed and random is appropriate, the study used the Hausman test.
Discussion of findings
The effect of foreign portfolio equity and exchange rate risk on stock returns of listed commercial banks in Kenya
In the case of commercial banks, the Hausman test had a chi square statistic of 0.000000 with an insignificant probability value of 1.0000 meaning that the study should reject the fixed effect model in favour of the random effects model as presented in Table 1. The results from panel estimation output for the effect of foreign portfolio equity and exchange rate risk on stock returns of listed commercial banks in Kenya are shown in the Table 2.

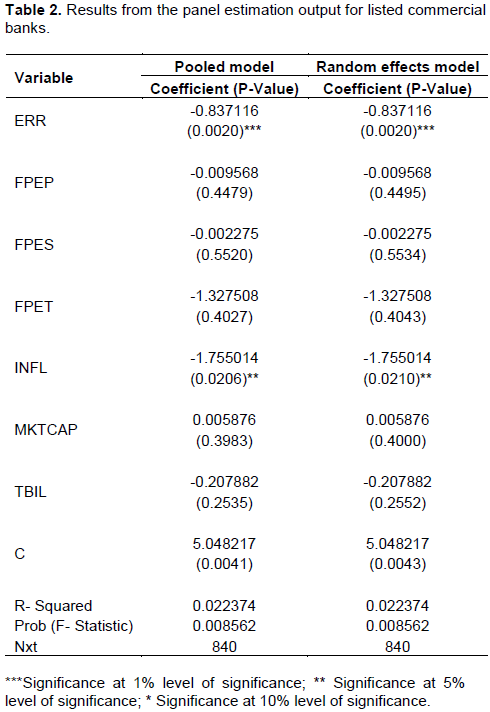
The results for listed commercial banks when tested independently showed varying findings. Foreign portfolio equity sales had a coefficient -0.0022 and an insignificant probability value of 0.5534 for commercial banks. The results showed that foreign portfolio equity sales do not affect stock returns. The results are in support the work of Meurer (2006) who studied the behaviour shown by international investors in the Brazilian stock market. Meurer found out that portfolio flows are higher when the index is low, and the outflows are higher when the index is high, showing that portfolio investors are trying to operate in the opposite way with respect to the market, buying stocks when prices are low and selling when prices are high, chasing profitable opportunities.
Foreign portfolio equity purchases had a coefficient of -0.0095 and an insignificant probability value of 0.4495. The results are statistically insignificant meaning that foreign portfolio equity purchases for commercial banks do not affect stock returns. The results contradicted with the work of Luciana et al. (2010) who examined the relationship between stock returns and foreign investment in Brazil. They concluded that the inflows of foreign investment boosted the returns from 1995 to 2005. This suggested that positive feedback trading played a role, and that the market promptly assimilated the relevant new information that arrived.
Foreign portfolio equity turnover had a coefficient of -1.327 and a probability value of 0.4043 for commercial banks and a coefficient of -0.5559 which is statistically insignificant. Therefore, foreign portfolio equity turnover do not affect stock returns of both commercial banks. The results were not consistent with the work of Griffin et al. (2004) who used daily data on equity flows for nine emerging market countries and found that equity flows are positively related to host country stock returns as well as market performance abroad.
Exchange rate risk had a significant negative coefficient of -0.8371 with a P- value of 0.0020 for banking institution and negative coefficient of -0.6023 with a significant P- Value of 0.0673 for non- commercial banks. The results are statistically significant at one percent level of significance for commercial banks. The banks’ exposure to exchange rate risk has grown in importance due to the continuing expansion of foreign currency business, greater variability of exchange rates, and increase in foreign exchange deposits and foreign borrowing in the Kenyan banking sector. The findings are in line with the work done by Muller and Verschoor (2007). Muller and Verschoor (2007) examined the relationship between individual Asian firm’s stock returns and fluctuations in foreign exchange rates. Among 3634 firms from Hong Kong, Indonesia, South Korea, Malaysia, Philippine, Singapore and Thailand, 25 percent experienced economically significant exposure effects to the US dollar, and 22.5 percent to the Japanese yen for the period of January 1993 to January 2003. Reviewing the empirical literature, previous researchers investigated the effect of both contemporaneous and lagged exchange rate changes on current stock returns.
Inflation had significant negative coefficient of -1.7550 with a P- value of 0.0210 in relation to stock returns for commercial banks. The results indicate that the stock returns of commercial banks are affected by inflation. The results supported prior expectation that an increase in inflation erodes the value of shares resulting to decrease in stock returns of commercial banks.
Treasury bills rate had insignificant negative coefficient of -0.2078 with a P-value of 0.2552 in relation to stock returns indicating that treasury bills rate do not affect the stock returns of commercial banks. The findings support the work done by Joseph and Vezos (2006) who investigated the impact of interest rates changes on US bank's stock returns. Joseph and Vezos (2006) study employed an Exponential Generalised Autoregressive Conditional Heteroscedastic model to account for the Autoregressive Conditional Heteroscedastic (ARCH) effects in daily returns instead of standard ordinary Least Square estimation methods with the result that the presence of ARCH effects would had affected estimation efficiency.
The results suggested that the market return accounted for most of the variation in stock returns at both the individual bank and portfolio levels; and the degree of the sensitivity of the stock returns to interest rate changes was not very pronounced despite the use of high frequency data.
Market capitalization had insignificant positive coefficient of 0.00587 with a P- value of 0.4000 indicating that market capitalization do not affect the stock returns of banking and non-commercial banks. This is not in line with prior expectations which believed that large firms as measured by higher market capitalization are expected to have higher returns.
The probability F-statistic is 0.008 for banking institution meaning that the model is stable and significant at one percent level of significance. The probability F- statistic for non-commercial banks is 0.5086.
Summary of the findings
The effect of foreign portfolio equity and exchange rate risk on stock returns of listed commercial banks in Kenya
The panel estimation output results for commercial banks indicated the following;
Foreign portfolio equity sales for commercial banks had a coefficient -0.0022 and an insignificant probability value of 0.5534 meaning that foreign portfolio equity sales do not affect stock returns of commercial banks. Foreign portfolio equity purchases had a coefficient of -0.0095 and an insignificant probability value of 0.4495 for commercial banks. Foreign portfolio equity turnover had a coefficient of -1.3275 and a probability value of 0.4043 for commercial banks. Exchange rate risk had a negative coefficient of -0.8371 with a statistically significant P- value of 0.0020 for commercial banks indicating that exchange rate do have significant effect on stock returns of commercial banks at one percent level of significance. The null hypothesis stating that there is no significant effect of foreign portfolio equity (sales, purchases and turnover) and exchange rate risk on stock returns of listed commercial banks in Kenya is rejected.
CONCLUSION
The study found that exchange rate risks do affect stock returns of listed commercial banks in Kenya. The study further found out that foreign portfolio equity sales, foreign portfolio equity purchases and foreign portfolio equity turnover do not affect stock returns of commercial banks. The study concluded that listed commercial banks engaged more in forex transaction and most of this banks are multinational banks hence the ease to attract foreign investors to buy the shares of their companies.
RECOMMENDATION
The study recommended management of foreign equity flows in Kenya’s financial sector through some non-radical interventions such as building of reserves by commercial banks to guard against reversals. The government of Kenya should enhance stability of macroeconomic factors such as foreign exchange rate through monetary policy as they affect the performance of securities exchange hence stock returns.
ACKNOWLEDGEMENTS
The authors would like to express their sincere gratitude to their supervisors; Dr. Lawrence Kibet and Dr. Andrew Nyang’au for the invaluable advice, constructive comments and for the excellent and supportive supervision of the authors Thesis. The time they took reading and giving advice is much appreciated. May God richly bless them beyond measure.
CONFLICTS OF INTERESTS
The authors have not declared any conflict of interests.
REFERENCES
|
Asia-Pacific Economic Cooperation (2000). Voluntary Action Plan for Promoting Freer and More Stable Capital Flows, report presented to APEC finance ministers. |
|
|
Bekaert G, Harvey CR, Lumsdaine RL (2002). The Dynamics of Emerging Market Equity Flows. J. Int. Money Fin. 21:295-350. |
|
|
Brudel J (2005). Panel data analysis. |
|
|
Charito BJ (2010). The evolution of corporate governance in an emerging market: Evidence from Philippine initial public offerings (IPO) Discussion Papers, No. 1002. |
|
|
Cooper RD, Schindler PS (2004). Business Research Methods. Eight Edition . Tata McGraw-Hill. New Delhi, India. |
|
|
Damodar N, Sangeetha (2007). Basic Econometrics. Fourth Edition, Tata McGraw-Hill Publishing Company Limited in New Delhi in India. |
|
|
Feldstein M (1980). Inflation and the Stock Market. Am. Econ. Rev. 70(5):839-947. |
|
|
Griffin JM, Harris JH, Topaloglu S (2003). The dynamics of institutional and individual trading. J. Financ. 58:2285-2320. |
|
|
Griffin JM, Nardari F, Stulz RM (2004). Are daily cross-border equity flows pushed or pulled? Rev. Econ. Stat. 86:641-657. |
|
|
Hlouska J, Wagner M (2005). The performance of panel unit root and stationarity tests: results from large scale simulation study. European Economic Institute. Working paper, No 5. |
|
|
Joseph NL, Vezos P (2006). The sensitivity of US banks' stock returns to interest and exchange rate changes. Manager. Fin. 32(2):182-199. |
|
|
Luciana R, Roberto M, Sergio D (2010). Stock returns and foreign investment in Brazil, Appl. Financ. Econ. 20(17):1351-1361. |
|
|
Meurer R (2006). The behaviour shown by international investors in the Brazilian stock market. Brazil J. Fin. 4(1):345-361. |
|
|
Muller A, Verschoor FC (2007). Asian Foreign Exchange Risk Exposure. J. Jap. Int. Econ. 21(1):16-37. |
|
|
Ngugi RW (2003). Development of the Nairobi Stock Exchange: A historical perspective (Discussion paper No. 27). Nairobi: Kenya Institute for Public Policy Research and Analysis. |
|
|
Park HM (2011). Practical Guides to Panel Data Modeling: A Step by Step Analysis Using Stata. |
|
|
Saunders M, Lewis P, Thornhill A (2009). Research Methods for Business Students.'5th Edition. Prentice Hall. |
|
|
Schmidheiny K (2013). Panel Data: Fixed and Random Effects: |
|
|
Stulz RM (1999). International Portfolio Flows and Security Markets. Unpublished Working Paper, Ohio State University, Columbus, Ohio. |
|
|
Tokat Y (2004). International Equity Investing: Investing in Emerging Markets. Investment Counseling and Research, the Vanguard group. |
|
Copyright © 2024 Author(s) retain the copyright of this article.
This article is published under the terms of the Creative Commons Attribution License 4.0


