Full Length Research Paper

ABSTRACT
The impact of certain unregulated land-use activities harms the quality of water resources and reduces the sufficiency of drinking water in many developing countries. This study aimed to capture the impact of such activities and evaluate the specific groundwater vulnerability using a modified DRASTIC approach. The DRASTIC-LuPa was proposed and implemented for Aba City, Nigeria by incorporating land-use and the impact of pumping layers to the “intrinsic” DRASTIC parameters. The results of the analysis revealed that the area classified as “low” was 15 and 79.1% as “medium” and 5.9% as “high” vulnerability classes for the DRASTIC. Whereas for the DRASTIC-LuPa model 3.2% for “low”, 54.3% for “medium”, 41.8% for “high” and 0.7% for “very high” were found. The transitions in the vulnerability classes of areas displaying “high” and “very high” found in the DRASTIC-LuPa model represent the impact of urban hotspots observed in the area. This result implies that groundwater protection measures should be implemented in the area designated with “low” and “medium” vulnerability classes and used for abstracting clean water for drinking purposes. The proposed model enhances the predictability and guarantees better transferability of the approach in urban settings with similar urban trends.
Key words: Drinking water, DRASTIC, groundwater, groundwater vulnerability assessment, Nigeria.
Abbreviation: AVI, Aquifer vulnerability index; COP, concentration of flow, overlaying layer and precipitation; DEM, digital elevation model; DRASTIC, depth to the water, net recharge rate, aquifer material, soil type, topography, impact of vadose and hydraulic conductivity; DRASTIC-LuPa, depth to the water, net recharge rate, aquifer material, soil type, topography, impact of vadose, hydraulic conductivity, land-use and impact of active pumps; EPIK, Epikarst, protective cover, infiltration conditions, Karst network development; GLEAMS, groundwater loading effects of agricultural management systems; GOD, groundwater hydraulic confinement, aquifer overlaying strata resistivity and depth to the water table; HSPF, hydrological simulation program Fortran; MODFLOW, MODular groundwater FLOW model; SEEPAGE, system for early evaluation of pollution potential from agricultural groundwater environments; SINTACS, Soggienza-depth to groundwater (S); Infiltrazione - effective Infiltration (I); Non saturo -unsaturated zone attenuation capacity (N), Tipologia della copertura - Soil overburden attenuation capacity (T); Acquifero - Saturated zone features (A), Conducibilità - Hydraulic Conductivity (C), and Superficie topografica - Topographic surface slope (S); SRTM, shuttle radar topographic mission; SWAT, soil and water analysis tool; TPH, total petroleum hydrocarbon; WQI, water quality index.INTRODUCTION
Groundwater remains the source of water for about half of the world’s population (Kemper, 2004). Studies have shown that in developing countries groundwater is used mainly for domestic and agricultural purposes (Doungmanee, 2016; FAO, 2020). With changing climate, rapid economic and population rise observed in these countries, the groundwater has been under severe stress due to unregulated withdrawals. Again, further reduction in access to groundwater has continued due to anthropogenic contaminations resulting from poor urban implementation. Therefore, it is necessary to develop strategies to guarantee the sustainable use of this “invisible public good”. The management of groundwater resources can be performed either by planned physical monitoring or through computational modelling if sufficient data is available (Jang et al., 2017). The principle of digital risk management practices suggests identifying areas with high vulnerability potentials to reduce frequent monitoring and costs. This is because sampling and monitoring activities consume a lot of time and are expensive to execute over a large area.
The concept of groundwater vulnerability assessment is one of the management approaches that evaluate the physical properties of aquifers and ensure the sustainable use of the resource. Most vulnerability assessment methods bring natural (e.g., hydrogeological parameters) and/or human-induced activities that deteriorate groundwater qualities together to evaluate the contamination risk (Vrba and Zoporozec, 1994). When the vulnerability is influenced by only hydrogeological factors, it is described as “intrinsic vulnerability”. Whereas if it is caused by hydrogeological and human-induced components, then it is referred to as “specific vulnerability” (Frind et al., 2006). The knowledge of the vulnerability types helps to plan monitoring activities to protect the groundwater quality (Saatsaz et al., 2011; Jang et al., 2017).
In different parts of the world, several methods have been developed to evaluate the vulnerability of groundwater to contamination. The assessment method may be objective or subjective depending on the data requirement (Sorichetta, 2010). The objective methods use numerical data, while the subjective ones employ qualitative parameters that influence the hydrological complex (UNESCO, 2004; Sorichetta, 2010). The suitability of each approach depends on factors such as the study objectives, availability of the input data, financial budget, as well as, technical competence required to execute the method (Jang et al., 2017). Some examples of objective methods are process-based models such as SWAT, GLEAMS, HSPF, and MODFLOW (Jang et al., 2017). These models follow some numerical principles and require extended input data to predict groundwater vulnerability.
Again, some statistical methods have been used for groundwater vulnerability assessments. These assessment methods are objective just like the numerical process-based counterparts. Some examples of statistical approaches include the Bayesian theorem (Arthur et al., 2007; Sorichetta, 2010) or log-linear weight of evident (WofE) (Massetti et al., 2008; Sorichetta, 2010) and logistic regression methods (Mair and El-Kadi, 2013; Adiat et al., 2020).
Most groundwater vulnerability assessment studies in developing countries utilize subjective methods. These indexed-based methods are most commonly used because organizing the data is easier and the execution is straightforward compared to the process-based and statistical methods. Some examples include the DRASTIC (Aller et al., 1987), GOD (Foster, 1987), SEEPAGE (Moore and John, 1990), SINTACS (Civita et al., 1991), AVI (Van Stempvoort et al., 1993), EPIK (Dörfliger and Zwahlen, 1998; Doerfliger et al., 1999), COP (Vias et al., 2006), etc.
The DRASTIC is the most widely applied subjective method and will be considered in this study. It has the main advantage of predicting precisely degrees of vulnerabilities in complex geological features, using intrinsic properties of the aquifer. The DRASTIC approach has been modified in many studies to improve its predictive capability and address specific vulnerability issues (Jasem, 2010; Moustafa, 2019; Jhariya et al., 2019). The modification in the method can be done to capture the impact of human activities on the groundwater quality. This can be achieved by incorporating additional human-induced settings that can influence the groundwater quality, besides the DRASTIC parameters (Secunda et al., 1998; Ijeh 2013; Amadi et al., 2014; Singh et al., 2015; Kumar and Krishna, 2019).
Most of Global South’s developing urban areas are described by increasing population and economic trends. Weak institutions, as well as the lack of maintenance and expanding existing infrastructures, have led to certain unregulated land-use activities and poor environmental practices that have been reported by Egboka et al. (1989) and Ijioma (2021b). These practices complicate urban hydrology (Wakode, 2016), and worsen the quality of the groundwater, as well as its management. This study aimed to characterize the vulnerability of groundwater in such developing urban settings, by enhancing the predictability of the DRASTIC approach. The specific objectives were (a) to identify appropriate anthropogenic layers that influence the hydrologic settings, (b) add these layers into the DRASTIC model, (c) evaluate the difference between the classical DRASTIC and the proposed modified model, as well as (d) recommend the applicability and transferability of the proposed method in the context of other developing urban settings.
MATERIAL AND METHODS
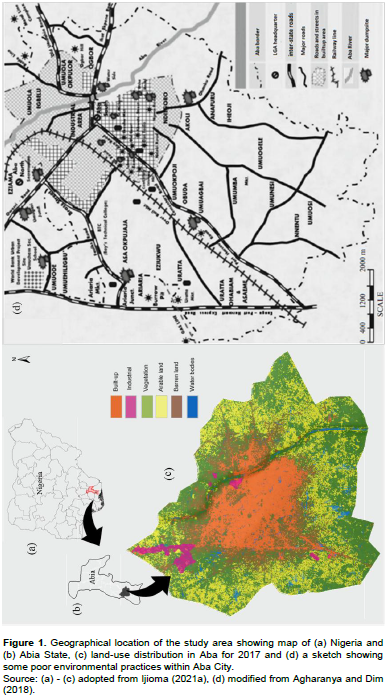
This study is focused on Aba City, a commercial hub in Abia State, southeast Nigeria (Figure 1a and b). The estimated number of people living in the area is over one million since the last population census of Nigeria was conducted in 2006 (baseline data source was obtained from the Department of Health in the local government areas making up Aba City). The area covers about 236 km2 and it is situated in the rainforest agro-ecological zone of Nigeria. There are two main climate seasons, the rainy season between April and October and the dry between November and March, in the area. The average annual temperature is 27.6°C and the average annual rainfall between 1980 and 2019 is 2450 mm/annum. This amount of annual rainfall showed that the area is ultra-humid. The regional actual evapotranspiration lies between 800 and 1000 mm/annum (Hayward and Oguntoyinbo, 1987). The current water supply system in the area is privately controlled (Ijioma, 2021b). This is because the public supply system operated by state-owned water boards is dysfunctional in most urban parts of Nigeria (Macheve et al., 2015). Groundwater is obtained from private tube wells and it serves as the main source of water for domestic, commercial and industrial uses. However, the installation of these tube wells is poorly regulated, indiscriminate and takes place without licensing. Again, there is no central sewage system to manage the residential, municipal and industrial effluents. This has led to the use of cesspools, septic systems, and the discharge of effluents from both commercial and industrial facilities directly into the aquifer. These types of effluent disposal systems form alternative groundwater recharge sources that can harm the quality. A high chemical and poor bacteriological loading in the densest urbanized parts have been reported in Ijioma (2021b). With the growing population, economic and urbanization trends come with environmental challenges arising from poor handling of municipal wastes in the area. The waste management practices are crude and ineffective in handling tons of refuse generated. The wastes generated are not separated, and collection buckets are sporadically seen over-whelmed in different parts of the area (Figure 1d) and borrow pits are used as landfills. This type of developing urban scenario is not peculiar to Aba City alone, but it is common in many developing urban settings.
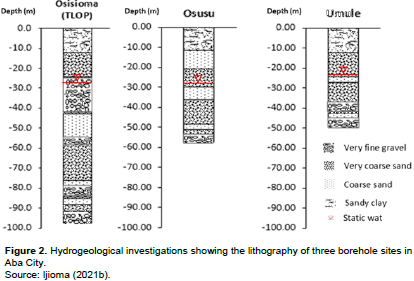
The Benin formation constitutes the parent geology, which is composed of the coastal plain sand. The lithological characterization in this study was derived from three borehole hydrogeological investigations up to the first 100 m depths in different parts of the area (Figure 2). The borehole log hydrogeological investigation revealed the different layers and textures. The strata are made up of medium to coarse to very coarse sand, as well as very fine gravels fairly distributed throughout the area. The groundwater elevation tables range between 26.3 and 30 m in the tube wells. The results imply that the elevation of the water table is deep, and groundwater abstraction is facilitated with submersible motor (SUMO) pumps in the tube wells for the water supply. The average result of the pump test revealed an estimated aquifer yield at 4.5 l/s.
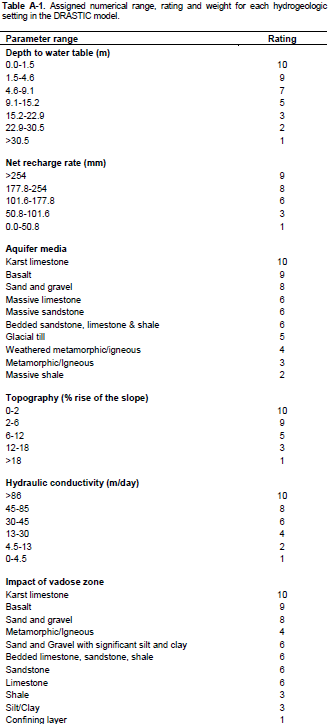
The concept of groundwater vulnerability assessment assumes that the susceptibility of the aquifer depends on the extent of physical protection, which the groundwater gets from the covering layers. The DRASTIC method assumes that the contamination of groundwater begins at the surface, and it is conveyed by rainwater through the unsaturated zone to the groundwater in the saturated zone. The acronym DRASTIC represents seven hydrometeorological and geological parameters, which include depth to the water table [D], net recharge rate [R], aquifer media [A], soil media [S], topography [T], the impact of the vadose zone [I] and hydraulic conductivity [C]. The method addresses generally two sets of potential contamination sources: general and agriculture. However, this study deals with the general contamination potential since the aquifer in the area is minimally influenced by agricultural land use. The evaluation procedure assigns each parameter with a weight from 1 to 5. Parameters with higher contamination potentials are assigned higher values. Each parameter has a range, which is interpreted as the extent to which they can influence the quality of the groundwater. These ranges are assigned rating values from 1 to 10. The ranges, rating, and weights for each of the intrinsic aquifer parameters were predefined in Aller et al. (1987) for the DRASTIC (Table A-1 in Appendix 1). The DRASTIC index [DVI] is calculated as the sum of the products of the weight and rating for the DRASTIC parameters as expressed in Equation 1.

where j = total number of hydrogeologic settings (parameters) considered, i = ith parameter, w = weight assigned to ith parameter, r = rating of the ith parameter.

Equation 1 can be rewritten in a simpler algebra expression as in (Equation 2).
DVI = DwDr + RwRr + AwAr + SwSr + TwTr + IwIr + CwCr (2)
Equation 2 expresses the intrinsic properties of the aquifer since only hydrogeological parameters were considered. To modify the expression, the influence of land use [Lu] and the impact of the active pumps [Pa] layers were introduced. These mappable layers were identified because they can influence the quality of groundwater in a poorly regulated environment. The modified expression addressed the specific groundwater vulnerability given by Equation 3.
DVIm = DVI - RwRr + ([Rm]w [Rm]r + [Lu]w* [Lu]r + [Pa]w* [Pa]r) (3)
where DVIm = DRASTIC-LuPa.
For the modified model, the weight, range, and ratings of the land use map were adopted from Kumar and Krishna (2019). The calculated minimum and maximum indices of the DRASTIC and DRASTIC-LuPa models lie between 24 - 220 and 34 - 340, respectively. The indices are categorized into five vulnerability classes by dividing them equally. The categorization of the classes has been summarized in Table 1. Each vulnerability class describes the susceptibility of the groundwater to contamination. This means the higher the index, the more vulnerable is the groundwater to contamination. The indices are dimensionless for both models.

The high rating suggests that the range make the aquifer more vulnerable to contamination. This makes the method less subjective and easy to implement with the ratings and ranges already predefined and provided for different scenarios. Then, adopting, reproducing and transferring the model becomes simple to apply in different local situations.
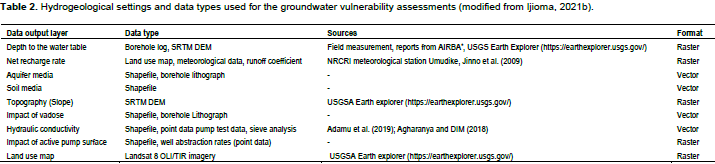
The sources and data types used to create the thematic maps for the groundwater vulnerability assessment models are summarized in Table 2. All the maps produced from vector data were converted into raster and the grid sizes resampled equally.
The DRASTIC method utilizes intrinsic hydrogeologic properties as input data for its assessment. The combined impact of these properties contributes to the overall vulnerability of the groundwater. The creation of the thematic/rating maps is described in the following.
Depth to the water table [D]: The water-table elevation map of the area was created from borehole dippings of selected wells based on availability. The data was augmented with records from local drillers in the area. The depth to the water table map was obtained by subtracting the water-table elevation map from the reference elevation map extracted, that is, SRTM DEM for the area (DEM resolution ≈ 30 m). The reference DEM served as a standard surface above sea level for the water table elevation map correction (Adams, 2013).
Net groundwater recharge rate [R]: The net groundwater recharge rating map was based on the effective groundwater infiltration rate described in Bazimenyera and Zhonghua (2008) and Sorichetta (2010). The concept employed the water balance method and utilized data from the hydrological parameters (e.g., rainfall, evapotranspiration and runoff coefficients). The land-use map identified four important classes, which include the built-up, barren-land, arable-land, and broadleaf vegetated land for this evaluation. The net recharge rating for each land-use class was calculated according to Equation 4:
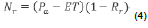
where Nr = Net infiltration rate; Pa= Average annual rainfall (mm/annum); ET = Average annual (upper and lower limits) evapotranspiration (mm/annum); Rr = Surface runoff coefficient for different ground surface; (1- Rr) = infiltration coefficient.
The surface run-off coefficients corresponding to the identified land use classes were adapted from Jinno et al. (2009) and used to calculate the net recharge in each land-use class. Intrinsically, the following assumptions were made in the estimation of the net recharge rating map.
(1) The rainfall distribution was uniform throughout the area;
(2) Groundwater recharge is only rainfed and all infiltrated rainwater constitute recharge;
(3) Impervious land surface reduces the net recharge rate, and
(4) The surface runoff coefficient is inversely proportional to the infiltration coefficient.
Aquifer media [A]: The lithographical information of the boreholes in Figure 2 was used to characterize the aquifer media in the area. The results revealed that the aquifer media consist mostly of medium-coarse-grained sand to very fine gravel. The geology of the area is simply coastal plain sand and the lithology confirmed the same. It was assumed that the aquifer is the same throughout the area and a uniform surface was created in this respect.
Soil media [S]: The soil media rating map was derived from documented field investigations that have characterized the soil in parts of the study area (Adindu et al., 2013; Adamu et al., 2019). The USDA classification of the soil texture at the sites of these studies revealed that the soil predominantly comprises sandy-silty-clay (sandy loam) sand type. When the study area was extracted from the soil map of Nigeria (ESDAC, 1990) a uniform distribution was observed throughout the area. The rating was assigned based on the recommendations of Aller et al. (1987) in Table A-1.
Topography/Slope [T]: The topography rating map was derived from the extracted filled SRTM DEM for the study area. The slopes of the filled DEM were generated in the GIS platform and distributions were reclassified. The outcome of the reclassification followed the recommendations of Aller et al. (1987) as described in the appendix (Table A-1).
Impact of the vadose zone [I]: The vadose zone is defined as the geological overburden above the saturated zone. It is part of the geological overburden under the soil, but on top of the saturated zone. It determines to what extent contaminants attenuation happen before they reach the saturated. The lithography information showed that the vadose consists of materials mostly sandy clay, as well as medium to coarse-grain sand and very fine gravel with silty facies in the area.
Hydraulic conductivity [C]: The data used to create the rating map was collated from documented field experiments. These include laboratory methods - sieve analysis (Agharanya and Dim, 2018), pump test (Adamu et al., 2019) and analysis of soil texture or grain sizes (Ijioma, 2021b) conducted at sites in different local government areas that make up the study area.
It has been observed that unregulated human activities in urban settings of many developing countries harm groundwater quality (Ijioma, 2021a). Two additional rating maps were identified and integrated into the DRASTIC model to enhance the reliability of the vulnerability assessment for Aba City. The parameters captured the impact of poor land-use practices, which is common in many developing countries. The modification incorporates both the land-use (Lu) map with a special focus on some identified contamination hotspot activities and the impact of active pumps (Pa) as part of the rating maps to implement the proposed DRASTIC-LuPa model.
Land-use [Lu]: The land use map was derived from the Landsat imagery of the area for 2017 using remote sensing techniques. The supervised classification approach based on the maximum likelihood method was used for the characterization as described in Ijioma (2021b). Rasterized polygons of the industrial zones were created and joined to the land map. One of the major urban land-use activities in the built-up parts that can influence groundwater quality is the use of septic drains. This is found in most built-up parts since the area has no central sewerage system to handle the municipal effluent. These two urban features characterize important potential contamination sources in the land-use rating map that harm the groundwater quality.
Impact of active pumps [Pa]: The active pumps can affect the lateral and vertical movements of the groundwater within the aquifer and this could harm the quality of the groundwater if poor environmental management practices prevail around the radius of influence of the pump. The impact of the active pump rating map was created using extraction data of pumps for domestic, industrial and commercial activities within the study area. The pump selection was based on availability and accessibility since these are not monitoring wells. Data for 234 pumps were collected and these pumps were categorized into subclasses according to their daily withdrawal rates. The impact of the active pump rating map was created using the ordinary kriging interpolation of the pumps points and their daily withdrawal rates.
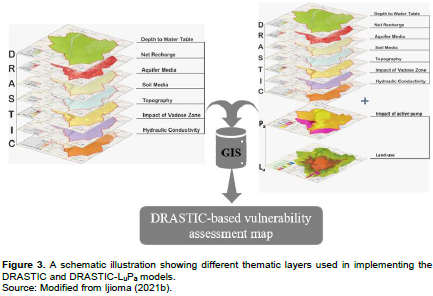
The implementation of the vulnerability models followed a GIS-based approach. The GIS platform serves as a database to store and process the thematic/rating maps. Figure 3 schematically demonstrates the overlaying of the different rating maps required for each model. The weights and rates for each thematic parameter were appropriately assigned to the different raster pixels on the rating maps. The implementations of the models were executed with the raster calculator function in the spatial analyst toolbox of ArcGIS 10.7 following Equations 2 and 3 for DRASTIC and DRASTIC-LuPa respectively.
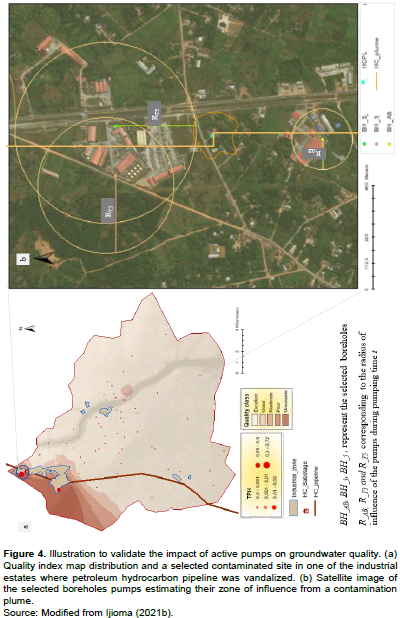
Eight water quality indicators were used to develop a groundwater quality index distribution map (Figure 4a) using the geometric weighted sub-index aggregation method. The procedures for the water quality index map derivation are described in Ijioma (2021b).
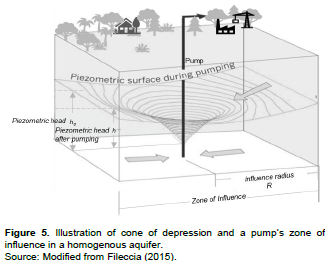
The map revealed that the groundwater has been contaminated with petroleum products and unfit for drinking in the northwestern parts. This portion of the area was selected to validate the impact of pumping on the hydrogeologic setting since the quality of the groundwater in the remaining parts is evenly spread and acceptable for drinking. The influence of pumping activities caused a 2-dimensional flow (that is, lateral and perpendicular) of the groundwater and around the pump. During pumping, a cone of depression and zone of influence is formed (Figure 5). The empirical estimation of the radius of influence R for an unconfined aquifer was done according to Weber (1928) (equation 5).

where R = radius of influence (m),
Kf = hydraulic conductivity (m/s),
ho = piezometric head before the pumping started (m),
t = time of pumping (s), and
n = effective porosity (dimensionless ratio representing fractional volume).
Three tube wells were identified in the area where petroleum hydrocarbon product contamination has been observed in the groundwater (Figure 4c). The time (t) taken for the pumps to fill the overhead reservoir (V) and the depth to the water table elevation (ho) were measured before pumping.
RESULTS AND DISCUSSION
The rating values used to create the thematic maps for the DRASTIC and DRASTIC-LuPa models are summarized in the Appendix (Table A-2). The results of the rating maps are discussed subsequently.

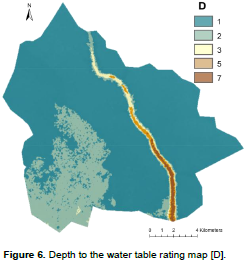
The implication of the depth of the water table parameter to the overall DRASTIC vulnerability assessment shows that the deeper the water table, the lower the chances of the groundwater being contaminated or vice versa. The result of the derived rating map (Figure 6) showed that the rating in the area lies between 1 and 7. The dominant rating depth of the water table lies between classes 1 and 2 in most parts of the study area. Some parts in the southwestern corridor were shallower with a rating of 3, making this part more vulnerable.
The net groundwater recharge rate indicates the ease with which contaminants can be transported vertically from the surface to the groundwater. The result of the net recharge distribution in the rating maps is summarized in Table 3. The DRASTIC approach suggests that the higher the net recharge rate, the more likely is that contamination at the surface reaches the groundwater table faster. The land-use classes influence the ratings in the area. The order according to contamination susceptibility of the aquifer based on the land-use class is as follow: vegetated > arable > built-up > barren land as summarized in Table 3. Considering the impact of some practices in the built-up parts which contribute to groundwater recharge in the area, the rating of the net recharge map was modified [Rm] to account for these practices. The rating map illustrations (Figure 7a and b), revealed that groundwater recharge occured mostly within the vegetated and arable land classes. This makes these parts the most susceptible in the area with ratings of 9 and 8 assigned to them in both [R] and [Rm] maps respectively. In the [R] map, the barren land and built-up were the least vulnerable parts with ratings of 3 and 1, whereas a rating of 6 was assigned to the built-up class in the [Rm] map. This higher rating in the built-up class of Rm is because of the harmful impact of some practices already observed and reported in the groundwater quality.

The aquifer media describes rock types that store groundwater in the saturated zone. The lithology of the boreholes in the area suggests that the aquifer media lie between medium-grained to very fine gravelly materials. Rocks that are porous and unconsolidated have higher capacities to store and transmit groundwater compared to consolidated rock materials, making them more vulnerable to contamination. These sand types make the groundwater moderately prone to contamination because of the medium to high aquifer porosity. Therefore, a uniform rating of 8 was assigned to the aquifer media based on the ranges described in Aller et al. (1987).
The soil media is the topmost part of the vadose. The porosity of the soil media determines the extent of its water holding capacity and the ease, with which contaminants can be transmitted from the surface to the saturated zone. The DRASTIC concept assumes that a more porous soil medium is more susceptible to aquifer contamination than the less porous ones. This implies that soil media with clayey or silty materials have a higher water holding capacity. It takes a long time for a surface contaminant to be transmitted through it than with soils that have sandy textures. Since the soil medium is uniform through the area, a single rating of 6 was assigned to represent the soil medium. This implies that the rate of vertical transmission of rainwater is moderated because of the significant clay-silt proportion in the loam soil found in the area.
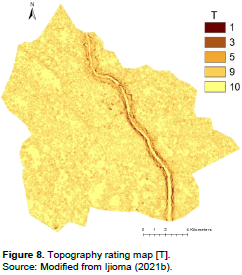
The topography of the area is described by the slope rating map (Figure 8). The DRASTIC concept assumes that flat landforms do not encourage storm runoffs. This means that surface contamination will have more time to percolate through the unsaturated to the saturated zone. When compared with a steep or sloppy landform, rapid run-off reduces the risk of groundwater contamination but heightens the chance of surface water contamination risk. The analysis of the results showed that most parts of the study area are predominantly flat (Ijioma 2021b). These parts have been rated between 9 and 10. The steep sloppy parts occurred along the shoulder of the Aba River with ratings lying between 1 and 3. The predominant flat areas make the groundwater to be more vulnerable.
The vadose characteristics were assumed to be the same throughout the area and a rating of 6 was assigned to the rating map. The DRASTIC approach suggests that an aquifer overlaid by a silty and clayey vadose zone require more time for a surface contaminant to travel through the unsaturated zone to the aquifer. In this case, there is sufficient time for attenuation in the vadose media. The top sandy clay layer in the upper parts of the vadose in the area slows down the transfer of rainwater and facilitates an extended attenuation time for any contaminants in the unsaturated zone. This gives the aquifer moderate protection from certain surface contaminants.
The concept of DRASTIC assumes when the conductivity is high, there is a higher chance of contaminants transmission in the saturated zone. The hydraulic conductivity Kf values ranged from 1×10⁻³ to 9.6 × 10⁻² m/s, with an average of 1.52 × 10⁻³ m/s have been reported in the area. Based on these values a uniform rating of 10 was assigned throughout for the rating map. The implication of the assigned Kf value means a high contamination risk for the aquifer.
The hydraulic conductivity describes the ease with which water moves laterally through the aquifer. The transmission of contaminants depends on the porosity of the aquifer materials, and it is a function of time.
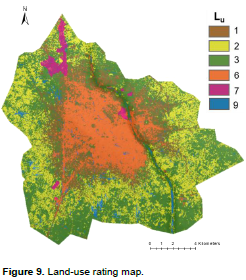
The ratings for the identified land-use classes follow the order: water class (9) > industrial (7) > built-up (6) > vegetated (3) > arable (2) > barren land (1) based on the 2017 map (Figure 9). The surface water and pond areas are the most vulnerable parts due to the lack of physical protection with a rating of 9. The industrial zones were assigned a high rating of 7 because this land use practice is a point source. It has been observed that most industries commonly use cesspits to drain their effluents without prior treatment in the area. The use of septic drains and other similarly identified activities form parts of the contamination hotspots that harm groundwater in the area (Ijioma, 2021b). These practices culminate in the high ratings within the impervious built-up areas. This is because such urban activities harm the quality both chemically and bacteriologically as reported in Ijioma (2021a, b).
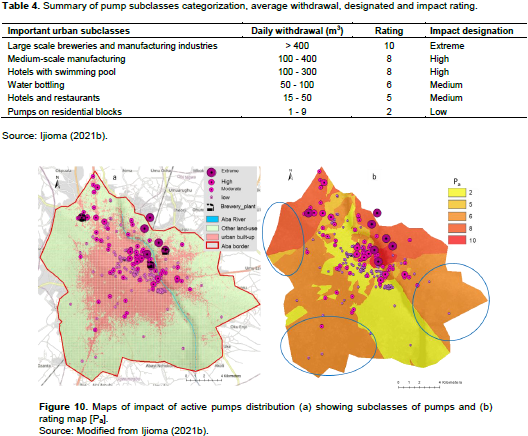
The impact of active pumps depends on the daily withdrawal rates and the land-use activity for which the pump serves. Table 4 summarized some important urban sub-classes, of the pumps, average daily withdrawals and their corresponding impact ratings. The spatial distribution of the 234 pumps and categorization are depicted in Figure 10a. Most of the pumps are used for domestic and small-scale commercial purposes are rated low between 2 and 5. The industrial pumps found in large scale manufacturing facilities such as the breweries companies have the highest impact ratings (between 8 and 10). Some skewed rating values were observed on the kriging map of the active pumps (Figure 10b). Some anomalies were identified within the blue elliptical shapes, where there are scanty or no pumps because the kriging interpolation assigned rating values according to the pumps closest to these parts. These values were overall high and underscores the predictions of the rating map. This is because there are insignificant land-use activities taking place in these parts.
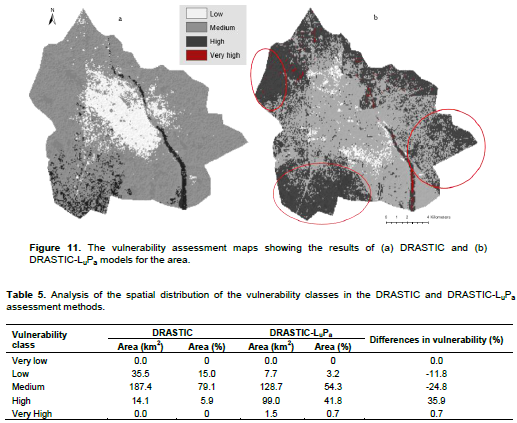
The results of the DRASTIC and DRASTIC-LuPa vulnerability assessments maps are illustrated in Figures 11a and b, respectively and summarized in Table 5. The indices classification of the DRASTIC model revealed only three vulnerability classes (low, medium and high) and four classes (low, medium, high and very high) for the DRASTIC-LuPa. Figure 11a revealed that the area designated with “low” vulnerability make up 15%, 79.1% for “medium”, and 5.9% for “high” vulnerability classes in the DRASTIC model. Relating Figure 11a results with the land use map, the model suggests that the groundwater in most parts of the densely built-up areas is classified as “low” vulnerability. The vegetated and arable lands in the peri-urban parts were classified as “medium” vulnerability. The Aba River and some parts in the southwestern corridor were designated “high” vulnerability. The lack of physical protection over the river makes it highly vulnerable.
In general, the “medium” class represents, the intrinsic baseline vulnerability class in the area. This baseline vulnerability class corroborates with the results of the DRASTIC studies carried out within the regional basin (Ibe et al., 2003; Ijeh, 2013; Edet, 2014; Amadi et al., 2014; Mgbolu et al., 2019). The analysis of the DRASTIC-LuPa model (Figure 11b) showed the following designation, 3.2% - “low”, 54.3% - “medium”, 41.8% - “high” and 0.7% - “very high” classes of the total area. In both models, the “medium” vulnerability class remained the predominant category. It was found that appreciable changes in the vulnerability classes happened when the results of the two models (DRASTIC and DRASTIC-LuPa) were compared. The impact of the anthropogenic (that is, modified net recharge rate, land-use and impact of active pumps) layers were the cause of the spatial transitions in the vulnerability classes. The analysis of the comparison revealed that the low vulnerability class of the DRASTIC, especially in the densely built-up parts was reduced by 11.8% in the DRASTIC-LuPa. The classified “medium” vulnerability parts in the DRASTIC method was reduced by 24.8%, however, the “high” and “very high” vulnerability classes in the DRASTIC-LuPa increased by 35.9 and 0.7%, respectively. These transitions represent the specific vulnerability in the groundwater in these parts. However, part of the transitional effect was drawn from the impact of the active pumps rating map as identified within the ellipses (Figure 11b). There are little or no explainable land-use or physiological differentiation in the identified parts that might be responsible for the shift in the vulnerability. Therefore, it was found that the anomalies in the [Pa] rating map worsen the informative values of the DRASTIC-LuPa model for these parts.
Despite the observed differences in both models, the accuracy was not validated. This is because the average chemical quality of the groundwater remained within the recommended limits in most parts of the area. However, some spatial changes were observed in the quality of the groundwater especially within the densest urbanized parts (Ijioma, 2021a). Yet, most anthropogenic-linked indicators in groundwater are within the recommended limits for drinking water in the area. Again, the high volume of rainwater received in the area has a considerable diluting effect on the groundwater, keeping the quality indicators in check. As the population continue to grow, the harmful impact of land use on the groundwater quality will become conspicuous and dangerous for human consumption.
The result of the DRASTIC method revealed that the depth to water table (D) and net recharge rating (R) were the most sensitive parameters that influenced the differentiation in the outcome of the classical vulnerability assessment map. The net recharge rating caused the most significant changes due to the anthropogenic impact of the urban land use causing low infiltration in parts of the dense built-up parts. The urban land use introduced surface sealing in the densely built-up parts and barren land surrounding the built-up parts. The areas designated with “low” groundwater vulnerability class were surrounded by the predominant “medium” vulnerability class (Figure 11a). Ibe et al. (2003) in their assessment of part of the regional basin in Owerri reported that the groundwater vulnerability was mostly influenced by intrinsic factors such as porosity, the depth to the water table, and topography. In addition, the parts designated “high” vulnerability observed in the southwestern area were caused by changes in the depth to the water table and this agrees with the findings of Ibe et al. (2003). Again, the low reference elevation in some parts of the southwestern area makes the groundwater table elevation higher and more vulnerable than the other parts of the study area. However, the mix in the composition and lithographical arrangement of the geological materials throughout the study area explained the moderate protection in the aquifer and the “medium” baseline vulnerability designation on the groundwater.
The validation of the accuracy for the impact of pumping was based on the premise that a large volume of groundwater abstracted exacerbates the quality of the groundwater if there is a nearby contamination source. The presence of total petroleum hydrocarbon (TPH) in the tube wells were determined to demonstrate the influence of daily withdrawals on the quality of groundwater. Table 6 summarized the results of the pumping, the radius of influence estimations and the impact on the groundwater quality. The findings revealed that pumps with high withdrawal generate a wider radius of influence. The radii of influences of the pumps were arrayed in descending order of magnitude: BHT5 (RT5 = 358 m), > BH T3 (RT3 = 253 m) > BHAB (RTAB = 143 m). The estimated radii are directly proportional to the volume of the overhead storage volume for each pump and the time required to fill the tanks. The closer a pump’s zone of influence to the contamination plum, the easier it is for the groundwater to be contaminated. The results revealed that BH T5 with the largest storage volume and radius of influence has interacted with the petroleum product plume. A concentration of TPH = 0.74 mg/l was found in the sample of BHT5. This concentration of TPH impacts taste and odour on the groundwater because the value is above the WHO limits for drinking water quality. This was followed by BHT3, with TPH concentration = 0.54 mg/l in the groundwater sample. Although RT3 did not directly interact with the hydrocarbon plume, however, there was an intersection between RT3 and RT5. This interaction might be responsible for the contamination found in the BHT3 sample. However, no TPH concentration was detected in the BHAB, because the storage tank capacity was not large enough to cause a change in the natural flow of the groundwater. This demonstration can validate the impact of active pumps on the DRASTIC-LuPa model in this part of the study area, where contamination has already been observed. The transitioning of groundwater vulnerability from “medium” to “high” and “high” to “very high” classes were also seen in these parts. However, these vulnerability classes were not captured in the DRASTIC model.

CONCLUSION
The vulnerability characterization carried out for the main drinking water source in Aba Nigeria, suggests that the intrinsic properties of the aquifer provide moderate protection to the groundwater. Based on the DRASTIC model, the densely residential and commercial parts predicted as having “low” vulnerability were assumed because of the artificial surface sealing in these parts. This sealing offered extra protection to the aquifer and slow down the leaching of potential surface contaminants. However, the “low” vulnerability prediction within the densest residential parts cannot explain the observed gradual deterioration in the groundwater quality. Therefore, the assessment of groundwater vulnerability within developing urban areas where urban land-use and other poor environmental practices, which can harm the groundwater should be re-evaluated. The DRASTIC-LuPa model was proposed to adapt the impact of anthropogenic parameters such as some urban land activities and active pumps around contaminated areas into the DRASTIC approach. The identified anthropogenic layers account for the observed transitions in the vulnerability classes, between both models. This modification in the DRASTIC approach enhanced the predictability of the model especially within the densely residential and commercial parts making the DRASTIC-LuPa model easily transferrable to many developing urban areas with similar urbanization patterns as found in Aba City. One of the practical implications of the DRASTIC-LuPa, model is that it identified areas that can be protected and used for safe drinking water abstraction in the study area. Based on this fact, parts of the area classified as “low” to “medium” vulnerability that is not affected by the densely urban built-up parts can be delineated and protected for source water extraction. As part of the study limitations coarse resolutions in some, rating maps created some anomalies in form of discontinuity or missing pixels observed in models’ outcomes. For instance, the DEM and Landsat imagery (approximately 30 m) influenced the output of the depth to the water table, land-use and net-recharge rating maps. A finer resolution of these data can be used when implementing the model for a small area coverage as Aba. Again, the impact of low data density in parts of the impact of active pumps rating map worsen the informative values and reliability of the results in parts of the modified model.
CONFLICT OF INTERESTS
The authors have not declared any conflict of interests.
ACKNOWLEDGEMENTS
The authors appreciate Nkene L. Enukeme, and Chidozie Okoroama, for making their facilities available during the hydrological field investigation in Aba. They thank the management and Department of Chemistry, Abia State Polytechnic Aba for granting research stay during the field campaign period in Aba Nigeria. The financial support from the Chair of Raw Materials and Resource Management, Brandenburg University of Technology Cottbus-Senftenberg Germany is appreciated.
REFERENCES
|
Adams R (2013). Water-table elevation and depth to the water table. Minnesota: Minnesota Department of Natural Resources. |
|
|
Adamu N, Ezeribe IE, Oyedeji OA (2019). Engineering properties of the soils around Aba, Southeast Nigeria. Retrieved on November 11, 2019, from Academia. |
|
|
Adiat KAN, Akeredolu BE, Akinlalu AA, Olayanju GM (2020). Application of logistic regression analysis in prediction of groundwater vulnerability in a gold mining environment: a case of Ilesa gold mining area, southwestern, Nigeria. Environmental Monitoring Assessment doi: 10.1007/s10661-020-08532-7 |
|
|
Agharanya UP, Dim CI (2018). Water quality assessment and resource potentials: the case of Aba urban and its environs, Niger Delta basin. Water Resource Journal 45(2):250-267. |
|
|
Aller L, Bennett T, Lehr JH, Petty R, Hackett G (1987). DRASTIC: A standardized system for evaluating ground water pollution potential using hydrogeologic settings. US Environmental Protection Agency. Washington, DC, 455. |
|
|
Amadi AN, Olasehinde PI, Nwankwoala HO, Dan-Hassan MA, Okoye NO (2014). Aquifer vulnerability studies using DRASTICA model. International Journal of Engineering Science Invention 3(3):1-10. |
|
|
Arthur J, Wood H, Baker A, Cichon J, Raines GL. (2007). Development and implementation of a Bayesian-based aquifer vulnerability assessment in Florida. Natural Resources Research 16(2):93-107. |
|
|
Bazimenyera J, Zhonghua T (2008). A GIS-based DRASTIC model for assessing groundwater vulnerability in shallow aquifer in Hangzhou-Jiaxing-Huzhou Plain, China. Resource Journal of Applied Sciences pp. 550-559. |
|
|
Civita M, Forti P, Marrini P, Meccheri M, Micheli L, Piccini L, Pranzini G (1991). Aquifer vulnerability to contamination map of the Apuan Alps. Mem. explic., Monography G.N.D.C.I.- C.N.R. no. 399. |
|
|
Doerfliger N, Jeannin PY, Zwahlen F (1999). Water vulnerability assessment in Karstic environment: a new method of defining protection areas using a multi-attribute approach and GIS tools (EPIK method). Environmental Geology 39(2):165-176. |
|
|
Dörfliger N, Zwahlen F (1998). Practical guide: Groundwater vulnerability mapping in Karstic Regions (EPIK); Bern: Swiss Agency for the Environment, Forests and Landscape (SAEFL). |
|
|
Doungmanee P (2016). The nexus of agricultural water use and economic development level. Kasetsart Journal of Social Sciences pp. 38-45. |
|
|
Edet A (2014). An aquifer vulnerability assessment of the Benin Formation aquifer, Calabar, southeastern Nigeria, using DRASTIC and GIS approach. Environmental Earth Sciences 71(4):1747-1765. |
|
|
Egboka BC, Nwankwor GI, Orajaka IP, Ejiofor AO (1989). Principles and problems of environmental pollution of groundwater resources with case examples from developing countries. Environmental health perspectives 83:39-68. |
|
|
ESDAC (European Soil Data Centre) (1990). Soils map of Nigeria. Retrieved from European Commission Joint Research Centre. |
|
|
Food and Agriculture Organization (FAO) (2020). Water at a glance: the relationship between water, agriculture, food security and poverty. Retrieved December 10, 2020, from FAO WATER. |
|
|
Fileccia A (2015). Some simple procedures for the calculation of the influence radius and wellhead protection areas (theoretical approach and a field case for a water table aquifer in an alluvial plain). Acque Sotterranee - Italian Journal of Groundwater. |
|
|
Foster S (1987). Fundamental concept in aquifer vulnerability, pollution risk and protection strategy in Duijvenbooden V, Waegeningh HG. Vulnerability of soil and groundwater to pollutions. Hague: Committee on Hydrogeological Research pp. 69-86. |
|
|
Frind E, Molson J, Rudolph D (2006). Well Vulnerability: A Quantitative Approach for Source Water Protection. Groundwater 44(5):732-742. |
|
|
Hayward D, Oguntoyinbo JS (1987). Climatology of West Africa. New Jersey: Barnes and Noble's Books. |
|
|
Ibe KM, Nwankwo GI, Onyekuru SO (2003). Groundwater pollution vulnerability and groundwater protection strategy for the Owerri area, Southeastern Nigeria. Water Resources Systems-Water Availability and Global Change. Sapporo: IAHS. |
|
|
Ijeh IB (2013). Determination of the vulnerability of water supply aquifers in parts of Imo River Basin, South-eastern Nigeria: The case of Benin formation. International Journal of Modern Engineering Research 3(1):291-295. |
|
|
Ijioma UD (2021a). Delineating the impact of urbanization on the hydrochemistry and quality of groundwater wells in Aba, Nigeria. Journal of Contaminant Hydrology. Doi: /10.1016/j.jconhyd.2021.103792 |
|
|
Ijioma UD (2021b). Evaluation of water situation and development of drinking water management plan for Aba City, Southeast Nigeria. (PhD-thesis) Brandenburg University of Technology Cottbus-Senftenberg Germany. Doi: /10.26127/BTUOpen-5589 |
|
|
Jang WS, Engel B, Harbor J, Theller L (2017). Aquifer vulnerability assessment for sustainable groundwater management using DRASTIC. Water doi:10.3390/w9100792 |
|
|
Jasem AH (2010). Assessing groundwater vulnerability in the Azraq basin area by a modified DRASTIC index. Journal of Water Resources and Protection. |
|
|
Jhariya DC, Kumar T, Pandey HK, Kumar S, Kumar D, Gautam AK, Kishore N (2019). Assessment of groundwater vulnerability to pollution by modified DRASTIC model and analytic hierarchy process. Environmental Earth Sciences 67(6):1801-1820. |
|
|
Jinno K, Tsutsumi A, Alkaeed O, Saita S, Berndtsson R (2009). Effects of land-use change on groundwater recharge model parameters. Hydrological Sciences Journal 54(2):300-315. |
|
|
Kemper KE (2004). Groundwater-from development to management. Hydrogeology Journal 12(1):3-5. |
|
|
Kumar A, Krishna AP (2019). Groundwater vulnerability and contamination risk assessment using GIS-based modified DRASTIC-LU model in hard rock aquifer system in India. Geocarto International 35(11):1149-1178. |
|
|
Macheve B, Danilenko A, Abdullah R, Bove A, Moffitt LJ (2015). State water agencies in Nigeria: a performance assessment. Washington, DC: World Bank doi: 10.1596/978-1-4648-0657-5 |
|
|
Mair A, El-Kadi AI (2013). Logistic regression modeling to assess groundwater vulnerability to contamination in Hawaii, USA. Journal of Contaminant Hydrology 153:1-23. |
|
|
Massetti M, Poli S, Sterlacchini S, Beretta GP, Facchi A (2008). Spatial and statistical assessment of factors influencing nitrate contamination in groundwater. Journal of environmental management 86(1):272-281. |
|
|
Mgbolu CC, Obiadi II, Obiadi CM, Okolo CM, Rumhe PE (2019). Integrated groundwater potentials studies, aquifer hydraulic characterisation and vulnerability investigations of parts of Ndokwa, Niger Delta basin, Nigeria. Solid Earth Sciences 4(3):102-112. |
|
|
Moore P, John SX (1990). SEEPAGE: A System for Early Evaluation of the Pollution Potential of Agricultural Groundwater Environments. Chester, USA: Geol Tech; USDA, SCS, Northeast Technical Center. |
|
|
Moustafa M (2019). Assessing perch aquifer vulnerability using modified DRASTIC: a case study of colliery waste in North-east England (UK). Hydrogeology Journal 27(5):1837-1850. |
|
|
Nwankwoala H (2015). Hydrogeology and groundwater resources of Nigeria. International Journal of Geology and Earth Sciences 4(4):56-76. |
|
|
Ophori DU (2007). A simulation of large-scale groundwater flows in the Niger Delta, Nigeria. Environmental Geosciences 14(4):181-195. |
|
|
Saatsaz M, Sulaiman WN, Eslamian S, Mohammadi K (2011). GIS DRASTIC model for groundwater vulnerability estimation for groundwater of Astaneh-Kouchesfahan Plain, Northern Iran. International Journal of Water 6(1-2):1-14. |
|
|
Secunda S, Collin ML, Mellou AJ (1998). Groundwater vulnerability assessment using a composite model combining DRASTIC with extensive agricultural land use in Israel's Sharon region. Journal of Environmental Management 54(1):39-57. |
|
|
Singh A, Srivastav SK, Kumar S, Chakrapani GJ (2015.). A modified-DRASTIC model (DRASTICA) for assessment of groundwater vulnerability to pollution in an urbanized environment in Lucknow, India. Environmental Earth Sciences 74(7):5475-5490. |
|
|
Sorichetta A (2010). Groundwater vulnerability assessment using statistical methods. Milan: University of Milan. |
|
|
UNESCO (2004). Groundwater Resóurces of the World and their Uses in Zektser IS, Everett LG (Eds). |
|
|
van Stempvoort D, Evert L, Wassenaar L (1993). Aquifer vulnerability index: a GIS compactable method for groundwater vulnerability mapping. Canadian Water Resources Journal 18(1):25-37. |
|
|
Vias JM, Andrco B, Perles M, Carrasco F, Vadillo I, Jimenez P (2006). Proposed method of groundwater vulnerability mapping in carbonate (karstic) aquifers: the COP method. Applications in two pilot sites in southern Spain. Hydrogeology Journal pp. 912-925. |
|
|
Vrba J, Zoporozec A (1994). Guide book on Mapping Groundwater Vulnerability. Hannover: IAH. |
|
|
Wakode HB (2016). Analysis of Urban Growth and Assessment of Impact of Urbanization on Water Resources- A Case Study of Hyderabad, India. Georesources and Materials Engineering. Aachen: RWTH Aachen University Library. |
|
|
Weber H (1928). Die Reichweite von Grundwasserabsenkungen mittels Rohrbrunnen. Berlin: Julius Springer. |
|
Copyright © 2024 Author(s) retain the copyright of this article.
This article is published under the terms of the Creative Commons Attribution License 4.0


