African Journal of
Environmental Science and Technology

  • Abbreviation: Afr. J. Environ. Sci. Technol.
  • Language: English
  • ISSN: 1996-0786
  • DOI: 10.5897/AJEST
  • Start Year: 2007
  • Published Articles: 1126

Full Length Research Paper

Physicochemical influence on the spatial distribution of faecal bacteria and polychaetes in the Densu Estuary, Ghana

Akita L. G.
  • Akita L. G.
  • Department of Marine and Fisheries, University of Ghana, P. O. Box LG 99, Legon-Accra, Ghana.
  • Google Scholar
Laudien J.
  • Laudien J.
  • Alfred Wegner Institute Helmholtz Centre of Polar and Marine Research, Am Alten Hafen 26, 27568 Bremerhaven, Germany.
  • Google Scholar
Akrong M.
  • Akrong M.
  • CSIR-Water Research Institute, P. O. Box M 32, GP-018-964, Accra, Ghana.
  • Google Scholar
Biney C.
  • Biney C.
  • Ecosystem Environmental Solutions Limited, GD-213-5404, Accra, Ghana.
  • Google Scholar
Nyarko E.
  • Nyarko E.
  • Department of Marine and Fisheries, University of Ghana, P. O. Box LG 99, Legon-Accra, Ghana.
  • Google Scholar
Addo S.
  • Addo S.
  • Department of Marine and Fisheries, University of Ghana, P. O. Box LG 99, Legon-Accra, Ghana.
  • Google Scholar


  •  Received: 28 February 2020
  •  Accepted: 02 April 2020
  •  Published: 30 June 2020

 ABSTRACT

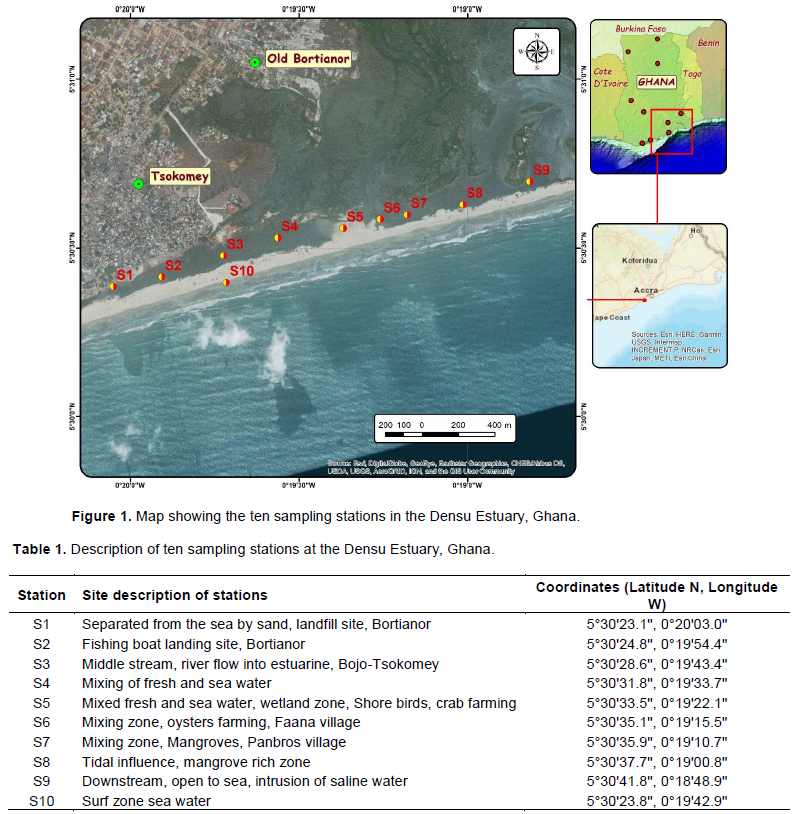
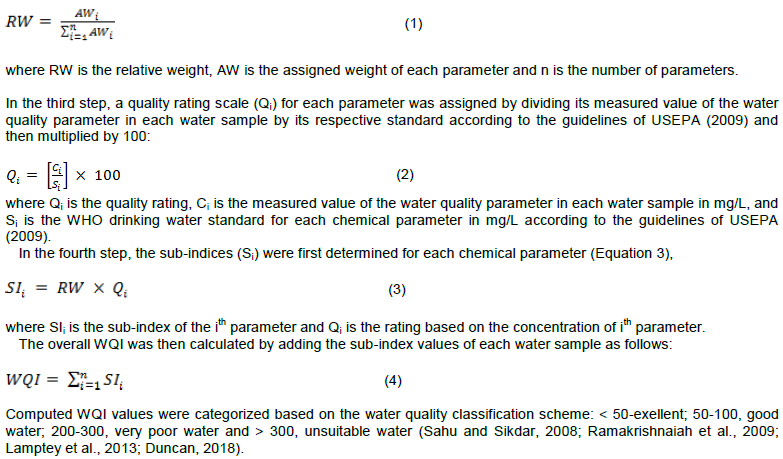
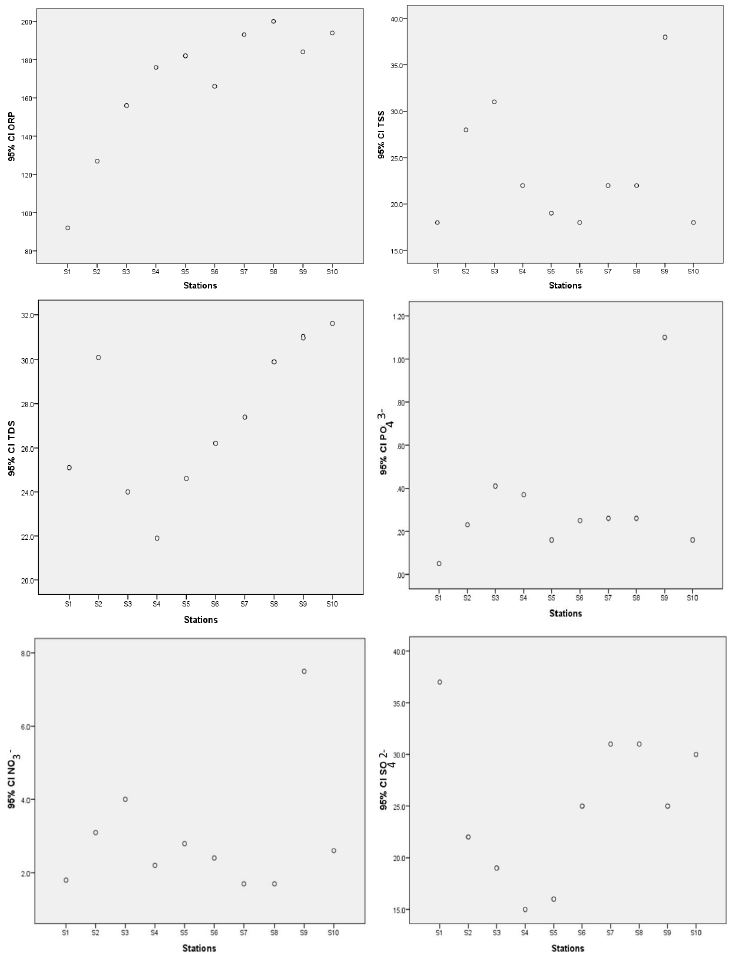
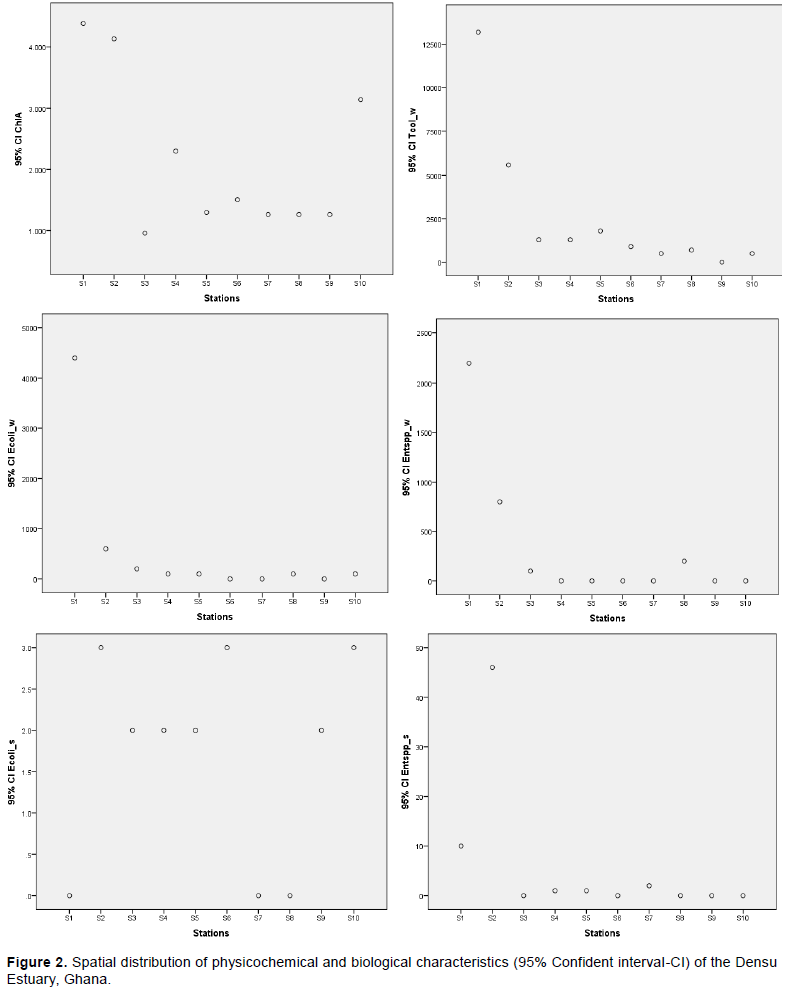
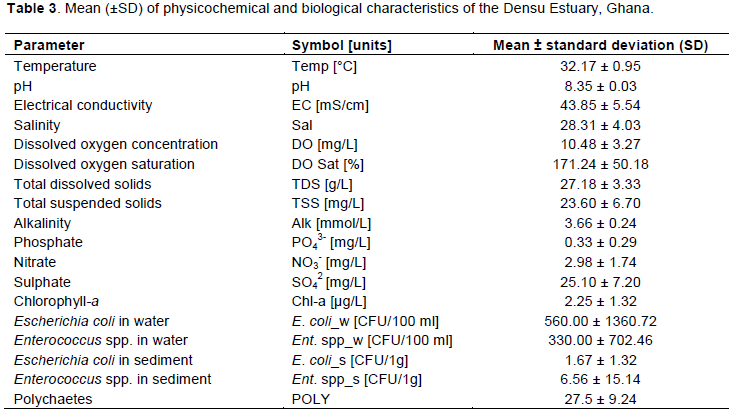
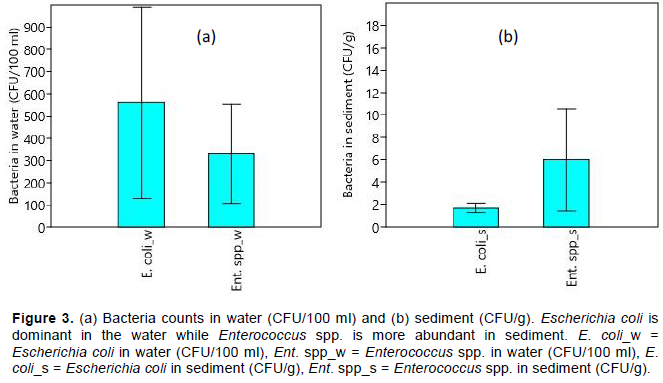
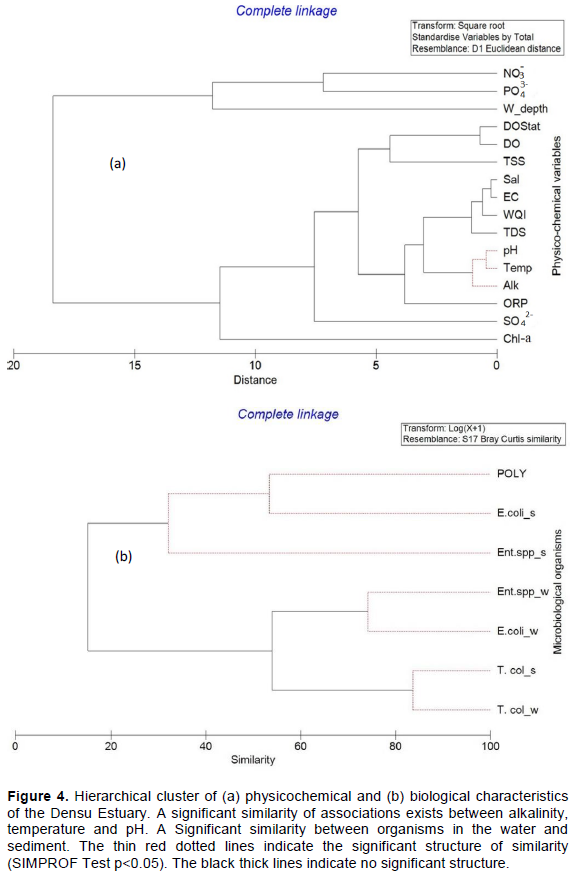
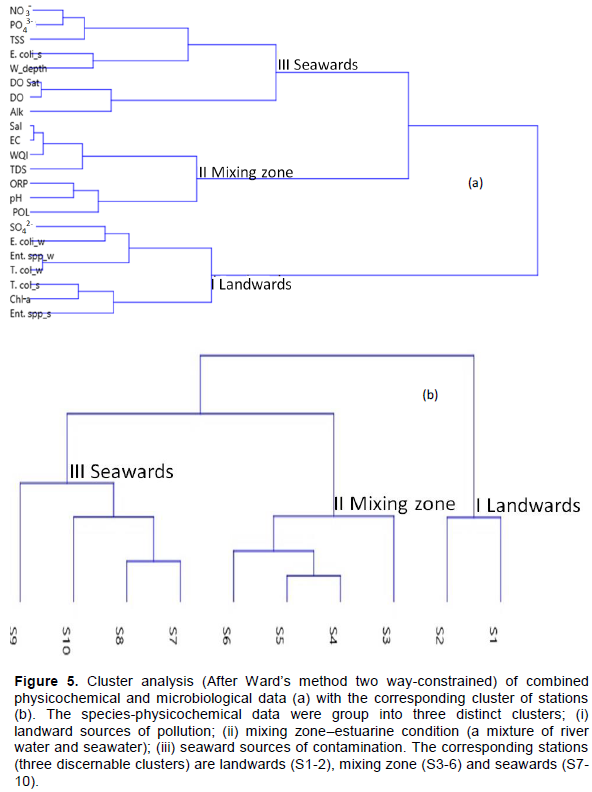
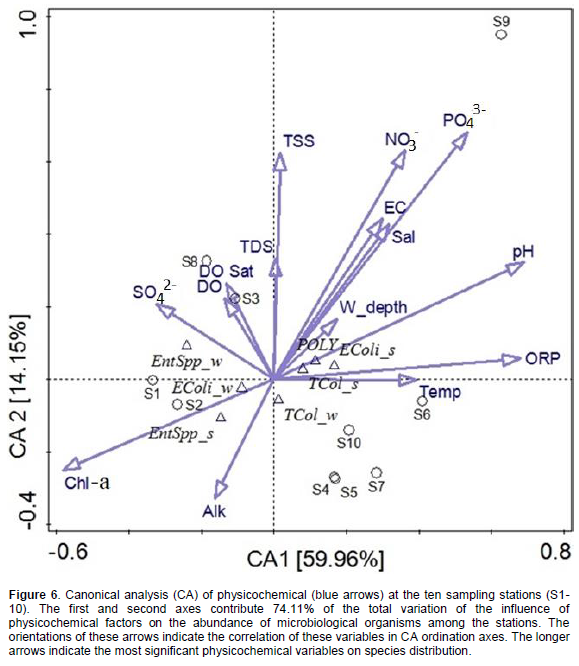
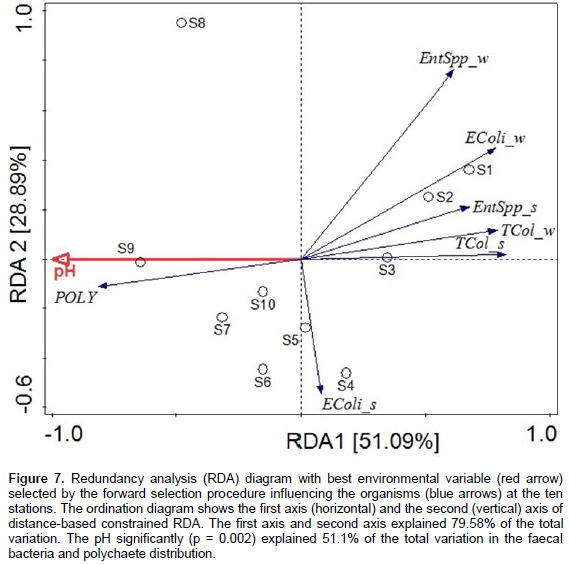
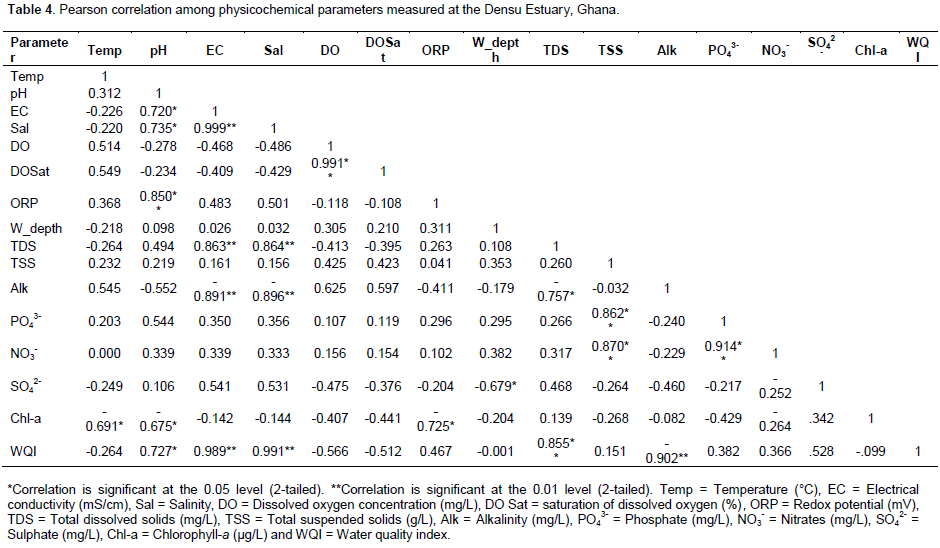
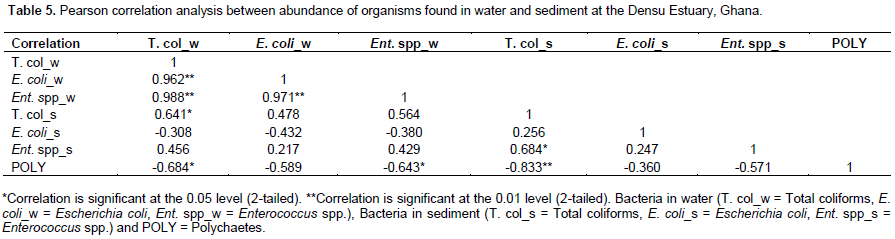
Coastal ecosystems are increasingly impacted by man-made disturbances including pollution from agriculture, aquaculture and municipal waste. This study employed multiple ecological indicators to assess environmental quality of the Densu Estuary and understanding of environmental controls on the spatial distribution of organisms. Physicochemical parameters were measured in situ. Water and sediment samples were collected from ten stations and analysed for nutrients, total suspended solids and organisms using standard methods. The water quality index for the Densu Estuary ranged from 359.5 to 484.4, suggesting an unhealthy ecosystem. The abundance of indicator species, e.g. faecal bacteria (Escherichia coli, Enterococcus species) and polychaetes (Capitella and Nereis species) varied significantly (p<0.05) among stations. Contaminated sites are located landwards with high human impacts. Faecal bacteria and polychaete abundance correlated significantly (p<0.05) with the respective physicochemical parameters. Canonical analysis (74.11%) showed the physicochemical influence on the spatial distribution of species. The pH significantly (p<0.05) controlled the spatial distribution of faecal bacteria and polychaetes in the Densu Estuary. The results suggest environmental pollution in the Densu Estuary, useful baseline information for effective legislation towards its sustainable management.


Key words: Biological indicators, water quality index, pollution, estuarine ecology, Densu Estuary.


 INTRODUCTION

Estuaries contain mixed fresh and marine water which include productive wetlands and most productive biogenic zones of nearshore waters (Twilley et al., 1992; Armah,  1993;  McLusky  and  Elliot,  2010;  Mahu  et  al., 2016). They are habitats for benthic invertebrates, feeding ground for nektonic, migratory birds and nursing grounds of fishes (Lamptey and Armah, 2008; Aggrey-Fynn  et  al., 2011;  Greene et al., 2015). Growing human
 
populations, urbanization and industrial activities increasingly affect coastal ecosystems (Monney et al., 2013; Nyarko et al., 2015; Yeleliere et al., 2018). The management of solid and liquid waste is a major problem in Ghana, especially in urban areas and cities due to inadequate waste treatment facilities and management (Aglanu and Appiah, 2017). The waste is mostly transported by rivers and streams into estuaries and eventually into the sea (Mahu et al., 2015; Klubi et al., 2018). Access to clean and safe drinking water in cities is inadequate in supply and many people die of water-borne diseases (Shuval, 2003; Cabral, 2010; Odonkor and Ampofo, 2013).
 
The coastal environments are mostly impacted through pollution, land use and hydrological changes (Shuval, 2005; Stewart et al., 2008; Lamptey et al., 2013; Klubi et al., 2019). Estuaries are complex dynamic environments that are susceptible to anthropogenic alterations (Bucci et al., 2012; Greene et al., 2015; Klubi et al., 2018). Intensive industrialization and population growth exists around urban coastal areas of Ghana. The human activities (e.g., agrochemical inland runoff, mining, industrial and domestic waste discharges) can alter the environmental characteristics of the coastal water bodies including estuaries, lagoons, rivers among others (Lamptey and Armah, 2008; Okyere et al., 2011; Nyarko et al., 2015; Yeleliere et al., 2018).
 
The Densu Estuary is located in the dry equatorial climate region of Ghana with the climate governed by the monsoon, the harmattan and the equatorial air masses (Armah and Amalalo, 1998; Teley, 2001; Karikari and Ansa-Asare, 2006). The primary aim of this study was to assess the human impacts on the environmental quality of the Densu Estuary through multiple ecological indicators. The specific objective was to gain knowledge on how physicochemical factors influence the spatial distribution of organisms in the Densu Estuary. We hypothesize that (i) physicochemical parameters vary in the estuarine system and (ii) physicochemical parameters are drivers for the spatial distribution of organisms within the system. The preliminary results established hydrochemical dynamic coupled with the ecological conditions of the Densu Estuary. The spatial pattern of organism reflects not only physicochemical characteristics of the water body, but also the state of sediment quality and further insight into estuarine ecology.


 MATERIALS AND METHODS
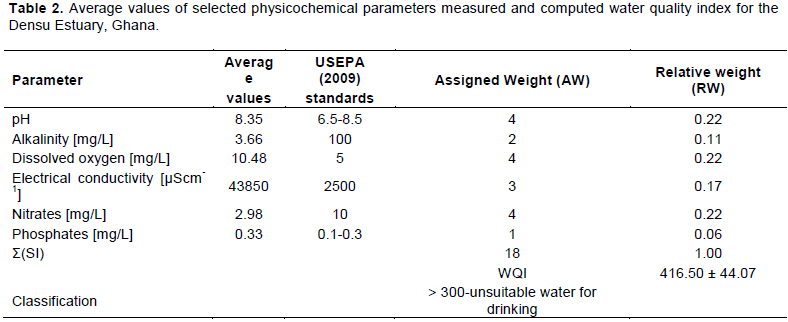
Study site
 
The Densu Estuary is located between 5°30'N and 5°31'N and 0°17'W and 0°18'W (Figure 1). The river basin has a catchment area of 2,565 km2 and is 116 km long (Debrah, 1999). The Densu River has its source in the Atewa-Atwiredu mountain range near Kibi in the East Akyem District of the Eastern Region of Ghana (Hagan et al., 2011). The Densu River Basin is one of the most important river basins of Ghana. It  encompasses  the  northwestern suburbs of Accra, the capital of Ghana and is densely populated. The basin is endowed with rivers and streams, mostly ephemeral, but few perennial known to be polluted (WRI, 2003; Fianko et al., 2009). The major tributaries include Adeiso (Adaiso), Nsakyi (Nsaki), Dobro, Mame and Kuia. The Densu River enters the Weija Reservoir and discharges into the Densu Estuary, which drains into the Gulf of Guinea, Ghana.
 
The Densu Estuary is surrounded by a wetland (also known as “Densu Delta”, “Densu Wetland”, “Densu Ramsar”), recognized as the Ramsar site due to its ecological biodiversity. It is surrounded by mangroves (e.g., Avicennia africana), which serve as nursery grounds for migratory fish species (Koranteng, 1995), habitat for birds (especially long-distance migratory birds along the East Atlantic Flyway); it supports approximately 57 species of seashore birds (population ~35,000 specimens). The estuarine waters support about 15 species of finfish (14 genera and 9 families, most common of which are Sarotherodon melanotheron and Tilapia zilli). The beachfront is also a nursing ground for marine turtles (e.g., Lepidohelys olivacea, Chelonia mydas and Dermochelys coriacea). The estuary is also used for crab fisheries and oyster farming. Furthermore, the wetland serves as floodplain. The availability and quality of water in the estuary and wetland play an important role in defining not only where people can live, but also their quality of life (Solley et al., 1998).
 
Field sampling
 
At ten stations (S1 to S10) water and sediment samples were taken to assess the ecological integrity of the Densu Estuary (Figure 1 and Table 1). Sampling line transects started landwards and ended seawards (Figure 1). Sampling was carried out on the 19th of May 2017 during mid-tide (11:15 to 13:30). Samples were taken from water depths ranging from 0.10 to 0.70 m. Coordinates for each station are recorded using the Global Position System (GPS), Garmin etreX Model (www.garmin.com).
 
Physicochemical parameters such as temperature, salinity, specific electrical conductivity, redox potential, dissolved oxygen concentration and saturation were measured in situ using a Horiba Digital Water Quality Multi-parameter instrument (Horiba Probe, Model U-52G 30M, Horiba Company Limited, Japan). Sample bottles were washed three times with estuary water before filling. Water samples (N = 10) were collected from 10 cm depth in 500 ml bottles for phosphate and nitrates and suspended particles analyses. Additionally, water samples (N = 10) were collected in 500 ml plastic bottles covered with black polythene bags for chlorophyll-a concentration estimates. Furthermore, water samples (N = 10) were collected in 200 ml sterilized water bottles for microbiological analyses.
 
Surface sediments were collected at the sampling stations from 20 to 30 cm depths using an Ekman Grab (area: 0.04 m2) (Mudroch and Azcue, 1995). The sediment was put into interim storage in a bowl and immediately scooped into labelled polythene bags (bacteria and benthos, N=10 each) for further analyses.
 
The samples for nutrients and bacterial analyses were kept on ice cubes stored in ice-coolers to reduce biological activity. The sediment sample for macrobenthic analysis was preserved in 10% buffered formaldehyde and stained with Rose Bengal. All samples were then transported to the laboratory and kept in a refrigerator at 4°C for 30 min before analysis. The microbiological analyses were carried out within 24 h at the Environmental Biology Laboratory, Council for Scientific and Industrial Research (CSIR)-Water Research Institute (WRI), Accra, Ghana.
 
 
The chemical parameters were determined according to procedures  outlined in the Standard Methods for the Examination of Water and Wastewater (APHA, 1998, 2012). Nitrate (NO3-), phosphate (PO43-) and sulfates (SO42-) were measured using a HACH 2010 Spectrophotometer (Model DR/2010) with a precision of ± 0.10 v mg/L (HACH Company, Loveland, Colorado, USA) (www.hach.com; HACH, 2012). Total dissolved solids (TDS) are determined by filtering, weighing the sampled water and measuring it gravimetrically after drying it  in  an  oven  to  a  constant  weight  at 105°C (APHA 2012). To measure total suspended solids (TSS), 100 ml of the water sample was filtered through a pre-weighed filter that was dried in an oven at the temperature of 104°C to constant weight and repeated for 3 steps, then the total suspended solids is calculated (thus the TSS, mg/L is equal to average weight from step 3 in g minus average initial weight from step 1 in g multiple by 1000 mg/L divided by sample volume in L) (APHA, 2012).
 
 
Chlorophyll-a concentration   was   extracted   from   the   water  samples using 96% ethanol and measured with a UV/Vis spectrophotometer at 665 and 649 nm (APHA, 2012). Chlorophyll-a concentration was estimated as a proxy for phytoplankton concentration and thus as an indicator of the trophic state (Monbet, 1992; Hinga et al., 1995; Boyer et al., 2009). The trophic status of the ecosystem was determined based on the estimated chlorophyll-a concentrations and classified using the following scheme: <1.0 µg/L = ultra-oligotrophic; 1.0 - 3.0 µg/L = oligotrophic; > 3.0 - 8.0 µg/L = mesotrophic; > 8.0 - 30.0 µg/L = eutrophic; > 30.0 µg/L = hypertrophic (da Silveira Fiori et al., 2013).
 
Water quality index
 
The Water Quality Index (WQI) is defined as a rating, reflecting the composite influence of different water quality parameters on the overall quality of water (Mophin-Kani and Murugesan, 2011; Tirkey et al., 2015; Fathi et al., 2016). It was first proposed in 1965 (Horton, 1965). The WQI was computed using recommended water quality standards (Sanchez et al., 2007; USEPA, 2009; Nyarko et al., 2015) and four steps followed. In the first step, each of the six environmental parameters (Table 2) has been assigned a weight (AW) according to its relative importance in the overall quality of water for drinking purposes. The maximum weight of 4 has been assigned to parameters such as pH, dissolved oxygen concentration and nitrate due to their major importance in water quality assessment (Ramakrishnaiah et al., 2009; Mophin-Kani and Murugesan, 2011; Nguyen and Sevando, 2019). Phosphate is given the weight of just 1 as it plays a minor role in the water quality assessment. Other parameters were electrical conductivity (assigned 3) and alkalinity (assigned 2) (Table 2). For the second step, the relative weight (RW) was computed using a weighted arithmetic index (Equation 1):


Biological analyses
 
Bacteriological examination of water and sediment samples was conducted using standard methods (Horan, 2003; Cabral, 2010; Odonkor and Ampofo, 2013). Total coliforms and faecal bacteria were determined by the membrane filtration method using M-Endo-Agar Les (Difco) at 37°C and on MFC Agar at 45°C, respectively (Cabral, 2010). In total 20 ml of each water sample were separately filtered through 0.45 µm pore size membrane filter paper, mounted on a filtration pump, whereas 5 g of each sediment sample was given into a sterile 50 ml tube. Thereafter, 45 ml of PBS was added the sample vortexed for 30 s to homogenize it. The pH was slowly adjusted to 9.0 by adding drops of 0.1 N NaOH. The prepared sample was vigorously mixed with the help of a shaker for 30 min at room temperature. The sample was left to stand for 15 min and 1 ml of the supernatant diluted with 10 ml sterile distilled water before membrane filtration.
 
Determination of total coliforms and Escherichia coli were undertaken by aseptically placing filters on poured and solidified Cromocult Agar Media in Petri dishes and incubated at 37 ± 0.5°C for  18  to  24  h.  Similarly,  for  the  enumeration  of   Enterococcus species, the filters were aseptically plated on Slanetz and Bartley medium and incubated at 45°C. Typical presumptive colonies were identified as total coliform (purple-blue colonies), E. coli (only blue colonies) and Enterococcus spp. (pinkish to red colonies); these were counted with the aid of a colony counter and expressed in CFU/100 ml and CFU/g for water and sediment samples, respectively.
 
For macrofauna analysis, the fixed sediment samples were washed with tape water through a 0.2 mm mesh sieve to remove the fixative. Thereafter, the samples were sorted and animal groups identified and quantified under a dissecting microscope. Their abundance was determined by counting their head, the identification followed taxonomical keys (Day, 1967a, b).
 
Statistical analysis
 
Physicochemical parameters and biological data that were normally distributed were subjected to a One-way analysis of variance (ANOVA) to test for spatial variation. A significance level of 5% was adopted. The physicochemical parameters were standardized, while the biological data were log (X+1) transformed.
 
Principal component analysis (PCA) was used to identify the relationship between the species composition and the effects of the physicochemical parameters (Šmilauer and Lepš, 2014). This allows separation of effects of space and environmental variables on the oribatid community structure (Šmilauer and Lepš, 2014). The PCA and Redundancy analysis (RDA) are both linear quantitative ordination methods, which are closely related to linear regression. However, PCA is an indirect gradient analysis, while RDA is a direct gradient analysis (Šmilauer and Lepš, 2014). The ordination scores can be used to model the distribution of taxa along physicochemical gradients and to estimate values of preferred environments, environmental tolerance and peak abundance (Patzkowsky and Holland, 2012). The PAST software was used to two-way constrained cluster analysis (Hammer et al., 2001). The Canoco software was employed for the multivariate statistical analyses (e.g., PCA, CA and RDA) (Šmilauer and Lepš, 2014). Descriptive statistics were calculated using PAST and Excel spreadsheets. Furthermore, the PRIMER 6 package was used to run cluster analyses (Clarke and Gorley, 2006) to identify groups of similar associations (e.g., taxa and environmental variables) and to display the relationships among them (Patzkowsky and Holland, 2012).
 
Pearson’s correlation coefficient (r) was used to test the strength of linear associations between the biological data and physicochemical parameters (Khamis, 2008), using a statistical package for social sciences (SPSS 21.0). The correlation coefficient (r) was determined to estimate the degree of the relationships (Khamis, 2008; Yadav, 2018). The dimensionless quantity value of the coefficient of correlation (r) can range from -1 (perfect negative correlation) through 0 (no correlation) to +1 (perfect positive correlation) (Möller and Scharf, 1986; Nagelkerke, 1991; Yadav, 2018). Significance levels of 0.05 and 0.01% were adopted.


 RESULTS

Physicochemical parameters
 
The spatial distribution of physicochemical and microbiological characteristics of the Densu Estuary is expressed in Figure 2, providing the 95% confidence interval. The mean values are summarized in Table 3. There was a significant variation for some physicochemical   parameters  (mainly  dissolved  oxygen concentration and saturation, total dissolved solids, alkalinity, nitrate, phosphate and chlorophyll-a concentration) and microbiological organisms (total coliforms, E. coli and Enterococcus spp., in water and sediment) among the sampling stations (One-way ANOVA F12, 117 = 3.50; p < 0.05).
 
Surface water temperature ranged from 30.7 to 34.1°C. The lowest temperature was recorded at S1 and the highest at S7. S1 is located landwards, without any freshwater influence, separated from the sea by a sand bar and is characterized by shallow water depth, while S7 is characterized by an estuarine environment, more subject to marine water intrusions. The pH ranged from 8.31 to 8.39. The lowest pH was recorded at S9 and the highest at S1. S9 is influenced by near-shore oceanic waters with its typical pH. The electrical conductivity ranged from 35.8 to 52.6 mScm-1, the salinity between 22.8 and 34.7 (PSU scale). Lowest values were recorded at S4 and highest at S10. S4 is characterized by a mixture of fresh and seawater, while S10 is surf zone, oceanic water hence high salinity.
 
The dissolved oxygen concentration ranged between 6.44 and 18.81 mg/L, and the water was in all cases oversaturated with oxygen. The highest dissolved oxygen concentration and saturation was recorded at S3. Redox potential ranged from 92 to 200 mV. The lowest redox potential was recorded at S1 and the highest at S8 (detritus zone). Total dissolved solids ranged from 21.9 to 31.6 mg/L. The lowest total dissolved solids were recorded at S4 (estuarine zone) and the highest at S10 (surf zone seawater). Total suspended solids ranged from 18 to 38 mg/L. The lowest concentration of total suspended solids was recorded at S1 and the highest at S9, which is influenced by the ocean and tidal influence, hence with loaded suspended materials from the near-shore environment.
 
Alkalinity ranged from 195.52 to 237.97 mg/L. The lowest alkalinity was recorded at S10 and the highest at S3 (more freshwater mixes with sea water). Phosphate concentrations ranged from 0.05 to 1.10 mg/L. The lowest phosphate was recorded at S1 and the highest at S9. Nitrates ranged from 1.7 to 7.5 mg/L. The lowest nitrates were recorded at S7 and S8 (intermediate zone) and the highest at S9. The liquid waste discharges directly into near-shore waters and swimming activities at the Densu beach may have contributed to an increase in nutrient load in seaward direction. Furthermore, a small village with cage cultures for crabs, fish farming and farming activities is located at the seaward direction. This may result in a higher nutrient load in downstream direction of the estuary. Sulfate ranged from 15 to 37 mg/L. The lowest sulfate concentration was recorded at S4 (estuarine zone) and the highest at S1 (landwards). Chlorophyll-a concentration ranged from 0.96 to 4.38 µg/L. The lowest concentration was recorded at S3 (mixing zone) and the highest at S1 (landwards). Areas, with intense freshwater discharge into the estuary system (mixing zone), show high turbidity, leading to limited photosynthesis and hence low chlorophyll-a concentration at S3, whereas at S1 nutrient inputs from terrestrial land sources may facilitate increased primary production. The WQI ranged from 359.49 to 484.62, minimum values were recorded at S4 (estuarine zone) and maximum values at S9 (seaward zone).


Biological analyses
 
The abundance of bacteria (E. coli and Enterococcus spp.) significantly varied in the water of distinct stations (One-way ANOVA F9, 10 = 8.52; p < 0.05). However, the abundance of bacteria in the sediment showed no significant variation among the stations (One-way ANOVA F9, 10 = 1.09; p>0.05). Bacterial (E. coli and Enterococcus spp.) loads in the water did not differ significantly (p>0.05) from the counts in sediment (p>0.05 both, at one tail and two tails). In water, total coliforms ranged from 0 to 13,200 CFU/100 ml; E. coli ranged from 0 to 4,400 CFU/100 ml and Enterococcus spp. ranged from 0 to 2,200 CFU/100 ml. In sediment, the total coliforms ranged from 136 to 558 CFU/1 g; E. coli ranged from 0 to 3 CFU/g and Enterococci spp. ranged from 0 to 46 CFU/g. High bacteria (total coliforms, E. coli, Enterococci spp.) counts from water and sediment samples were found at S1 and S2, closer to a landfill site and waste disposal, while low abundance was evident seawards (S9). Escherichia coli is the numerically dominant bacteria in water (Figure 3a), while Enterococcus spp. is more abundant in the sediment (Figure 3b).
 
Polychaetes were the most dominant living macrofauna. In total, 275 individuals of polychaetes were counted. The relative abundance of polychaetes ranged from 5.09 to 14.55%, mainly Capitella and Nereis species were found. Lowest abundance (14 individuals per 0.04 m2) was recorded at S1 and the highest abundance (40 individuals per 0.04 m2) at S8. S1 is a shallow area with coarse grains without much vegetation cover and high human impact, whereas station S8 is characterized by mangroves with rich detritus-debris, muddy soft bottom and possibly with high organic matter, favourable conditions for polychaetes.
 
Multivariate statistics
 
Cluster analyses
 
The cluster analyses revealed two main groups with similar physicochemical parameters (Figure 4a). There was a significant association between alkalinity, temperature and pH (Figure 4a). The dendrograms for the organisms, namely total coliforms, faecal bacteria (E. coli and Enterococcus spp.) and polychaetes showed two similar associations (Figure 4b), (i) total coliform in water and sediment, (ii) E. coli and Enterococcus spp. in water, and (iii) E. coli, Enterococcus spp. and polychaetes in sediment (Figure 4b). The combined biological data and physicochemical parameters (Figure 5a) were grouped into three distinct clusters, namely landwards (S1 and S2), mixing zone (S3-7) and seawards (S8-10) (Figure 5b).


Principal component analysis
 
The canonical analysis triplot diagram displays the spatial distribution of biological data and physicochemical parameters at the studied stations of the Densu Estuary (Figure 6). It shows the influence of physicochemical parameters on the spatial distribution of organisms at the ten stations. The first axis contributes 59.96% and the second axis 14.15% to the total variation (Figure 6). The long arrows (chlorophyll-a, pH, phosphate, nitrates, total dissolved solids and redox potential) show physicochemical parameters that significantly influence the spatial distribution of the species. The first axis is correlated with chlorophyll-a, alkalinity and temperature. The second axis reflects a gradient related to pH, phosphate, nitrates, total dissolved solids, redox potential, water depth, salinity, electrical conductivity, sulphate, total dissolved solids, dissolved oxygen concentration and saturation (Figure 6). The redundancy analysis (RDA) revealed that the first axis contributes 51.09% and the second axis 28.49% to the abundance of organisms at the ten stations (Figure 7). The pH is the primary environmental factor influencing the faecal bacteria and polychaete distribution in the Densu Estuary. The pH significantly (p = 0.002) explained 51.1% of the variation in the species abundance (Figure 7).
 
Pearson’s correlation
 
The Pearson correlation coefficient (r) (Table 4) indicated that salinity significantly correlates positively with specific electrical conductivity (r = 0.999) and pH (r = 0.735). Specific   electrical   conductivity   significantly  correlates positively with pH (r = 0.720). Furthermore, the redox potential significantly correlated positively with pH (r = 0.850). Total dissolved solids also correlated positively with two variables: specific electrical conductivity (r = 0.863) and salinity (r = 0.864). In contrast, chlorophyll-a significantly correlated negatively with three variables: temperature (r = -0.691), pH (r = -0.675) and dissolved oxygen saturation (r = -0.725). Alkalinity significantly correlated negatively with three parameters: specific electrical conductivity (r = -0.891), salinity (r = -0.896) and total dissolved solids (r = -0.757). The concentrations of phosphate and nitrate also correlated significantly (r = 0.914), as did the nutrients with total suspended solids (phosphate, r = 0.862, nitrates, r = 0.870). Sulfate significantly correlated positively with water depth (r = 0.679). The WQI significantly correlated positively with pH (r = 0.727), specific electrical conductivity (r = 0.991, strong positive linear relationship) and total dissolved solids (r = 0.855) and negatively with alkalinity (r = -0.902, strong negative linear relationship) (Table 4). However, a significant (p < 0.005) linear association exists between physicochemical variables only (Table 4) and among biological data only (Table 5).
 
The abundance of the organisms correlated significantly among each other. Total coliforms in sediment significantly correlated positively with total coliforms in water (r = 0.641, p = 0.046) and chlorophyll-a (r = 0.815, p = 0.004), and negatively with redox potential (r = -0.656, p = 0.039) and pH (r = -0.832, p = 0.003). E. coli in sediment significantly correlated positively with water depth (r = 0.684, p = 0.029). Enterococcus spp. in sediment significantly correlated positively with total coliforms   in   sediment   (r  =  0.684,   p   =   0.029)   and chlorophyll-a (r = 0.668, p = 0.035). Polychaetes significantly correlated positively with temperature (r = 0.639, p = 0.047), pH (r = 0.816, p = 0.004), redox potential   (r = 0.778,   p = 0.008)   and   negatively    with chlorophyll-a (r = -0.857, p = 0.002), total coliforms in water (r = -0.684, p = 0.029), total coliforms in sediment (r = -0.833, p = 0.003), and Enterococcus spp. in water (r = -0.643, p = 0.045).


 DISCUSSION

Physicochemical parameters
 
Estuaries are highly variable environments and controlled by estuarine flushing times (Cloern and Jassby, 2010; Day Jr. et al., 2012). Some physicochemical parameters (Figure 2 and Table 3) varied among the stations, demonstrating the heterogeneous condition of the Densu Estuary. The physicochemical nature of this  estuary  can be classified into three zones; the landward zone (without any freshwater input), the intermediate zone, (characterised by a mixture of fresh and oceanic water) and the end of the estuary (characterised by the intrusion of seawater).
 
The mean temperature (32.17 ± 0.95°C) (Table 3) recorded in April reflects the water temperature condition for coastal waters in the dry season (31 to 33°C) (Biney, 1982; Biney, 1993; Karikari and Ansa-Asare, 2006). The coastal waters of Ghana are situated in  the  tropical  and equatorial climate belt and annual mean temperatures range between 25 and 36°C with little variation throughout the year (Biney, 1982, 1993; Karikari and Ansa-Asare, 2006). The two climatic zones in the coastal areas of Ghana are both characterized by homogeneous temperatures between 23 and 32°C with a mean annual value of 27°C (Karikari and Ansa-Asare, 2006). Highest temperature (32°C) occurs in March-April and the lowest (23°C) in August (Dickson et al., 1988). A pH range from 7 to 9 is suitable for estuarine life (Anzecc, 2000). The pH values for the Densu Estuary were between 8.31 and 8.39 and thus within the range for natural waters not acidified yet (Stumn and Morgan, 1981; Biney and Asmah, 2010; Lamptey et al., 2013). The pH may be modified by biological activity, photosynthesis, temperature, oxygen content, ocean acidification, cation and anion composition (Doney et al., 2015; Abdel-Halim and Aly-Eldeen, 2016; Apriani et al., 2018; Tanjung et al., 2019). Furthermore, increasing carbon dioxide in the atmosphere  can  cause  acidification  of  coastal   marine waters affecting its organisms (flora and fauna), function and ecosystem processes (Fabry et al., 2009; Doney et al., 2015; Curry, 2020).
 
The conductivity ranged from 35.8 to 52.5 mScm-1, which is typical for estuarine waters (Biney and Asmah, 2010). Values for estuaries are typically from 20 to 40 mScm-1, marine waters have much higher values (that is, 51.5 mScm-1). Increased conductivity is directly related to increased concentrations of salinity and total dissolved solids. Thus, high conductivity levels are often associated with sewage discharge and leaching of inorganic contaminants (Harrison, 1999).
 
The salinity ranged from 22.8 to 34.7, which is categorized as polyhaline (18 - 30) at landward stations and mixoeuhaline (30 - 40) conditions at seaward stations (Vernice System, 1959). Salinity increases with increase specific electrical conductivity; this was also established for Songor Wetland (Klubi et al., 2019). Salinity significantly (r = 0.999) correlated positively with conductivity, suggesting a strong linear association.
 
The mean dissolved oxygen concentration (6.44 - 18.81 mg/L) was above the natural background (7.0 mg/L) (Biney, 1993; Clark, 2000). Dissolved oxygen concentrations of unpolluted water bodies range from 8.0 to 10.0 mg/L at 25°C (Pearce et al., 1999). The low level of total dissolved solids at S4 could be due to a less turbulent environment, whereas the high total dissolved solids in marine oceanic waters due to accumulated solutes in suspension and tidal influence. The highest dissolved oxygen concentration and saturation were recorded at S3, which is influenced by freshwater inflow from the Densu River with high hydrodynamics condition.
 
 
The redox potential ranged from 92 to 200 mV, which is below the redox potential for natural waters (between 500 and 600 mV) (McLusky and Elliot, 2004, 2010). The alkalinity levels (195.52 - 237.97 mg/L) was also below the maximum contaminant levels of 500 mg/L suggested  by  the  WHO,  alkalinity  ranging from 300 to 400 mg/L has been recommended for drinking water (WHO, 1999, 2011).
 
Nutrients (mainly phosphate and nutrients) are important  chemical  compounds  in  water quality  monitoring (Conley et al., 2009). In the Densu Estuary, the mean phosphate concentration ranged between 0.05 and 1.10 mg/L, which is higher than the typical value for coastal marine waters of 0.02 mg/L (Biney, 1993; Oduro, 2003; Ouffoué et al., 2013). In most natural waters, phosphate ranges from 0.005 to 0.020 mg/L (Chapman, 1992), in some pristine waters, the phosphate concentration may even be as low as 0.001 mg/L (Chapman, 1992). The phosphate concentration can be used to categorized ecosystem: (i), <0.02 mg/L = healthy ecosystem, (ii) 0.02 to 0.3 mg/L = fair ecosystem, and (iii) > 0.3 mg/L = poor ecosystem. Thus, the Densu Estuary is classified as a poor estuarine ecosystem.
 
The nitrate concentration ranged from 1.7 to 7.5 mg/L and are thus at four of the five stations (S2, S3, S5 and S10) higher than the recommended 0.25 mg/L for coastal waters. Large quantities of nitrate and phosphate lead to eutrophication with high primary productivity (algal blooms) (Conley, 2000; De Jonge et al., 2002; Saad and Younes, 2006; Cook et al., 2018). However, in turbid estuaries, the light may limit phytoplankton blooms (Ambasht and Ambasht, 2005; Bucci et al., 2012; Green et al., 2015). The trophic state (chlorophyll-a concentration ranged between 0.96 and 4.38 µg/L) is interpreted as ultra-oligotrophic (<1.0) to mesotrophic (3.0-8.0) condition. Chlorophyll-a concentration is an estimate of phytoplankton biomass (Tripathy et al., 2005) and thus a key component of food availability for benthic and filter-feeding animals (Fujii, 2007). A positive relationship was found between the chlorophyll-a concentration and the abundance of macrofaunal species (Lamptey and Armah, 2008; Musale and Desai, 2011).
 
The WQI ranged between 359.49 and 484.62 and was thus >300, which is categorized as unsuitable water for drinking and indicates a deteriorating ecosystem (Ramakrishnaiah et al., 2009; Lamptey et al., 2013; Nguyen and Sevando, 2019). However, a good water quality is necessary to sustain the living resources of the ecosystem (Nyarko et al., 2015; Duncan, 2018; Tanjung et al., 2019).
 
Biological indicators of environmental quality
 
The dominance organisms reflect the sediment quality, which is also reflection of the water quality status. High bacteria load (total coliforms, E. coli and Enterococcus spp.) (Figures 2 and 3 and Table 3) especially at S1 and S2 reflect high anthropogenic activities (e.g., landfill sites, domestic and animal waste discharges) in the landward direction of the estuary. Faecal bacteria enter surface waters by direct deposition of human and animal waste discharges and indirectly through land runoff and leach into the Densu Estuary. Microbial contamination of water and sediment is a growing concern for the ecosystem and human health (Odonkor and Ampofo, 2013; Walker et al., 2015). Faecal indicator organisms  are  often  used to detect and quantify aquatic pollution (Horan, 2003; Odonkor and Ampofo, 2013). The faecal bacteria (total coliforms, E. coli and Enterococcus spp.) are used to indicate pathogens of faecal origin in surface and coastal water bodies (Medema et al., 2003; Pandey et al., 2014). Faecal bacteria (E. coli and Enterococcus spp.) are characteristic intestinal bacteria of warm-blooded animals (Medema et al., 2003; Shuval, 2005). Escherichia coli (also known as faecal coliform) is the best bacterial indicator of faecal pollution (Stewart et al., 2008; Walker et al., 2015). Faecal enterococci are also used as complementary microbiological water quality indicator (Byamukama et al., 2000). The presence of coliform bacteria suggests a potential for waterborne related pathogens to be present (Shuval, 2003; Jain, 2013). The presence of faecal bacteria (E. coli and Enterococci spp.) indicates sources of human and animal pollution in the Densu Estuary.
 
The dominance of polychaetes (Capitella and Nereis spp.) also suggests environmental pollution in the Densu Estuary. Polychaete worms were the most dominant living macrofauna. These polychaete species are most abundant in organic matter enriched sediments (Saleh, 2012; Aqilah et al., 2016). Capitella spp. are sedentary deposit feeders (Levinton and Kelaher, 2004; Lamptey and Armah, 2008; Musco et al., 2009). Polychaetes may be used as sensitive indicators of anthropogenic disturbances, such as organic pollution (Cai et al., 2001; Elias et al., 2006; Metcalfe and Glasby, 2008). Several polychaetes are opportunistic species capable of reproducing after an increase in organic matter (Giangrande et al., 2005; Musale and Desai, 2011). In an estuary and mangrove environment, polychaetes provide food for shorebirds, for instance, the Bar-tailed Godwit Limosa lapponica feeds on Nereis spp. (McLusky and Elliot, 2010). The polychaetes, Capitella and Nereis spp. often dominate soft bottoms of polluted and organic enrichment waters (Alongi, 1990; McLusky and Elliot, 2004; Wada et al., 2008; Cai et al., 2013). Under anoxic conditions, most of the macrofaunal can become extinct (McLusky and Elliot, 2010). A small number of empty shells of molluscs and gastropods was observed.
 
Spatial similarity and variations of stations
 
The hierarchical clusters (Figures 4a-b and 5a-b) indicated spatial similarity among physicochemical factors only, biological data only and combined effects (Mac Nally, 1996). Cluster and Pearson’s correlation analyses revealed a significant (p < 0.05) association of microbiological organisms in water and sediment (Figures 4a-b and 5a-b); (i) total coliforms in water and sediment, (ii) E. coli and Enterococcus spp. in water, and (iii) E. coli, Enterococcus spp. and polychaetes in sediment. There was a clear evidence of ecological interactions. Temperature,  pH and alkalinity were significant factors in the estuary system. Any change of these variables may change the condition of the estuary. The contamination of stations (S1 and S2) originates from land sources, apparently anthropogenically influenced (e.g., domestic and animal waste disposal). The mixing zone (S3-7) is characterized by catchments of the river mixing with marine water. The marine zone is located downstream of the estuary with the intrusion of saline, oceanic waters into the Densu Estuary (S8-10). This shows the interaction of water and sediment characteristics of eco-hydrochemical estuarine conditions. Principal component analyses (PCA), in harmony with the cluster analyses (CA) (Figures 5 to 7), indicated landward sources of major pollution, hydrodynamic condition of freshwater and seawater mixing and marine intrusion into the estuarine system. Thus, the Densu Estuary is characterized by distinct hydrochemical dynamic pathways as observed in Songor Wetland (Klubi et al., 2019).
 
There is a strong interaction of biotic and abiotic component of the ecosystem and among each other (Tables 4 and 5 and Figures 5 to 7), as expected (Borja et al., 2012). The state of water quality is reflected also in the sediment quality, an insight into the ecological integrity of the Densu Estuary. The integration of physico-chemical and biological assessment of coastal ecosystems pollution status is critical for the broader understanding of various pathways of environmental contamination and sustainable management of coastal waters (Ambasht and Ambasht, 2005; Ouffoué et al., 2013; Larbi et al., 2018).


 CONCLUSION

The knowledge of ecological integrity of estuaries along the coast of Ghana is still scarce. Because of its fisheries resources the Densu Estuary is of high socio-economic importance for the coastal communities. The deforestation of the Densu Delta wetland (a Ramsar site) and poor sanitation in the vicinity will not only affect the regulation of the local hydrological cycles, loss of habitats and introduce flood-related risks, but also water-borne diseases. The environmental quality of the estuary was assessed using multiple ecological indicators. The study emphasized on physicochemical drivers of organisms in the Densu Estuary.
 
Significant variation (p < 0.05) of some physicochemical parameters occurred among the stations. There is a clear salinity gradient from 22.8 to 34.7. Nutrient (nitrate and phosphate) concentrations exceeded recommended levels for natural coastal waters, indicating a degraded ecosystem. Phosphate concentrations ranged from 0.05 to 1.10 mg/L. Nitrate ranged from 1.7 to 7.5 mg/L. Dissolved oxygen concentrations ranged from 6.44 to 18.81 mg/L. The computed WQI ranged from 359.49  to  484.62  and  thus indicated a deteriorating system.
 
The abundance of organisms significantly varied between the sampling stations. The presences of faecal bacteria (total coliforms, E. coli and Enterococcus spp.) suggest faecal contamination. The dominance of key macrofaunal (e.g., Capitella and Nereis spp.) suggests organic pollution. The results indicate an impacted environment of the Densu Estuary, which can impose ecosystem and human health risks, a cause for further investigation.
 
The cluster analyses helped to classify the stations into three major groups; landward zone, intermediate zone and seaward zone. The physicochemical parameters coupled with biological data were also grouped into three distinct clusters, mainly landward, mixed zone and marine sources. The significantly contaminated stations (S1 and S2), may be influenced by domestic and animal waste disposal, the intermediate zone (S3-7), characterized by mixing of freshwater and marine water and the seaward zone (S8-10) is characterized by seawater intrusions into the estuary. The PCA performed on physicochemical and biological data helped to identify natural and anthropogenic sources of the contamination. The first two axes explained 74.11% of the variation in the abundance data. The pH is the most influential ecological factor that explained the spatial distribution of faecal bacteria and polychaetes in the Densu Estuary.
 
The faecal bacteria (E. coli and Enterococcus spp.) showed significant (p < 0.05) positive correlation with chlorophyll-a concentration, but negatively correlated with redox potential and pH, whereas polychaetes displayed a significant positive correlation with temperature (r = 0.64), pH (r = 0.82) and redox potential (r = 0.78), but negative with chlorophyll-a concentration (r = -0.86).
 
The findings provide an ecological baseline for environmental monitoring and for effective policy formulation to control discharges of waste into coastal waters. The study contributes to an ecological perspective on the environmental quality of the Densu Estuary using multiple indicators to identify the different sources of environmental pollution.


 CONFLICT OF INTERESTS

The authors have not declared any conflict of interests.


 ACKNOWLEDGEMENTS

The authors thank all those who made this research possible, especially Prof. Peter Frenzel, Prof. Hartmut Stuetzel, Dr. Hanna Wielandt and Frau Sylvia Janning. Kwadwo Kyeremateng is deeply appreciated for designing Figure 1. The authors are also grateful to the Department of Marine and Fisheries Sciences for support during  field  and  laboratory   analyses;  and Volkswagen Foundation, Germany for funding the research to L.G.A (Grant no. 89371).


 REFERENCES

Abdel-Halim AM, Aly-Eldeen MA (2016). Characteristics of Mediterranian sea water in vicinity of Sidikerir region, west of Alexandria, Eqypt. The Eqyptian Journal of Aquatic Research 42:133-140.
Crossref


Aggrey-Fynn J, Galyuon I, Aheto DW, Okyere I (2011). Assessment of the environmental conditions and benthic macroinvertebrate communities in two coastal lagoons in Ghana. Annals of Biological Research 2:413-424.


Aglanu LM, Appiah DO (2017). The Korle lagoon in distress: The stress of urban solid waste on water bodies in Accra, Ghana. International Journal of Innovation and Applied Studies 7:717.


Alongi DM (1990). The ecology of tropical soft-bottom benthic ecosystems. Oceanography and Marine Biology An Annual Review 28:381-496.


Ambasht RS, Ambasht PK (2005). Environmental Pollution: An ecological approach.4th Edition. CBS Publishers, New Delhi. 323p.


Anzecc (2000). Australian and New Zealand Guidelines for Fresh and Marine Water Quality. Volume 1, 314p.


American Public Health Association (APHA) (1998). Standard Methods for the Examination of Water and Wstewater. 19th Edition. American Public Health Association, Washington, DC, United States. 874p.


American Public Health Association (APHA) (2012). Standard Methods for Examination of Water and Wastewater. 22nd Edition. American Public Health Association, Washington, DC, United States, 1360p.


Apriani M, Hadi W, Masduqi A (2018). Physicochemical properties of sea water and bittern in Indonesia: Quality improvement and potential resources utilization for marine environmental sustainability. Journal of Ecological Engineering 19:1-10.
Crossref


Aqilah N, Darif NAM, Shakila N, Samad NSA, Salleh S, Mohammad M, Nordin NAA, Javeed AMM, Jonik MGG, Zainudi MHM (2016). The abundance and spatial distribution of soft sediment communities in Tanjung Bungah, Malaysia: A preliminary study. Tropical Life Sciences Research 27:71-77.
Crossref


Armah AK (1993). Coastal wetlands of Ghana. Coastal Zone 93:313-322.


Armah AK, Amalalo DS (1998). Coastal Zone Profile of Ghana. In: Gulf of Guinea Large Marine Ecosystem Project. Ministry of Environment, Science and Technology, Accra, Ghana, 111p.


Biney CA (1982). Preliminary survey of the state of pollution of the coastal environment of Ghana. Oceanologia Acta 4:39-43.


Biney CA (1993). Coastal zone management in Accra. In: Reprinted for coastal lines of Western Africa. Proceedings, 8th Symposium on Coastal and Oceans Management, New Orleans, pp. 115-128.


Biney CA, Asmah R (2010). The effect of physico-chemical parameters on speciation of trace metals in sediments from inland and coastal waters of Ghana. African Journal Aquatic Science 25:299-305.
Crossref


Borja R, Basset A, Bricker S, Dauvin J, Elliot M, Harrison T, Marques J, Wiesberg S, West R (2012). Classifying ecological quality and integrity of estuaries. In E Wolankski and D McLusky (Eds). Treatise on Estuarine and Coastal Science. Academic Press, Waltham, pp. 125-162.
Crossref


Boyer JN, Kelbe CR, Ortner PB, Rudnick DT (2009). Phytoplankton bloom status: Chlorophyll-a biomass as an indicator of water quality condition in the southern estuaries of Florida, USA. Ecological Indicators 9S:S56-S67.
Crossref


Bucci AF, Ciotti AM, Pollery RCG, de Carvalho RD, de Albuquerque HCD, Simões LTS (2012). Temporal variability of chlorophyll-a in the São Vicente Estuary. Brazilian Journal of Oceanography 60:485-499.
Crossref


Byamukama D, Kansiime F, Mach RL, Farnleitner AHH (2000). Determination of Escherichia coli contamination with chromocult coliform agar showed a high level of discrimination efficiency for differing faecal pollution levels in tropical waters of Kampala, Uganda. Applied Environmental Microbiology 66:864-868.
Crossref


Cabral JPS (2010). Water microbiology. Bacterial pathogens and water. International Journal of Environmental Research and Public Health 7:3657-3703.
Crossref


Cai LZ, Hwang JS, Dahms HU, Fu SJ, Chen XW, Wu C (2013). Does high organic matter content affect Polychaete assemblages in a Shenzhen bay mudflat, China? Journal of Marine Science and Technology 21:274-284.


Cai LZ, Lin J, Li H (2001). Macroinfauna communities in an organic-rich mudflat at Shenzhen and Hong Kong, China. Bulletin Marine Science 69:1129-1138.


Chapman D (1992). Water Quality Assessment: A Guide to the Use of Biota, Sediment and Water in Environmental Monitoring. 1st Edition. World Health Organization (WHO), Geneva, Switzerland. 585 p.
Crossref


Clark RB (2000). Marine Pollution. 4th Edition. Clavendon Press, Oxford, United Kingdom.


Clarke KR, Gorley RN (2006). PRIMER v6: User manual/tutorial. PRIMER-E. 1992, Plymouth Marine Laboratory, Plymouth, UK.


Cloern JE, Jassby AD (2010). Patterns and scales of phytoplankton variability in estuarine-coastal ecosystems. Estuaries and Coasts 33:230-241.
Crossref


Conley DJ (2000). Biogeochemical nutrient cycles and nutrient management strategies. Hydrobiologia 410:87-96.
Crossref


Conley DJ, Paerl HW, Howarth RW, Boesch DF, Seitzing SP, Havens KE, Lancelot C, Likens GE (2009). Controlling eutrophication: nitrogen and phosphorous. Science 323:1014-1015.
Crossref


Cook PLM, Warry FY, Reich P, Nally RM, Woodland RJ (2018). Catchment land use predicts benthic vegetation in small estuaries. Peer Journal 6:e4378.
Crossref


Curry A (2020). Effects of Multiple Stressors on the Development and Performance of Decapod Crustaceans. In: School of Ocean Sciences. Bangor University, Bangor, Wales, United Kingdom, 202p.


da Silveira Fiori C, de Castro Rodrigues AP, Santelli RE, Cordeiro RC, Carvalheira RG, Araújo PC, Castilhos ZC, Bidone ED (2013). Ecological risk index for aquatic pollution control: A case study of coastal water bodies from the Rio de Janeiro State, southeastern Brazil. Geochimica Brasiliensis 27:24-36.
Crossref


Day JH (1967a). A Monograph on the Polychaeta of Southern Africa. Part 1, Errantia. Trustees of the British Museum, London, UK.
Crossref


Day JH (1967b). A Monograph on the Polychaeta of Southern Africa. Part II, Sedentaria. Trustees of the British Museum, London, UK.
Crossref


Day Jr. JW, John AB, Crump, BC, Kemp W, Yáñez-Arancibia A (2012). Estuarine Ecology. 2nd Edition. John Wiley-Blackwell & Sons, Inc.
Crossref


De Jonge VN, Elliot M, Orive E (2002). Causes, historical development, effects and future challenges of a common environmental problem: Eutrophication. Hydrobiologia 475/476:1-19.
Crossref


Debrah C (1999). Specialtion of heavy metals in waters and sediment from the Densu Basin. Department of Chemistry. University of Ghana, Legon-Accra, Ghana. 155 p.


Dickson KB, Benneh G, Essah R (1988). A New Geography of Ghana. Longman Group Limited, Essex, London, UK.


Doney SC, Balch VJ, Fabry VJ, Freely RA (2015). Ocean acidification: A critical emerging problem of the ocean sciences. Oceanography 22:16-25.
Crossref


Duncan AM (2018). Water pollution and water quality assessment of major transboundary rivers from Banat (Romania). Journal of Chemistry, pp. 1-8.
Crossref


Elias R, Rivero MS, Palacios JR, Vallarino EA (2006). Sewage-induced disturbance on polychaetes inhabiting intertidal mussel beds of Brachidontes rodriguezii off Mar del Plata (SW Atlantic, Argentina). Scientia Marina 70:187-196.
Crossref


Fabry VJ, Seibel BA, Feely RA, Orr JC (2009). Impacts of ocean acidification on marine fauna and ecosystem processes. ICES Journal of Marine Science 6:414-423.
Crossref


Fathi P, Ebrahimi E, Mirghafarry M, Esmaili OA (2016). Water quality assessment in Choghakhor Wetland using water quality index (WQI). Iran Journal of Fisheries Science 15:508-523.


Fianko JR, Osae S, Achel D (2009). Impact of anthropogenic activities on the Densu River in Ghana. Water and Environmental Journal 23:229-234.
Crossref


Fujii T (2007). Spatial patterns of benthic macrofauna in relation to environmental variables in an intertidal habitat in the Humber Estuary, UK: Developing a tool for estuarine shoreline management. Estuarine Coastal Shelf Science 75:101-119.
Crossref


Giangrande A, Licciano M, Musco L (2005). Polychaetes as environmental indicators revisited. Marine Pollution Bulletin 50:1153-1162.
Crossref


Greene CM, Blackhart K, Nohner J, Candelmo A, Nelson DM (2015). A national assessment of stressors to estuarine fish habitats in contiguous USA. Estuaries and Coasts 38:782-799.
Crossref


HACH (2012). Water Analysis Handbook. Hach Company, Loveland, Colorado, USA. pp 31-48, 65,1031-1039, 1129-1147, 1241-1359.


Hagan GB, Ofosu FG, Hayford EK, Osae S, Oduro-Afriyie K (2011). Heavy metal contamination and physico-chemical assessment of the Densu River Basin in Ghana Research Journal of Environmental and Earth Sciences 3:385-392.


Hammer Ø, Harper DAT, Ryan PD (2001). PAST: Palaeontological statistics software package for education and data analysis. Palaeontologia Electronica 4:9.


Harrison RM (1999). Understanding our Environment: An introduction to Environmental Chemistry and Pollution. 3rd Edition. The Royal Society of Chemistry,Cambridge, Great Britain 326p.


Hinga KR, Jeon H, Lewis NF (1995). Marine Eutrophication Review Part 1: Quantifying the Effects of Nitrogen Enrichment on Phytoplankton in Coastal Ecosystems. In: Part 2 Bibliography with abstracts. NOAA Coastal Ocean Program. Decision Analysis Series. NOAA Coast Ocean Office, Silver spring, MD, US Department of Commence,United States of America. 36p.


Horan NJ (2003). Faecal indicator organisms. In: Duncan M, Horan NJ (eds) The Handbook of Water and Wastewater Microbiology. Elsevier, Great Britian, pp. 105-112.
Crossref


Horton RK (1965). An index number system for rating water quality. Journal of Water Pollution Control Federation 37:300-306.


Jain R (2013). Crucial need for water quality monitoring of biological contaminants. Clean Technologies and Environmental Policy 15:1-3.
Crossref


Karikari AY, Ansa-Asare OD (2006). Physico-chemical and microbial water quality assessment of Densu River of Ghana. West African Journal of Applied Ecology 10:87-100.
Crossref


Khamis H (2008). Measures of association: How to choose? Journal of Diagnostic Medical Sonography 24:155-162.
Crossref


Klubi E, Abril JM, Nyarko E, Delagado A (2018). Impact of gold-mining activity on trace elements enrichment in the West African estuaries: The case of Pra and Ankobra rivers with the Volta Estuary (Ghana) as the reference. Journal of Geochemical Exploration 190:229-244.
Crossref


Klubi E, Addo S, Akita LG (2019). Assessment of hydrological pathway and water quality of the Songor wetland, Ghana. African Journal of Environmental Science and Technology 13:511-523.


Koranteng KA (1995). Ghana coastal wetlands management project, environmental baseline studies of Densu delta Ramsar site. Fisheries Report prepared for Ministry of Fisheries, Government of Ghana, Accra, Ghana.


Lamptey AM, Ofori-Danson PK, Abbenney-Mickson S, Breuning-Madsen H, Abekoe MK (2013). The influence of land-use on water quality in a tropical coastal area: Case study of the Keta Lagoon Complex, Ghana, West Africa. Open Journal of Modern Hydrology 3:188-195.
Crossref


Lamptey E, Armah AK (2008). Factors affecting macrobenthic fauna in a tropical hypersaline coastal lagoon in Ghana, West Africa. Estuaries and Coasts 31:1006-1019.
Crossref


Larbi L, Nukpezah D, Mensah A, Addo KA (2018). An integrated assessment of ecological health status of coastal aquatic ecosystems of Ada in Ghana. West African Journal of Appied Ecology 26(1):89-107.


Levinton J, Kelaher B (2004). Opposing organizing forces of deposit feeding marine communities. Journal of Experimental Marine Biology and Ecology 300:65-82.
Crossref


Mac Nally R (1996). Hierarchial partitioning as an interpretative tool in multivariate inference. Australian Journal of Ecology:224-228.
Crossref


Mahu E, Nyarko E, Hulme S, Coale KH (2015). Distribution and enrichment of trace metals in marine sediments from the Eastern equatorial Atlantic, off the coast of Ghana in the Gulf of Guinea. Marine Pollution Bulletin 98:301-307.
Crossref


Mahu E, Nyarko E, Hulme S, Swarzenski P, Asiedu DK, Coale KH (2016). Geochronology and historical deposition of trace metals in three tropical estuaries in the Gulf of Guinea. Estuarine Coastal and Shelf Science 177:31-40.
Crossref


McLusky DS, Elliot M (2004). The Estuarine Ecosystem: Ecology, Threats and Management. Oxford University Press, New York.


McLusky DS, Elliot M (2010). The Estuarine Ecosystem, Oxford Univeristy Press, New York.


Medema GJ, Payment P, Dufour A, Robertson W, Waite M, Hunter P, Kirby R, Anderson Y (2003). Safe drinking water: An ongoing challenge. In assessing microbial safety of drinking water. Improving approaches and method. WHO & OECD, IWA Publishing, London, UK, pp. 11-45.


Metcalfe KN, Glasby CJ (2008). Diversity of Polychaeta (Annelida) and other worm taxa in mangrove habitats of Darwin Harbour, northern Australia. Journal of Sea Research 59:70-82.
Crossref


Möller WAA, Scharf BW (1986). The content of chlorophyll-a in the sediment of the volcanic maar lakes in the Eifel region (Germany) as an indicator for eutrophication. Hydrobiologia 143:327-329.
Crossref


Monbet Y (1992). Control of phytoplankton biomass in estuaries: A comparative analysis of microtidal and macrotidal estuaries. Estuaries 15:563-571.
Crossref


Monney I, Boakye R, Buamah R, Anyemedu FOK, Odai SN, Awuah E (2013). Urbanization and pollution of surface water resources in the two largest cities in Ghana. International Journal of Environmental Monitoring and Analysis 1:279-287.
Crossref


Mophin-Kani K, Murugesan AG (2011). Evaluation and classification of water quality of perennial River Tamirabarani through aggregation of water quality index. International Journal of Environmental Protection 1:24-33.


Mudroch A, Azcue JM (eds) (1995). Manual of Aquatic Sediment Sampling. Taylor & Francis CRC Press. 240p.


Musale AS, Desai DV (2011). Distribution and abundance of macrobenthic polychaetes along the South Indian coast. Environmental Monitoring and Assessment 178:423-436.
Crossref


Musco L, Terlizzi A, Licciano M, Giangrande A (2009). Taxonomic structure and the effectiveness of surrogates in environmental monitoring: A lesson from polychaetes. Marine Ecological Progress Series 383:199-210.
Crossref


Nagelkerke NJD (1991). A note on a general definition of the coefficient of determination. Biometrika 78:691-692.
Crossref


Nguyen NTT, Sevando M (2019). Assessing coastal water quality through an overall index. Polish Journal of Environmental Studies 28:2321-2330.
Crossref


Nyarko E, Lamptey AM, Owiredu-Amaning DA (2015). Application of water quality index for assessment of the nearshore coastal waters of Accra. Journal of Pollution Research 34:657-666.


Odonkor ST, Ampofo JK (2013). Escherichia coli as an indicator of bacteriological quality of water: An overview. Microbiology Research 4:e2.
Crossref


Oduro L (2003). Gender and natural resources management of Weji lake and its environment. MPhil Thesis. University of Ghana, Legon-Accra, Ghana.


Okyere I, Aheto DW, Aggrey-Fynn J (2011). Comparative ecological assessment of biodiversity of fish communities in three coastal wetland sysems in Ghana. European Journal of Experimental Biology 1:178-188.


Ouffoué KS, Salla M, Kicho DY, Soro D, DA.P. K, Tonzibo ZF (2013). Water Quality Assessment of the Coastal Tropical River'Sboubo (Côte d'Ivoire): Physico-Chemical and Biological Aspects. Journal of Environment Pollution and Human Health 1:9-15.


Pandey PK, Kass PH, Soupir ML, Biswas S, Singh VP (2014). Contamination of water resources by pathogenic bacteria. AMB Express 4.
Crossref


Patzkowsky ME, Holland SM (2012). Stratigraphic Paleobiology: Understanding the Distribution of Fossil Taxa in Time and Space. University of Chicago Press, Chicago, United States of America. 259p.
Crossref


Pearce GR, Chaudhry MR, Ghulum S (eds) (1999). A Simple Methodology Water Quality Monitoring. Department for International Development Wallingford, 100p.


Ramakrishnaiah CR, Sadashivaiah C, Ranganna G (2009). Assessment of water quality index for the groundwater in Tumkur Taluk, Karnataka State, India. E-Journal of Chemistry 6:523-530.
Crossref


Saad MAH, Younes WAN (2006). Role of phosphorus and nitrogenous species in water quality of a coastal Egyptian heavily polluted Mediterranean basin. International Journal of Oceans and Oceanography 1:1-19.


Sahu P, Sikdar PK (2008). Hydrochemical framework of the aquifer in and around East Kolkata Wetlands, West Bengal. India Environmental Geology 55:823-835.
Crossref


Saleh AAT (2012). Effects of multiple-source of pollution on spatial distribution of polychaetes in Saudi Arabia. Research Journal of Environmental Toxicology 6:1-12.
Crossref


Sanchez E, Colmenarejo MF, Vicente J, Rubio A, Garcia MG, Travieso L, Borja R (2007). Use of the water quality index and dissolved oxygen deficit as simple indicators of watersheds pollution. Ecological Indicators 7:315-328.
Crossref


Shuval H (2003). Estimating the global burden of thalassogenic diseases: Human infectious diseases caused by wastewater pollution of the marine environment. Journal of Water Health 1:53-64.
Crossref


Shuval H (2005). Thalassogenic Infectious Diseases Caused by Wastewater Pollution of the Marine enviornment: An Estimate of the Worldwide Occurence. In: Belkin S, Colwell RK (eds) Oceans and Health: Pathogens in the Marine Environment. Springer, Boston, MA, United States of America. pp. 373-389.
Crossref


Šmilauer P, Lepš J (2014). Multivariate analysis of ecological data using CANOCO 5. Cambridge University Press, Cambridge, U.K.
Crossref


Solley WB, Pierce RR, Perlman HA (1998). Estimated use of water in the United States in 1995. In: Circular. U.S. Geological Survey United States. U.S. Geological Survey Circular 1200.
Crossref


Stewart MR, Gast RJ, Fujioka RS, Solo-Gabriele HM, Meschke SJ, Amaral-Zettler LA, de Castillo E, Polz MF, Collier DR, Strom MS, Sinigalliano CD, Moeller PD, Holland AF (2008). The coastal environment and human health: Microbial indicators, pathogens, sentinels and reservoirs. Environmental Health S3 (7 Suppl. 2).
Crossref


Stumn W, Morgan JJ (1981). Aquatic chemistry. An Introduction Emphasizing Chemical Equillibria in Natural Waters. 2nd Edition. John Wiley and Sons Ltd. New York, 780p.


Tanjung RHR, Hamuna B, Alianto (2019). Assessment of water quality and pollution index in coastal waters of Mimika, Indonesia. Journal of Ecological Engineering 20:87-94.
Crossref


Teley AH (2001). The impact of Waste disposal on the surface and groundwater environment: A case study of the Mallam landfill site, Accra. Department of Environmental Science. University of Ghana, Legon-Accra, Ghana.


Tirkey P, Bhattacharya T, Chakraborty S (2015). Water quality indices- important tools for water quality assessment: A review. International Journal of Advances in Chemistry 1:15-30.


Tripathy SC, Ray AK, Patra S, Sarma VV (2005). Water quality assessment of Gautami- Godavari mangroves estuarine ecosystem of Andhra Pradesh, India during Septemeber 2001. Journal of Earth System Science 114:185-190.
Crossref


Twilley RR, Chen RH, Hargis T (1992). Carbon sinks in mangrove forests and their implications to the carbon budget of tropical coastal ecosystems. Water Air Soil Pollution 64:265-288.
Crossref


USEPA (2009).The United States Environmental Protection Agency, National Primary Drinking Water Requlations.


Vernice System (1959). The Venice System for the classification of marine waters according to salinity. In: Ancon D (ed) The final resolution of the Symposium on the classificcation of brackwaters. Symposium on the classification of brackish waters, Venice, Italy. Arch Oceanography II (Suppl. pp 243-248.


Wada M, Zhang D, Do HK, Nishimura M, Tsutsumi H, Kogure K (2008). Co-inoculation of Capitella sp. with its synergistic bacteria enhances degration of organic matter in organically enriched sediment below fish farms. Marine Pollution Bulletin 57:86-93.
Crossref


Walker JW, van Duivenboden R, Neal MW (2015). A tiered approach for the identification of faecal pollution sources on an Auckland urban beach. New Zealand Journal of Marine Freshwater Research 49:333-345.
Crossref


WHO (1999). WHO Guidelines for Drinking Quality Water. World Health Organisation, Geneva, Switzerland, pp. 160-220.


WHO (2011). Guidelines for Drinking Water Quality. World Health Organisation, Geneva, Switzerland.


WRI (2003). Groundwater assessment: An element of integrated water resources management-The case study of Densu River Basin. In. Council for Scientific and Industrial Research Institute (CSIR)-Water Research Institute (WRI), Accra, Ghana.


Yadav S (2018). Correlation analysis in biological studies. Journal of the Practice of Cardiovascular Sciences 4:116-121.
Crossref


Yeleliere E, Cobbina SJ, Duwiejuah AB (2018). Review of Ghana's water resources: The quality and management with particular focus on freshwater resources. Applied Water Science 8:93.
Crossref


          */?>