Full Length Research Paper

ABSTRACT
Reliable data on e-waste generation is important for environmentally sound management systems. This study models e-waste generation from existing data on electrical electronics imports, consumption and e-waste generation from Nigerian households. Structured questionnaires were used to obtain information on Electrical Electronic Equipment (EEE) use, reuse, and disposal from households in Nigeria households. Data from placed on the market (POM) were obtained from United Nations University (UNU) for five EEE types (TV, DVD player, refrigerator, desktop and laptop) in Nigeria between 1995 and 2019 using the apparent consumption method. A forecast up to 2020 and backcasts to 1980 were made based on these data. The lifetime profile for these five EEEs was modeled using the Weibull distribution function characterized by a time-varying shape parameter and a scale parameter. The POM data from 1980 to 2020 and the lifetime of the selected EEE from households were analyzed and fit into the Weibull lifetime distribution functions. The differences between reuse and non-reuse options show that around 54 million units of DVD players; 106 million units of CRT TV; 22 million units of the refrigerator; 11 million units of laptops and 24 million units of desktop computers would have been delayed from transiting into e-waste stream between 1981 and 2020 through reuse options.
Key words: Electronic waste, electrical electronic equipment, lifetime distribution, re-use repair, recycling, Nigeria.
INTRODUCTION
Waste electrical and electronic equipment (WEEE), or e-waste includes a wide range of products which comprises of any household or business item with circuitry or electrical components with power or battery supply (Balde et al., 2017) which have been discarded by the owner as waste without the intention of re-use (StEP, 2014). Global e-waste generation grew by about 9.2 million metric tonnes (Mt) from 2014 to 2019 which makes total e-waste generated worldwide in 2019 to be estimated at around 53.6 million tons (Mt), an equivalent of 7.3 kilograms per inhabitant (kg/inh). E-waste generated globally per annum is expected to exceed 74.7 Mt by 2030 (Forti et al., 2020), and up to 111 million tons per annum by 2050 (Parajuly et al., 2019). The growth in e-waste can be linked to high consumption rates of electrical electronic equipment (EEE) with short lifetime cycles, and very low repair rate and reuse options. Many previous research works have been reported in recent times focusing on the e-waste management system (Iqbal et al., 2015; Pathak and Srivastava, 2017; Imran et al., 2017; Sajid et al., 2019). Several of the previous work focused on policy and legislative efforts, financing and awareness schemes as part of the solution to e-waste management. The reduction of e-waste volumes and substantive repair and reuse of EEE have been limited so far in the literature. There has been a significant quest to understand e-waste generation and collection/treatment using Environmentally Sound Management (ESM) by stakeholders. The sustainable collection and management of information are sometimes difficult to achieve especially in developing countries because of the lack of e-waste inventory and often uncoordinated system boundaries. Previous studies have attempted to fill this gap, for instance, Wang et al. (2013) applied an input-out analysis linking sales, stock, and lifespan data approach. Similarly, the US Environmental Protection Agency (EPA) updated two earlier studies and estimated e-waste generated quantities using a deterministic sales obsolescence method (USEPA, 2011). The United Nations University (UNU) developed an interactive map of e-waste generation to develop a global e-waste monitor which used trade data to estimate sales and inferred lifespan from stocks and apparent sales data (Balde et al., 2017). Previous works have used different parameters and approaches to estimate the volume of e-waste generation (Araujo et al., 2012; Huisman et al., 2012). However, none has presented a detailed prognosis of the effect of repair options for End of Life (EoL) devices for reuse on the lifetime estimation and how this further affects the volume of e-waste generated. “Life-time” for this study comprises the active use time of an EEE including the extended reuse time after repairs by owners/households.
This study is a follow-up on the Person in Port (PiP) project (Odeyingbo et al., 2017) which was carried out under the United Nations University (UNU) framework (in collaboration with the U.S. Environmental Protection Agency (EPA), the Basel Convention Coordination Centre for Africa (BCCC) in Nigeria, and Gesellschaft fur Internationale Zusammenarbeit, (GIZ) to assess the quantity and quality of used electrical electronic equipment (UEEE) and e-waste import into Nigeria. The PiP provided reliable data by developing an assessment approach that combines inspection of incoming containers of UEEE and evaluation of import-related documentation. The PiP observed the importation of about 60,000- 71,000 tons of UEEE with about 19% non-functional. With a very active repair network, some of the non-functional UEEE are cannibalized to fix other UEEE products. This study aims to investigate the role of the ‘repair and reuse’ tradition in Nigeria in reducing the amount of e-waste generated. This will improve the existing data and knowledge by providing a better prognosis of the e-waste sector of Nigeria and to further refining and complement existing e-waste flow assessment. This study, therefore, quantified benefits from EEE reuse and especially the savings in the e-waste generation in Nigeria. This study fills the gap created by a lack of knowledge of the effect of reuse on lifetime calculation and improves e-waste generation estimates. Effective and continuous capture of data on electrical electronic equipment flow is essential for achieving effective management plans and projections. The availability of data will improve the measurement in the collection rate of WEEE and refine the management plans for the proper treatment of e-waste.
MATERIALS AND METHODS
A household survey approach was applied in this study to develop a lifetime model under the specific repair and reuse traditions in Nigeria. This study used a combination of put on the market (POM) data obtained from UNU data set in and lifetime distributions information obtained from a household survey. When EEE are placed on the market, it stays in households and businesses which represent the active use stage. For this study, the use phase includes the repair and reuse effect on the lifetime which varies from product to product (Baldé et al., 2020). Reuse through repair is a way of extending a product’s first life beyond the point where it has been discarded by its first user. The lifetime includes the time the equipment is used after repair and reuse.
The approach employed for this study involved a general calculation approach using household data as a first step in the development of a lifetime model with consideration for the effect of repair and reuse options which extends the use lifetime in the system boundary Nigeria. The EEE lifetime is a fundamental variable in calculating e-waste generation which is a key objective of this study. Household data obtained through a survey were used to express lifetime distribution function using Weibull distribution (Magalini et al., 2014; Baldé et al., 2015; Wang, 2014; Xianlai et al., 2016).
The household data set focused on the lifetime distributions of five EEE consumers and IT electronics. The lifetime distribution for reuse and non-reuse of the selected EEE were determined from the household survey through the administration of structured questionnaires in 400 randomly selected households in the selected localities. The questionnaire focused on (i) the usage time by consumers before major defects (ii) after repair (iii) how long the EEE was used before final disposal. The survey focused on five EEE types which include desktop computers, TVs, DVD players, laptops and refrigerators.
A system boundary is drawn to clearly define the lifetime to include the repair and reuse options. The inflow and the outflow of EEE in the studied system are presented in Figure 1. The total quantity of EEE in use by the consumer is regarded as the active stock; the age of the products in stock is called the active-stock age. These data were obtained through a consumer survey. The survey results are then used to construct the disposal- after repair and after usage composition and the active-stock age composition. The household assessment was carried out in a preliminary part of this study. The result on lifetime distribution is presented in Table.1 is used to estimate the volume of e-waste with reuse option and non-reuse option. Data on new EEE put on the market (POM) sales data from 1980 to 2020 came from the United Nations University data. The data were calculated by using the “apparent consumption method” which came from internal data based on trade statistics from the United Nations University (Forti et al., 2020). The statistics on sales from the National e-waste registry which forms the POM data does not include data on UEEE import.

Lifetime Model
The lifetime profiles of the selected EEE were modelled using several probability functions. Data from the household survey were used to determine the effect of repair and reuse on lifetime distribution using Weibull distribution (Magalini et al., 2014; Baldé et al., 2015) for the selected EEE products. The Weibull distribution function is considered suitable to relate the ‘discard behavior’ for the EEEs because it exhibits a better data fit characteristic (Wang, 2014; Xianlai et al., 2016) applied similar application in previous scientific literature. The Weibull distribution function is expressed by the time-varying shape parameter α(t) and the scale parameter β(t). The lifetime is categorized into: <1 year, 2 years, 3-4 years, 5-10 years, and > 10 years; while the time repair and re-use added to lifetime were separated into the lifetimes of: < 1 year, 2-3 years, 4-5 years, and > 5 years. These steps were taken to refine the specificity and plausibility of the objective in determining the effect of repair and reuse on lifetime distribution which represents part of the steps in calculating the effect of repair and reuse on e-waste generation.
The lifetime distribution analysis for the collected data from the questionnaires was carried out using STATA software.
Stset (STATA function was used to specify the time-to-failure variable); streg, (?) =?−??? distribution (Weibull time) was used to model each variable using the Weibull distribution.
Steps 1 and 2 estimate the shape and scale parameters in the model.
Step 1 to 3 was carried out for each of the variables for all the EEE.
The average score for each of the variables for all the EEE was computed in order to check the descriptive features of the variables.
St Curve, survive code was input in STATA function to generate the time-to-failure graph using the Weibull distribution calculation of the actual number of years used by the EEE.
Responses to the questions on the duration of use of EEE was on a scale code of 1 to 5 where: code 1 = <1 year; code 2 = 2-4 years; code 3 = 4-6 years; code 4 = 6-10 years; code 5 = 10+ years.
To get the average number of years, let f be the frequency for each duration of the EEE on a scale of 1 to 5, where 1= <1 year and 5 =10+ years.
Let m be the mid-point for each of the durations.Let N be the total number of respondents to the question on the duration of EEE. Then, the average number of years for each EEE before failure is

Weibull distribution function on Excel® was used to determine the average usage times for the five categories of electronics (NEEE), and average extended life with repair/refurbish and re-use. The analysis of household assessment was the first step in the calculation of lifetime. From the household assessment the following details were retrieved:
The lifetime of a NEEE before repair;
The lifetime extension of the equipment in the above scenarios after repair/ refurbishment;
The total lifetime extension with re-use after repair/refurbishment.
The various stock data were fit into the Weibull lifetime distribution functions for determining the lifetime profiles of selected electronic devices for this study.
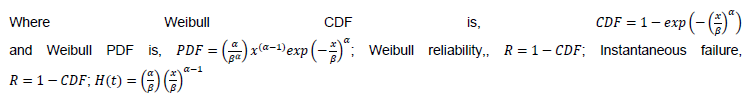
A Weibull function is presented in the Excel® work package to show the cumulative distribution function (CDF) and probability density function (PDF) values. Weibull (X, alpha, beta, true) provides the cumulative distribution function, CDF, at the value of X. Weibull (x, alpha, beta, false) provides the probability density function, PDF, at the value for X.
Data input
The put-on-market data (POM) of new EEE obtained from UNU calculations and lifetime information from households in Nigeria were used to calculate the volume of e-waste predicted to be generated in a given year. The approach adopted in the assessment of EEE flows is presented in Figure 1. This shows a graphical flow of source (import), stock considering the multidirectional flow between household stock and e-waste stock through the effect of repair that encourages reuse of electronics, and how reuse affects the volume and rate of e-waste generation. The calculation for UEEE import is not included in the analysis.
E-waste generation calculations are based on a time series of POM data in the unit and the average lifetime calculation from Nigerian households using the reuse and non-reuse estimate. Stock and lifetime models, combined with time-series stock data with lifetime distributions of products were used to estimate e-waste generation (Binder et al., 2001; Mu?ller et al., 2009; Walk, 2009). The quantity of e-waste produced (in units) from NEEE was calculated from the time-series of POM data and the UNU e-waste data set for Nigeria for the period 1980-2020 (Supplementary Table S2-S3), considering the various rates of obsolescence in the evaluation year n. However, due to scanty reliable import data of UEEE import beforethe year 2015, further calculation of waste generation from imported UEEE was not included in this analysis. The only reliable data for UEEE import into Nigeria were reported by Odeyingbo et al. (2017) who reported that 60,000 - 71,000 tonne/annum of household UEEE such as refrigerator, laptop, desktop computer, CRT TV, DVD player etc. were imported for the year 2015 and 2016 and 2017. See for details of imported UEEE in Odeyingbo et al. (2017).
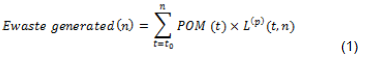
where e-waste generated (n) is the quantity of e-waste generated in evolution year n, POM (t) is the product sales (Put on Market) in all historical years (t) before year n; t0 is the initial year that a product was sold; L((p) (t, n) is the discard-based lifetime profile for the batch of products sold in the historical year t. The approach makes use of quantity (in numbers) of POM of EEE in the year 1980 to 2020 (Supplementary Table S1 using the “apparent consumption method” (equation 2). The POM in a historical year t equals the sum of imports of EEE in the year t minus the EEE exported in the same year (Wang, 2014; Forti et al., 2018). Generally, there is little or no domestic production of EEE in Nigeria.
POM (t) = Imports (t) – Exports (t) (2)
The discarded-based lifetime profile for a product was modelled using the Weibull distribution function i.e. a time-varying shape parameter α(t) and β(t), a scale parameter as
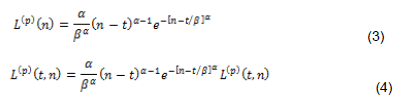
The lifetime, L(p) (t, n), represents the lifetime profile of the EEE product sold in a historical year. This reflects the probable obsolescence rate in evaluation year n. Weibull distribution function was used to describe discard behaviour for the EEE product (Wang, 2014). The data were analysed using the Graphpad Prism® version 6 software package and the area under the curve of the variation in the comparative analysis were obtained (Figure 2). The differences in the quantity of e-waste reduction were used to determine the volume, rate in percentage of transition, and mass of e-waste reduction.
To further compare the e-waste generated data for this study, the mean number of EEE products in the household study was used to calculate the total household stock in Nigeria from 2013 to 2018. This was calculated by multiplying the average number of EEE devices per household and the total number of households in Nigeria reported in the literature (Euromonitor, 2018). Furthermore, sensitivity analysis was carried out with an average margin of error of ±30% based on the uncertainty of the POM forecast and variation in lifespan results.
RESULTS AND DISCUSSION
Lifetime calculation
This study observed that repair and activities have a significant positive influence on the lifetime of a new TV. Most of the respondents in this study (approximately 74%) indicated that faulty electronic equipment could be repaired and reused at least twice before disposal. Hence an increase in the total lifetime was observed for the studies EEE before disposal. The household analysis for the determination of lifetime distribution for EEE without reuse and reuse options show that repair of EEE significantly contributed to improvement in their usage time. For instance, it improves the lifetime of TV from 4 years to about 15 years, desktop PC from 3 to 12, a refrigerator from 4 to 13, DVD players has an average usage time of 3.9 years before requiring any repair, and repair activity extend the lifetime to 13 years. Traditionally, faulty EEE are not quickly discarded in Nigeria because of reuse tradition which is stimulated by cheaper repair cost. Repair and refurbishing activities extend the lifetime of used, damaged or outdated electronics products through the replacement of defective components. Repair activities in Nigeria involve the restoration of the performance and functionality of EEE products through fixing technical faults and restoring them to functional status. Table 1 shows the non-reuse lifetime and total lifetime after reuse profiles for new EEE in Nigeria households; the total average number of years (lifetime) and Weibull lifetime distribution.

The authors’ results showed that repair activity reduces the transformation of EEE to e-waste. Repair and refurbishing activities ensure EEE reach the possible optimal lifetime, while also contributing to sustainable development because of its potential to minimize further emission throughout the lifecycle of EEE and improved the product longevity (Evans and Cooper, 2010). Cooper (2010) also noted that repairing, refurbishing and reusing extend the lifetime of products as the best option in terms of environmental benefits. The higher lifetime of EEE in Nigeria further reflect the real dynamics of repair and reuse in the EEE sector (Table 1).
E-waste generation
Area under curve (AUC) analysis estimates and compares the concentration or quantity of more than one parameter (that is, electronics with or without reuse) in a given period. It measures the total area below the plotted curve of each parameter for the sake of comparison. Therefore, parameters with high AUC have a large total area below their plotted curves.
Consequently, a large total area below the plotted curves of the parameters indicates a large quantitative value of such parameters within the given period. In the present study, AUCs of each electronic device (non-reuse and reuse) between 1981 and 2020 were compared.
For laptops, the AUC of non-reuse (18248) was higher than that of reuse (7504) (Figure 3A), which indicates a larger quantity of non-reuse laptops than reuse laptops between 1981 and 2020. A similar trend was seen for DVD player (reuse: 20425; non-reuse: 44293), TV (reuse: 103261; non-reuse: 147238), refrigerator (reuse: 21633; non-reuse: 42597), and desktop (reuse: 20425; non-reuse: 44293) (Figures 3B-E). This implies that all electronics under non-reuse were larger in quantity than those under reuse. The difference between the quantity under reuse and non-reuse was calculated for each electronic and the AUC of this difference was compared for each electronic. The AUC of the difference between reuse and non-reuse for each electronics is in the following order: television (106087) > DVD player (54098) > desktop (24778) > refrigerator (20965) > laptop (10914). This indicates that television had the largest difference, while laptop had the least difference.
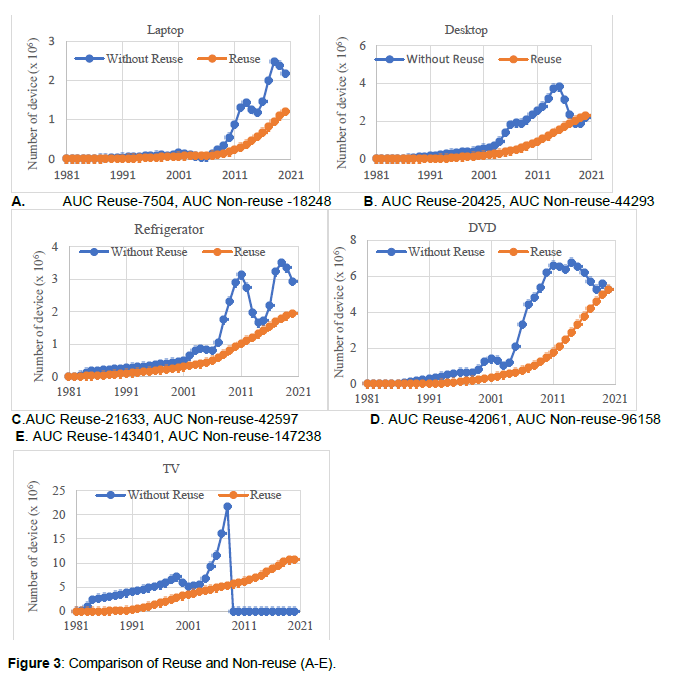
With the explanation on AUC provided above, it is clear from Figure 3E that the total area covered by non-reuse TV was much higher, considering the sharp rise between 1981 and 2011. The total area below this region was much higher than that of the reuse. The reuse only had a higher area coverage than non-reuse from 2011 to 2021, which is a shorter range compared to 1981 to 2011. Therefore, when these ranges were compared, the authors found that the non-reuse had more coverage regardless of its low coverage between 2011 and 2021. The electronic wastes generated between 1981 and 2020 under reuse had an AUC in order of television (143401)>DVD player (42061)>refrigerator (21633)>desktop (20425)>laptop (70504). On the other hand, e-wastes generated under non-reuse is in the order of television (147238)>DVD player (96022)>desktop (44293)>refrigerator (42597)>laptop (18249). From the above, television and laptop were the highest and lowest e-wastes generated from 1981-2020, respectively, both under reuse and non-reuse.
Effect of reuse and non-reuse function on e-waste generation
A comparative analysis between e-waste generation using repair and non-repair effects are presented in Figure 3A to 3E. The quantity in the unit of e-waste generated between the e-waste calculations with the reuse option was subtracted from the e-waste generated calculation without the reuse option. The differences show that around 54 million units of DVD players; 106 million units of CRT TV; 22 million units of the refrigerator; 11 million units of laptops and 24 million units of desktop computers would have been delayed from transiting to the e-waste stream between 1981 to 2020 through reuse options. The data and calculation presented in Figure 3A-3E.indicated that the extension of EEE product life through, repair and reuse have revealed its effectiveness in reducing the generation of WEEE, hence it has tremendous environmental and resource benefits. The advantages of repair and reuse provide alternative means to hold on to electronics devices for longer use time, often for the low-income households, it reduces waste generation, protects the environment and supports household income through employment. In the study area, repair options often reinstate a faulty EEE product to a serviceable /functional condition.
The result obtained in this study corroborates one of the principles of circular economy of keeping products and materials in use by extending the productive life of resources (Blomsma and Brennan, 2017), and retaining resource value (Reike et al., 2018), which arguably has a positive net effect on the environment. It is the opposite of linear economies which are often used and disposed of. The result from this study support restoration of damage EEE leads to a reduction in the transition of EEE to e-waste by deviating from a linear to a circular economy through repair and reuse. The calculation of lifetime and e-waste generation obtained in this study has refined and complemented existing e-waste flow assessment works by integrating lifetime data of EEE with the effect of repair and reuse in Nigerian households. Further calculation presented in Table 2 shows that massive 3,522,333 (t) of CRT TV, 189,838 (t) of DVD player, 358,523 (t) of refrigerator, 98,357 (t) of laptop, and 246,005 (t) of desktop PCs were prevented from transition to e-waste.
Data from 400 randomly selected households in the selected study area shows that an average of 1.6 and 1.7 units of TV and DVD respectively is calculated per household, while 0.7 of desktop, 0.1 of laptop and 0.7 units of refrigerator per household was further calculated.
To further assess the quantity of e-waste generated based on the calculation from Nigerian households, the mean EEE possession in the household was used to calculate the total stock of the researched appliances in Nigeria household by multiplying the average EEE possession with the total number of households in Nigeria from 2013 to 2018. The dataset published by Euromonitor International (2018) was used as a reference for the total household in Nigeria. The calculated data was further used in estimating the total household stock of the selected EEE devices (Table 3). The numbers of households for the periods under consideration are 36.07 M in 2013; 37.17 M in 2014, 38.29 M in 2015, 39.42 in 2016, 40.56 in 2017 and 41.73 M for 2018 using the EEE data possession from the household survey and the total number of households in Nigeria (Table 3).
There is a significant disparity in the calculated household stock data and the calculated stock in pieces using the POM data (Table 4). This further show that UEEE imports are not included in the national statistic hence they cannot be accounted for or traced. This finding shows that calculating the average quantity of appliances per household with the number of EEE in stock from the household survey in Nigeria can be a practical approach to further support the approach which uses calculations based on POM data and lifetimes model. The data reflect that EEE use and e-waste generation is increasing. The transition, however, is proportional to the lifetime of the selected equipment. The comparative analysis of the POM calculation approach and household approach in calculating stocks in the system has given more plausible data on the stock of EEE in Nigeria. It has further improved the lifetime model for developing country under the specific repair, refurbishing and reuse tradition on e-waste to active practical estimates that reflects the real-time situation in Nigeria.
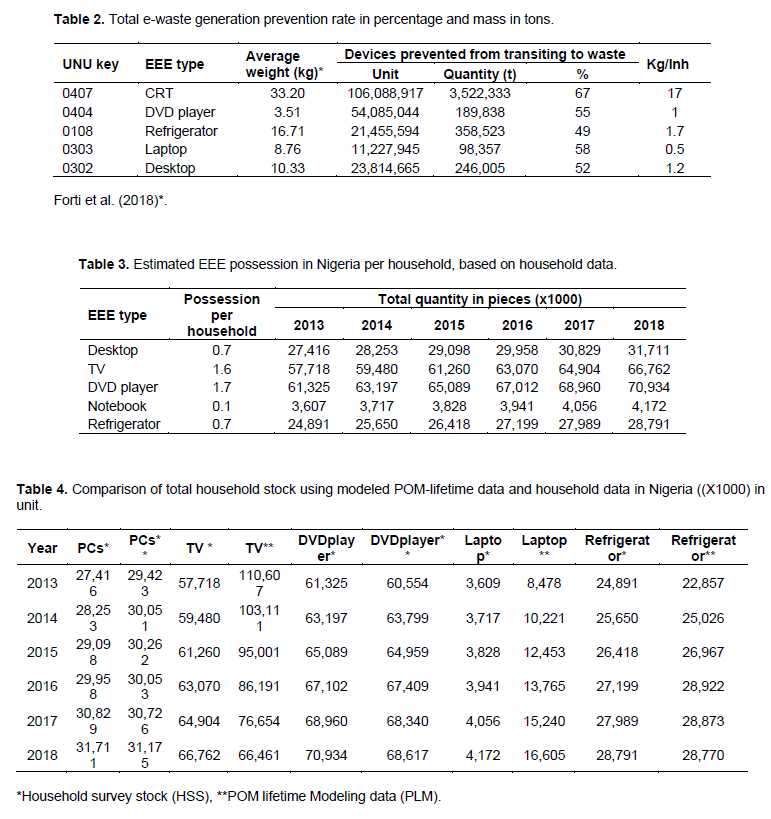
To further validate the amount of e-waste generated a comparative analysis of calculated stock age from POM data presented was compared to the calculated household stock from Nigeria households. Table 4 shows the comparison between the stock data calculated from Nigerian households and the stock data calculated using the POM data. The result for CRT reflects the decline in the production and subsequent importation of CRT TV between the years 2005-2007. This fact has a significant effect on the quantity of e-waste generation. The result further shows that the availability of CRT in households is sustained by the continuous repair, refurbishing and reuse activities which significantly affect the lifetime and high retention in households. For Laptops, the disparity in the household and POM calculation could be connected to the fact that most laptops are used and retained in businesses and offices hence it might not have been captured in the household calculations.
Analysis of the data presented in Table 4 using the Wilcoxon signed ranks test, negative ranks and positive ranks show that there is no significant difference between a desktop computer, DVD player and refrigerator.
The extension of lifetime through repair and reuse is based on the concept of Circular Economy (CE). The circular economy concept in the electronic sector can slow down the rate of EEE consumption by circulating them within the system for the longest possible time and minimizing e-waste generation through smarter product design and business model Parajuly et al. (2017) which integrates repair and reuse possibilities. This can only be achieved through joint efforts across the upstream, midstream and downstream players of the value chain who extend lifetime through maintenance operations (that is, restoration, repair, refurbishment and replacement of defective components to the original as-new condition). Numerous benefits exist in the circular economy approach which includes the creation of employment opportunities, well designed, long-living products through increased maintenance, repaired and refurbishing activities (Ranasinghe and Athapattu, 2020). The result from this study clearly shows that low material circularity in the e-waste sector enhances e-waste generation. A transition towards a circular economy can limit e-waste generation improve resource efficiency, reduce environmental impacts and promote a healthy environment for workers and local communities.
Data uncertainty
Sensitivity analysis (adopting ±30% projections) for each of the electronic devices under the reuse and non-reuse AUCs are presented in the supplementary tables. Data on TV under reuse from 1981 to 2020 was sensitive to ±30% projections (-30%, 140378; normal, 143401; +30%, 146475), whereas television under non-reuse did not fit well for projections (-30%, 193364; normal, 147238; +30%, 194211). In other words, data on television under reuse are well-fitted to make future projections in contrast to those of under non-reuse (Supplementary Figure 1A). For a data model to be well-fitted for future projections, the AUC of the lower boundary must be below the normal value, while that of the upper boundary must be above the normal value. Data on DVD player under Reuse (-30%, 40793; normal, 42061; +30%, 43366) and Non-reuse (-30%, 94601; normal, 96022; +30%, 97663), laptop under reuse (-30%, 7292; normal, 7504; +30%; 7753) and non-reuse (-30%, 17578; normal, 18249; +30%, 18522), refrigerator under reuse (-30%, 21540; normal, 21633; +30%, 22355) and non-reuse (-30%, 41758; normal, 42565; +30%, 43423) (Supplementary Figure. 1A-B); and desktop under reuse (-30%, 20371; normal, 20425; +30%, 20479) and non-reuse (-30%, 43733; normal, 44293, +30%, 44881) were all sensitive to ±30% projections, thus indicating their fitness for future projections.
The authors study has several limitations. The lack of consistent data on UEEE import data to Nigeria limited our calculation for the e-waste generated from UEEE import.
CONCLUSIONS
The lifetime model indicated that repair activities encourage reuse and prevent the generation of e-waste by 67% for cathode-ray television, 55% for DVD players, 49% for refrigerators, 58% for laptops and 52% for desktops on yearly basis. The observation from this study reveals that UEEE import is not declared or undeclared in the import statistics. The lack of consistent data on the importation of UEEE has made the calculation of UEEE transition to e-waste difficult. The availability of reliable data on e-waste generation is a prerequisite to an effective e-waste management system. An effective collaborating system between all the stakeholders in the e-waste management system is required for a successful transition to a sustainable e-waste management system.
The effective collection, management and update of data on e-waste generation can be sustained if national guidance that stipulates the registration, report on the market input and output, the fundamental of the level playing field for operators in the EEE import and manufacturing is strictly adhered to. For instance, the POM data represent a key parameter used in the computational calculation of waste generation. The preservation of consistent datasets such as the National e-waste registry is one of the key instruments for the assessment of entire lifecycle production and distribution through the final recovery and recycling of e-waste.
There is a need for an effective and sustainable data management system for UEEE and EEE imports. A consistent computation of POM data set from the National Bureau of statistics will be necessary to serve as an alternative source of data that can be used to complement or compare the data from the national e-waste registry. The e-waste generation data can be used as a basis for further analysis and how such analysis can be used to make future projections that would serve as a caution for the proliferation of environmentally hazardous substances that emanate from these e-wastes. These steps are important steps for e-waste management in Nigeria. The calculated e-waste generated further highlights the potential business opportunities associated with the huge volume of waste in Nigeria. At the end of multiple uses of electronic appliances and components, there is still a gap that needs to be filled by an effective recycling system in the management of pollutants and e-waste-related hazardous health effects, while also transiting to the attainment of the set United Nations Sustainable Development Goals (SDG). As observed in the study, it is still difficult to estimate and maintain data for the quantity of POM of imported UEEE. Furthermore, the non-availability of data on the quantity of transboundary movements of UEEE and WEEE creates difficulty in addressing issues such as proper estimation of collection and recycling to meet legislative targets. The establishment of trade codes for used appliances will facilitate effective tracking of the imported used electronic appliances.
CONFLICT OF INTERESTS
The authors have not declared any conflicts of interests.
REFERENCES
|
Araujo M, Magrini A, Mahler C, Bilitewski B (2012). A model for estimation of potential generation of waste electrical and electronic equipment in Brazil. Waste Management 32(2):335-342. |
|
|
Balde C, Forti V, Gray V, Kuehr R, Stegmann P ( 2017). The Global E-Waste Monitor: 2015. United Nations University, Institute for the Advanced Study of Sustainability Sustainable Cycles (IAS-SCYCLE), Bonn, Germany. |
|
|
Baldé C, Wagner M, Iattoni G, Kuehr R (2020). In-depth review of the WEEE collection rates and targets in the EU-28, Norway, Switzerland, and Iceland, United Nations University (UNU) / United Nations Institute for Training and Research (UNITAR) - co-hosting the SCYCLE Programme, Bonn, Germany. Accessed date: 9 April 2021. |
|
|
Balde? C, Wang F, Kuehr R, Huisman J (2015). The Global E-Waste Monitor − 2014; United Nations University, IAS − SCYCLE: Bonn, Germany. |
|
|
Binder C, Bader HP, Scheidegger R, Baccini P (2001). Dynamic models for managing durables using a stratified approach: the case of Tunja, Columbia. Ecology Economics 38:191-207. |
|
|
Blomsma F, Brennan G (2017). The emergence of circular economy: a new framing around prolonging resource productivity. Journal of Industrial. Ecology 21:603-614. |
|
|
Cooper T (2010). Policies for Longevity. In T. Cooper(Ed), longer-lasting Products: alternatives to the throwaway society (pp 215- 239). Farnham: Gower Publishing Limited, Farnham, Surrey, England pp. 319-350. |
|
|
Euromonitor International (2018). https://www.euromonitor.com/nigeria Accessed date: 19 May 2020. |
|
|
Evans S, Cooper T (2010). Consumer influences on product life-spans. In T, Cooper (Ed): Longer lasting products. Alternatives to the throwaway society. Gower Publishing Limited: Farnham, Surrey, England pp. 319-350. |
|
|
Forti V, Baldé C, Kuehr R (2018). E-waste Statistics: Guidelines on Classifications, Reporting and Indicators, second edition. United Nations University, ViE - SCYCLE, Bonn, Germany. |
|
|
Forti V, Baldé C, Kuehr R, Bel G (2020). The Global E-waste Monitor: Quantities, flows and the circular economy potential. United Nations University (UNU)/United Nations Institute for Training and Research (UNITAR) - co-hosted SCYCLE Programme, International Telecommunication Union (ITU) & International Solid Waste Association (ISWA), Bonn/Geneva/Rotterdam. |
|
|
Huisman J, Van der Maesen M, Eijsbouts RJ, Wang F, Baldé CP, Wielenga CA (2012). The Dutch WEEE Flows. United Nations University, ISP-SCYCLE, Bonn, Germany 15 p. |
|
|
Imran M, Haydar S, Kim J, Awan M, Bhatti A (2017). E-waste flows, resource recovery and improvement of the legal framework in Pakistan. Resource Conservation. Recycling 125:131-138. |
|
|
Iqbal M, Breivik K, Syed J, Malik R, Li J, Zhang G (2015). Emerging issue of e-waste in Pakistan: a review of status, research needs and data gaps. Environmental Pollution 207:308-318. |
|
|
Magalini F, Feng W, Huisman J, Kuehr R, Baldé K, van Straalen V, Hestin M, Lecerf L, Sayman U, Akpulat O (2014). "Study on collection rates of waste electrical and electrical and electronic equipment (WEEE). Possible measures to be initiated by the commission as required by article 7(4), 7(5), 7(6) and 7(7) of directive 2012/19/EU on waste electrical and electronic equipment (WEEE)". European Commission. |
|
|
Mu?ller E, Schluep M, Widmer R, Gottschalk F, Bo?ni H (2009). Assessment of e-waste flows: a probabilistic approach to quantify e-waste based on world ICT and development indicators. R'09 World Congress, Davos, Switzerland, 2009. |
|
|
Odeyingbo O, Nnorom I, Deubzer O (2017). Person in the Port Project: Assessing Import of Used Electrical and Electronic Equipment into Nigeria. UNU-ViE SCYCLE and BCCC Africa. |
|
|
Parajuly K, Habib K, Liu G (2017). Waste electrical and electronic equipment (WEEE) in Denmark: flows, quantities and management. Resource Conservation Recycling 123:85-92. |
|
|
Parajuly K, Kuehr R, Awasthi A, Fitzpatrick C, Lepawsky J, Smith E, Widmer R, Zeng X (2019). Future E-Waste Scenarios, available: [accessed 20 December 2020]. |
|
|
Pathak P, Srivastava RR (2017). Assessment of legislation and practices for the sustainable management of waste electrical and electronic equipment in India. Renewable Sustainable Energy Review 78:220-232. |
|
|
Ranasinghe W, Athapattu B (2020). Challenges in E-waste management in Sri Lanka, In: Handbook of Electronic Waste Management: International Best Practices and Case Studies. Edited by Prasad, M.N.V., Vithanage, M, and Borthakur, A. Elsevier Inc., pp. 283-322. |
|
|
Reike D, Vermeulen W, Witjes S (2018) .The circular economy: new or Refurbished as CE 3.0? - exploring controversies in the conceptualization of the circular economy through a focus on history and resource value retention options Resource Conservation Recycling 135:246-264. |
|
|
Sajid M, Syed J, Iqbal M, Abbas Z, Hussain I, Baig M (2019). Assessing the generation, recycling and disposal practices of electronic/electrical-waste (E-Waste) from major cities in Pakistan. Waste Management. |
|
|
Step Initiative (2014). Solving the e-waste problem (Step) White Paper, One Global Definition of E-waste. Bonn, United Nations University. |
|
|
USEPA (2011). ORCR, Electronics Waste Management in the United States, 2009- 2011. [accessed 20 December 2020]. |
|
|
Walk W (2009). Forecasting quantities of disused household CRT appliances-a regional case study approach and its application to Baden-Wurttemberg. Waste Management 29(2):945-51. |
|
|
Wang F (2014). E-Waste: collect more treat better. Tracking take-back system performance for eco-efficient electronics recycling. Dissertation, Delft University. |
|
|
Wang F, Huisman J, Stevels AL, Baldé CP (2013). Improving estimation of e-waste generation with advanced Input-Output Analysis. Waste Management 33(11):2397-2407. |
|
|
Xianlai Z, Ruying G, Wei-Qiang C (2016). Uncovering the recycling potential of "new" WEEE in China. Environmental Science and Technology 50(3):1347-1358. |
|
Copyright © 2024 Author(s) retain the copyright of this article.
This article is published under the terms of the Creative Commons Attribution License 4.0


