ABSTRACT
The design of a sustainable waste management system is pivoted on the ability to generate and compute real-time operational data for a strategic developmental decision plan. The real-time waste data generated at the University of Lagos Campus waste management system was used to develop a mathematical model with three operational indicators, namely, Total Cost Indicator (TCI), to show the overall daily cost for managing one metric ton of mixed municipal waste in the system from collection to final disposal, Lost Revenue Indicator (LRI), to show revenue loss for each metric ton of residual waste landfilled, and Material Recovery Indicator (MRI), to show the fraction of recyclable materials recovered from collected mixed waste. All three indicators were calculated at different recyclable materials recovery efficiencies to determine the cost implication on the system’s operational parameters. The model revealed that the present municipal solid waste (MSW) system operates at a recyclables recovery efficiency rate of approximately 3% but can be increased at optimum capacity to 18%. This performance improvement will result in a cost reduction of $0.32/ton when daily sorters’ capacity, material revenue potential and result-based financing recycling operations are determined using this model as a strategic management planning tool. The model provides an adaptable framework for the development of MSW management decision plans for cities in a developing nation.
Key words: Material recovery, municipal solid waste, cost minimization model.
Solid waste generated from most institutions of learning are mainly municipal solid waste comprising largely of household types of waste and excluding industrial, construction, and hazardous waste (Mohsenizadeh, 2020). In terms of human population, infrastructural density, and volume of activities, more universities are now considered as mini cities (Adeniran et al., 2017). According to the Association of University Leaders for a Sustainable Future (ULSF), over 500 colleges and universities are now Talloires declarations signatories on setting examples for environmental responsiveness through the practices of resource conservation, recycling, waste reduction, and environmentally sound operations (Alshuwaikhat et al., 2016). Recent waste characterization studies of over 10 universities around the globe indicated that there are different degrees of material recycling potential in the waste generated that could help improve the universities sustainability indicators (Bahçelioglu et al., 2020; Adeniran et al., 2017; Zen et al., 2016; Smyth et al., 2010).
Sustainable municipal solid waste (MSW) system is measured by three sustainability indicators; economic, environmental, and social aspects. Municipal solid waste management planning must be multifaceted such that it provides for real life environmental, economic and social sustainability (Morrissey and Browne, 2004).
In waste management operational research, cost minimization and financial management are well- established tools used to measure and improve the sustainability of municipal solid waste management systems (Mohsenizadeh et al., 2020). These tools enable decision-makers to assess the positive and negative effects of a set of scenarios by translating all impacts into a common measurement, usually monetary. The unit cost of waste generation, collection, transportation, recycling, recovery, and final recovery and disposal, which are key elements of a municipal solid waste system, influences the overall cost efficiency of the system influence the overall cost efficiency of the system. Hence, the cost calculation of variables must be encompassing to enhance the implementation of MSW management schemes (Paul et al., 2019).
According to Li and Huang (2010), MSW cost minimization concept began with optimization studies in the field of economics. Recent researchers have developed different approaches to achieving cost minimization in MSW. For example, Kijak and Moy (2004) had viewed sustainable waste management cost as a measure of the differential cost between the social and economic impacts of waste generated across different geographical levels. They opined that increased cost commitment to environmental awareness, public concerns, and appropriate legislation for sustainable management will influence the economy and efficiency of MSW systems. A bi-objective minimization cost model with emission control and recyclable potential as dependent variables was deployed on two big cities of Ankara, Turkey and Kolkata city, India, (Mohsenizadeh et al., 2020; Paul et al., 2019).
Cost minimization models tend to provide a guide to systemic adoption of municipal solid waste management systems featuring the lowest cost, barest minimum options for technologies and aided legislations which drive the social and environmental sustainability components (Paul et al., 2019). In most developing countries like Nigeria, poor MSW data management had hindered the use of cost minimization models to improve MSW plans. Municipal solid waste management introduces a major cost for municipal authorities, sometimes even accounting for up to 50% of government budgets for cities (Aleluia and Ferrão, 2017). The incidence of such significant impact on expenditure has driven an affinity for cost-cutting measures among key stakeholders, including policy makers, urban planners and practitioners of municipal solid waste management. These stakeholders often adopt and implement features of mature, foreign systems from developed nations without accounting for differences in socio-economic, technological, and environmental factors which could negatively influence the performance of municipal solid waste management systems (Khatib, 2011). An appropriate modification of foreign system models on a case-by-case basis had not also been successful due to paucity of data or data variations occasioned by inconsistence in MSW operational systems in developing countries (Khatib, 2011).
Development of suitable waste management systems within developing nations requires a well-studied waste system protocol operating steadily within the same economic and environmental conditions. The universities waste system could provide a pilot case study of MSW system which could be scaled up for a large city system. For example, Popescu et al. (2016) had used the waste management evaluation at University of Oradea, Romania to develop the Oradea’s city waste management smart plan. This present study intends to fill a major knowledge gap in the development of MSW minimization cost models suitable for tertiary institutions which is adaptable to cities in developing countries especially in sub-Saharan Africa. To the best of our knowledge there is no published report on this subject for any tertiary institution in the developing countries. The research reported here, developed a mathematical cost-minimization and optimization model using a real time operational data generated at the University of Lagos with the view to determining the strategic decisions needed to make recovery of recyclables on campus more sustainable.
Study location overview
The University of Lagos campus is located at the heart of Nigeria’s economy central district in Lagos on longitude 6.5151°N and latitude, 3.3886°E. It is one of the largest city campus tertiary institutions in West Africa hosting a day-population of about 87,000 people comprising staff, students, large traffic of external visitors and service-providers. The campus covers an estimated 561 hectares of land and hosts 12 academic faculties, 330 staff housing units, 15 students’ hostels, as well as administrative and academic buildings. During the academic session, the campus is estimated to have a resident population of 25% of enrolled students population and 10% of staff (Adeniran et al., 2017, 2019).
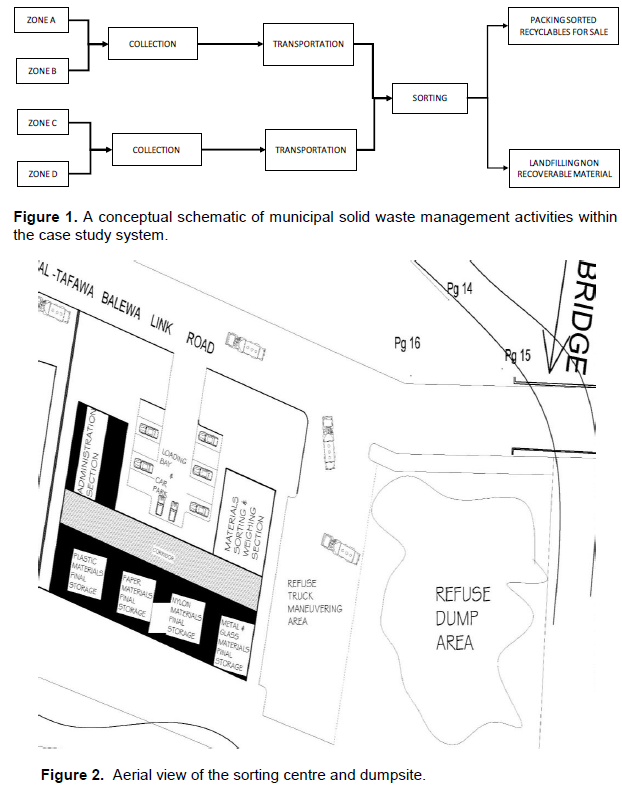
This research is designed to enable the University make important decisions on optimizing its recycling and sustainable waste management system having embraced recycling for over four years. The daily operational data on waste management hosted at the University’s Department of Works and Physical Planning was sourced, reviewed and computed. Previous work by Adeniran et al. (2017) provided a detailed design of the campus’ MSW system, wastes generation and characterization within the University of Lagos, Akoka campus. These data provided the needed information for the purpose of a material flow analysis of the municipal solid waste within a defined system (the University of Lagos, Akoka campus). The derived material flow analysis forms the precursor to a mathematical model, and the consequent optimization of municipal solid waste management within the system. The schematic in Figure 1 shows a representation of material flow in the municipal solid waste management facility in this study.
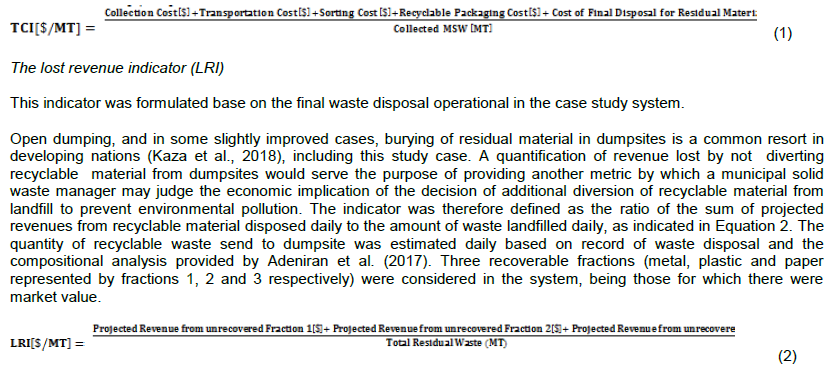
The case study features a simple system, in which mixed municipal waste is collected from designated points around the campus by waste trucks and transported to a central sorting centre, where recyclables are removed for sale and residual non-recoverable materials are buried at a dumpsite situated within the premises of the sorting centre. Figure 2 is an aerial view of the sorting centre and dumpsite.
The waste material flow paths used in developing the model variables is as presented in Figure 1. The cost implications for each system component were determined from waste generation point to disposal for the operational period of January 2015 to December, 2019. The factors were then grouped into their respective areas of influence for each indicator (Total Cost Indicator (TCI), Lost Revenue Indicator (LRI) and Material Recovery Indicator (MRI)) to generate corresponding mathematical derivatives. The component indicator factors were modified using design factors by Rigamonti et al. (2016) for the modelling of integrated solid waste management in Lombardia (a region in Italy) while USEPA Full Cost Accounting for Municipal Solid Waste Management, (USEPA,1997) was used to determine the cost pathways within the system. The USEPA had identified four primary solid waste management cost pathways for collected MSW management as: Recycling, Composting, Waste-to- Energy and Land disposal. In this study, only recycling and landfill are operational. Unlike Rigamonti et al. (2016) proposed, indicators that use a composite aggregation of three indicators (material recycling indicator, energy recovery indicator and operational cost indicator) might complicate the ability of the municipal solid waste manager to appreciate the contribution and effect of each independent indicator. In this work however, each indicator was determined based on each activity’s contribution to environmental sustainability by means of material recovery (Material Recovery Indicator), activities related to general waste collection and disposal in the system (Total Cost Indicator) and activities that affect material disposed on the dumpsite (Lost Revenue Indicator). In all the indicators, the waste material flows, that is the individual recyclable materials with recycling market potential were determined. The quantity and cost of the recyclables were set to be the major decision points for municipal solid waste management in this system under study. This was done to allow the municipal solid waste authority compare economic implications of running the system at various points of recyclables recovery efficiency.
The recyclable waste materials in the system were broadly grouped into three - Metals, Plastics and Papers. The metals consisted largely of cans and packaging containers. All polymeric materials (PET, HPDE, PP, plastic bottles, packaging bags and broken chairs) were grouped as plastics, while papers consisted of cartons, prints and plain papers. The full waste characterization and market potentials of the recyclable waste had been reported by Adeniran et al. (2017).
Model optimization
The optimization framework was designed to determine the operational variables cost needed to attain desired recyclable materials recovery efficiency values for the waste management system. The Optimum recovery point of the waste management system was defined as the equilibrium recovery efficiency value for the quantity and potential revenue achieved through sorting of recyclable waste per the total unit economic cost of operating the waste management system. Recovery of recyclable waste was set as the overall optimization objective being the only waste pollution prevention treatment used in the system. The model constraints for the process validation were developed using factors that influence manual recovery of recyclable waste within the system.
The indicators and their relevance
The total cost indicator (TCI)
This indicator was considered relevant to the case study system as a means of monitoring the relationship between overall municipal solid waste management cost and the amount of waste generated and collected in the system on a daily basis, thus constituting a measure of economic sustainability of the system. The indicator is intended to reflect actual management costs as obtained from full cost accounting of the system using USEPA Full Cost Accounting for Municipal Solid Waste Management (USEPA, 1997) grouping as a guide.
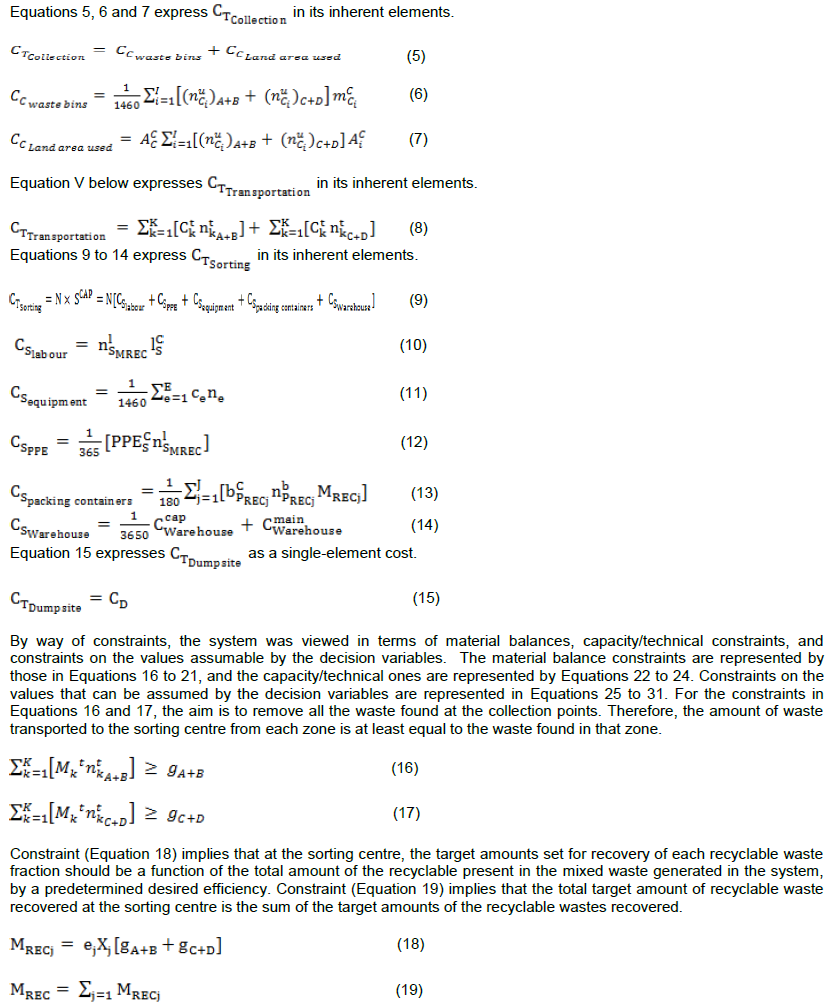
The indicator was determined according to Equation 1:
The indicator was formulated to measure lost revenue as opposed to lost profit because the system in question is not for-profit. This would aid decision making for cost/benefit analysis in the waste management system.
The material recovery indicator (MRI)
This indicator was considered as a means of measuring the material recovery implication to the waste management system on campus. It is a measure of the environmental sustainability in the system.
The indicator will enable the solid waste manager develop strategic decisions on improving material recovery for environmental sustainability.
The indicator was defined as the ratio of the quantity of recyclables diverted daily from the dumpsite by recovery to the amount of municipal solid waste collected daily, and it was determined according to Equation 3:
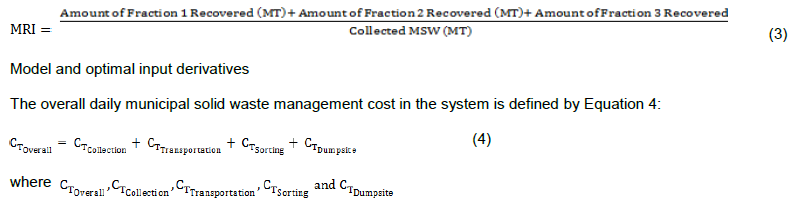
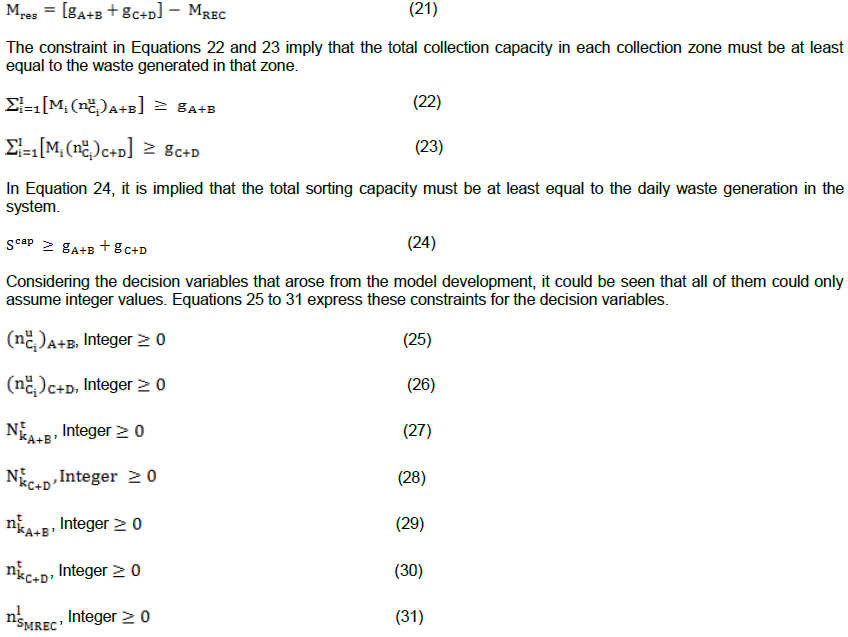
represent overall daily municipal solid waste management cost in the system. Total daily cost for the collection of an average of 32.2 tons of waste included the cost of 611 (360 L) and 252 (240 L) waste bins used for waste collection at the generation points on campus. The cost of employing three waste truck personnel - a driver and the two workers who transfer the waste from the waste bins to the waste truck were put at the equivalent daily rate of the minimum wage of $46.2 per month for each person. The cost of waste transportation via waste truck to the central sorting facility and the average tipping rate was determined based on the waste trucks historical operational cost analysis for the last four years. Budgetary allocation for daily operation of the waste truck and its fuel consumption rate were analyzed and the average rate per day determined. The total daily cost of sorting out desired recyclables from the general mixed waste was determined as the average daily remuneration received by the manual sorters working at the sorting centre along with the cost of required Personal Protective Equipment (PPE) and the cost of packaging material for the estimated recovered waste.
The total daily cost of operating and maintaining the dumpsite was determined as cumulative average of expenses incurred on building maintenance, fumigating, clearing, layer covering, and compacting of the dumpsite based on depreciation cost value of assets and average cost of service component.
All costs are expressed in terms of daily equivalents. The cost values of each variable are provided in the supplementary data.
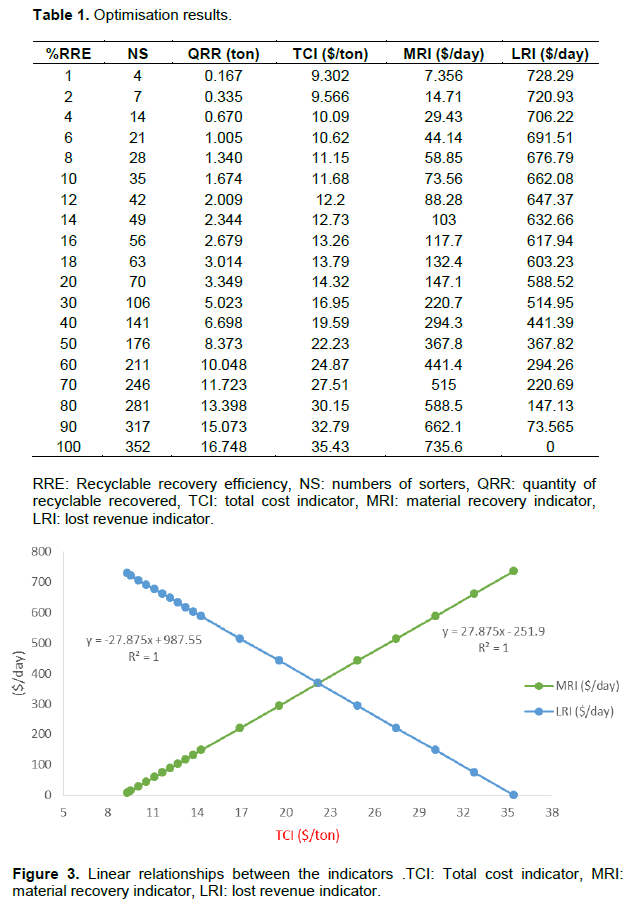
Equation 4 was solved as a single objective, multivariable, constrained, linear integer programming optimization problem to minimize the objective function subject to the constraints described in Equations 15 to 21, using MATLAB 9.4 software. These results, alongside the computations for the three indicators used in this work, are shown as Optimization results in Table 1. The results and computations were obtained for recovery efficiencies ranging from 1 to 100%.
From Table 1, a linear negative LRI vs. TCI relationship and a linear positive MRI vs. TCI relationship were observed. Figure 3 presents the linear relationships between the indicators. The graphical variation of MRI, LRI, and NS with Recyclables Recovery Efficiency is provided in the supplementary data.
The model generated a marginal revenue of $14.7 day-1 and $73.6 day-1 for LRI and MRI at every 2 and 10% increase in the recovery efficiency, respectively, while the TCI was observed to gain $0.5 /ton and $2.6 /ton at the set incremental recovery efficiency of 2 and 10%, respectively.
To determine the percentage recovery with optimum material recovery in the present operational system, the number of sorters and the work space which are the major factors to recyclables material recovery in the system under review was inspected. Comparing the available work space for waste sorting of 353.5 m2 on campus with the minimum required sorting area of 5.6 m2/per person reported by Nishtala and Solano (1997), the model indicated that the space is ideal only for 64 sorters. Inferring from the model, the present recycling system can only achieve 18% recovery of recyclable materials at optimum performance.
The result indicated that at 18% recyclable materials recovery efficiency, the waste management recovery operations will provide the optimum result in which the volume of material recovery is economically and environmentally viable.
This result provides a major strategic information for the waste management manager on the potential and limitation in recyclable materials recovery capacity of the present waste management system. Although the campus sorting program is operating below 4% material recovery, this can be driven to a higher capacity by increasing the manpower for segregation of additional 14% recyclable materials but the present recycling system will require a review to avert the huge recyclable revenue loss of $603.2/day from being disposed to the dumpsite at beyond 18% material recovery threshold.
A possible path to ensuring a better recovery of recyclable materials within 18% recovery efficiency is to drive the sorters’ average daily output upward. Table 2 presents the model parameters projections for a 10, 15 and 20% increase in the per day average output of 0.048tons per sorter.
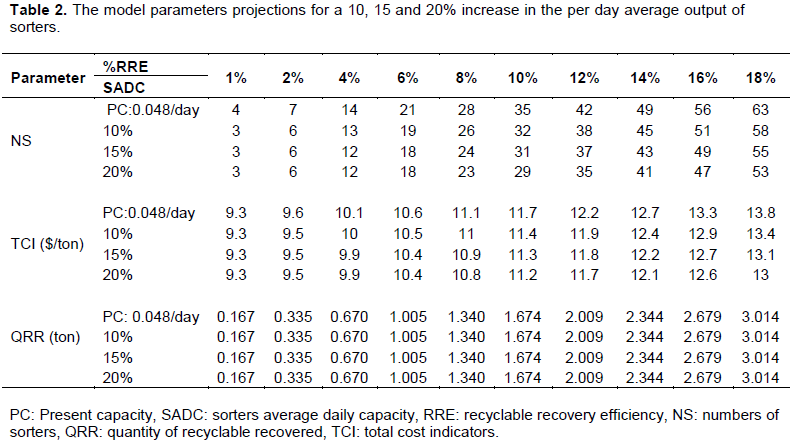
The model’s result indicated that increasing the daily sorting capacity of sorters could improve the economic viability of the system through the reduction in the number of sorters and associated cost required to attain the desired recovery efficiency. At 18% recyclables recovery efficiency, the number of required sorters decreased from 63 to 53 as the daily output of sorters was increased by 20%. This implies a 16% decrease in the workforce needed to achieve the same recovery efficiency and 6% drop in TCI as the sorters’ average daily capacity was increased by 20%. The present average daily sorting capacity of sorters (0.048 ton/day) was 48% lower than the reported average daily sorting capacity of sorters (0.092 ton/day) of 12 manual waste recovery centres in Brazil (Campos, 2014). This further strengthens the need to focus on improving sorters daily output as a decision plan for cost minimization in this case study.
Operational conditions and employee job satisfaction had been identified as key factors that affect employment in the waste management sector (ILO, 2013). Provision of stock bay close to the sorting zone, spaced waste truck offloading intervals, essential health and safety facilities and performance incentives for sorters are possible tools that could help improve sorters daily performance.
Material revenue indicator (MRI)
Three factors are responsible for the revenue generation from recovered recyclable materials namely, the quantity, quality and selling price of recyclables (Bel and Gradus, 2016). The prices for each type of recyclable fluctuate based on market activities and quality of recyclables. For this study, an average historical sales rate over four years was determined for each class of recyclable material as $133/ton for metals and $38.4/tons for both papers and plastics. Bel and Gradus (2016) had opined that price elasticity of recyclable waste can be explained by the use of a weight-based system and by the pricing of composite waste.
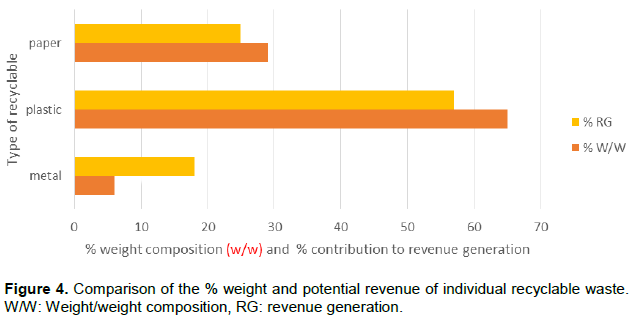
To understand the impact of each recyclable material on the recovery capacity of the system, the contribution of each recyclable to the weight and price value was investigated. Figure 4 shows a comparison of the percentage weight and revenue implications of each type of recyclable waste on the total materials recovered.
Majority of the recyclable materials recovered were plastics representing 65% of the total recyclable materials recovered, while papers and metals constituted 29% and 6%, respectively. The potential revenue generation from the recovered materials was 57, 25 and 18% for plastics, papers and metals respectively. A revenue to weight ratio analysis was deployed using SPSS to determine the recyclables material recovery contribution to revenue generation. The ratio analysis indicated that there was significant statistical difference in the contribution of plastics, papers and metals in the order 1:1:3.
This result provides a major guidance on the possible planning of recyclables material recovery for environmental and economic gain. Focusing on source reduction of papers and plastics and optimization of metals recovery could help make the recyclables recovery system more sustainable. This could increase the market value of each kilogram of recyclable material recovered while reducing the volume of recyclables that will be disposed at the dumpsite. Athanassiou and Zabaniotou (2008) noted that the economic sustainability of both manual and automated sorting plants largely depends on the quality and the revenue generated from the sales of recyclable waste. The University may deliberately encourage the use of canned drinks on campus as an alternative to plastic bottled drinks.
Total cost indicator (TCI)
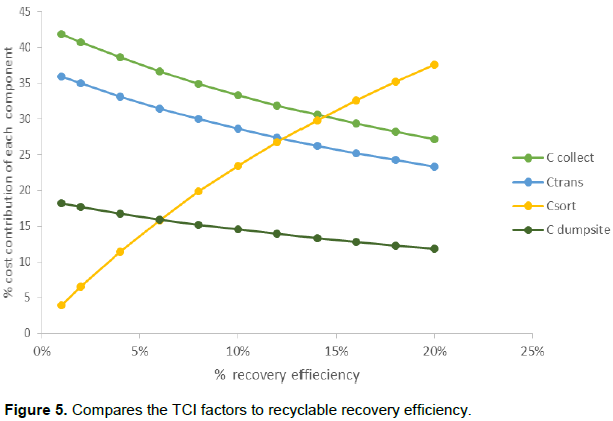
The optimization model indicated that there was an increase in the cost of waste management associated with increasing recycling activities on campus. As material recovery efficiency of recyclable material increased from 2 to 18%, the total unit cost of waste management grew from $9.6 to $13.8 /ton. The major contributor to the differential total cost could be associated with additional cost incurred on wages and purchase of PPE for more sorters employed for recyclable materials. Figure 5 presents a comparison of the TCI factors to recyclables recovery efficiency. The total revenue from the sales of recovered recyclable waste is expected to grow by 800% from $14.7/ to $132.4 /day within the same percentage recyclables material recovery efficiency of 2 to 18%. By this, revenue generated from recovery of recyclable materials could reduce the daily total cost of waste management in the system by 2.3% at 2% material recovery and 29.8% at 18% material recovery.
The result indicated that the present system could be economically viable if adequate human and material capital is allocated to recyclables material recovery area of the waste management system.
The total unit cost of waste management in the system of $9.6 to $13.8 /ton still falls within the projected waste management cost for landfill disposal of $8 to15 /ton by the World Bank (Kaza et al., 2018) for developing countries indicating that the waste management system could be maintained within acceptable cost range with commensurate recyclables recovery.
Lost revenue indicator (LRI)
The model indicated that even at the optimum 18% recyclables recovery efficiency of the present system, about 78% of potential revenue from recyclable materials was lost to the dumpsite. This obviously will necessitate a review of the recyclables recovery system to ensure better material recovery. Upgrading the present manual sorting centre to a semi mechanized or fully mechanized system could drive a higher recyclables recovery efficiency. Introduction of rotation conveyor machines could reduce the projected number of sorters by half with increased recyclables recovery. A semi mechanized recyclables recovery system has the capacity to recover an average of 6 to 9 tons/day of recyclable materials (Campos, 2014; Gundupalli et al., 2017).
Based on the present model, a semi mechanized recyclable system could improve the waste system’s recyclables recovery efficiency to 60%. The techno- economic analysis of recyclables recovery processes by Athanassiou and Zabaniotou (2008) had noted that regardless of the level of automation, investment into the mechanization of recycling systems is often attractive and profitable. The present model provides a guide on the level of investment viable for the system in terms of the differential between the LRI and the TCI. However, a fully automated recyclables recovery system may be needed to attain 100% recyclable materials recovery.
Adapting this cost minimization model for cities could help provide waste authorities with the essential information needed for optimum resource allocation for sustainable recyclables recovery system. These research findings provide the waste managers and stakeholders with measurable and attainable goals by which the recycling system can be driven to sustainability.
This research work undertook a mathematical cost minimization modelling and optimization studies using real-time data generated from a municipal solid waste management system of a tertiary institution in Nigeria. It aimed to improve the essential decision support metrics for a sustainable developmental plan on waste recycling systems. Three novel indicators were identified based on operational activities that contributed to the economic and environmental sustainability; Total Cost Indicator (TCI), Material Recovery Indicator (MRI), and Lost Revenue Indicator (LRI).
The model revealed that the present MSW system on campus at optimum capacity can only attain 18% recyclable materials recovery of all recyclables generated considering the economic and environmental viability of the system. The limiting operational parameters (number of sorters and available space) validated the result that beyond the 18% optimal point, the recyclables material recovery system will not be operationally viable. However, the system’s recyclables recovery performance can be improved upon and the daily TCI of $9.3 ton-1 can be reduced by $0.32/ ton-1 (3.4%) if the daily sorter capacity is increased by 20% through improved working conditions for sorters.
Metals and cans provide three times higher revenue ratio by weight than plastics and papers which could increase the daily revenue generation by 45% for every 10% increase in weight composition of metals.
In order to avert about 78% of potential revenue from recyclable materials being lost to the dumpsite, after optimization of the present system, an upgrading of the present manual sorting centre to a semi mechanized or fully mechanized one will be required to achieve the University’s sustainability dream of above 75% recyclable waste recovery.
This study provided an overview of the present system’s performance and also a framework for structural development plan to ensure an overall economic and environmental sustainability of MSW for tertiary institutions and cities with similar operational parameters. Major prices change in the recyclables, hence: the cost of key operational parameters like transportation during the lifetime of the waste management facility may be a major limitation to the model preferred outcomes. Further research, will be to adopt a scoping study on a part of the city towards the implementation of cost minimization study findings.
The authors have not declared any conflict of interests.
REFERENCES
|
Adeniran AE, Nubi AT, Adelopo AO (2017). Solid Waste Generation and Characterization in the University of Lagos for a Sustainable Waste Management. Waste Management 67:3-10.
Crossref
|
|
|
|
Aleluia J, Ferrão P (2017). Assessing the costs of municipal solid waste treatment technologies in developing Asian. Waste Management 69:592-608.
Crossref
|
|
|
|
|
Alshuwaikhat HM, Adenle YA, Saghir B (2016). Sustainability Assessment of Higher Education Institutions in Saudi Arabia. Sustainability 8(750):1-12.
Crossref
|
|
|
|
|
Athanassiou M, Zabaniotou A (2008). Techno-economic assessment of recycling practices of municipal solid wastes in Cyprus. Journal of Cleaner Production 16(14):1474-1483.
Crossref
|
|
|
|
|
Bahçelioglu E, Bugdaycı ES, Dogan NB, Simsek N, Kaya SO, Alp E (2020). Integrated solid waste management strategy of a large campus: A comprehensive study on METU campus, Turkey. Journal of Cleaner Production 265:121715.
Crossref
|
|
|
|
|
Bel G, Gradus R (2016). Effects of unit-based pricing on household waste collection demand: A meta-regression analysis. Resource and Energy Economics 44:169-182.
Crossref
|
|
|
|
|
Campos HKT (2014). Recycling in Brazil: Challenges and prospects. Resources, Conservation and Recycling 85:130-138.
Crossref
|
|
|
|
|
Gundupalli SP, Hait S, Thakur A (2017). A review on automated sorting of source-separated municipal solid waste for recycling. Waste Management 60:56-74.
Crossref
|
|
|
|
|
International Labour organization (ILO) (2013). International Labour organization Decent Work In Waste Management. ILO Publications, International Labour Office, CH-1211 Geneva 22, Switzerland.
|
|
|
|
|
Kaza SY, Lisa C, Bhada-Tata P, Van Woerden F (2018). What a Waste 2.0 : a Global Snapshot of Solid Waste Management to 2050 (Urban Development Series Knowledge Papers) World Bank (2018).
Crossref
|
|
|
|
|
Khatib IA (2011). Municipal solid waste management in developing countries: Future challenges and possible opportunities. In: Kumar, S. (Ed.), Integrated Waste Management - Volume II.
|
|
|
|
|
Kijak R, Moy D (2004). A decision support framework for sustainable waste management. Journal of Industrial Ecology 8(3):33-50.
Crossref
|
|
|
|
|
Li Y, Huang G (2010). An interval-based possibilistic programming method for waste management with cost minimization and environmental-impact abatement under uncertainty. Science of the Total Environment 408:4296-4308.
Crossref
|
|
|
|
|
Mohsenizadeh M, Tural MK, Kentel E (2020). Municipal solid waste management with cost minimization and emission control objectives: A case study of Ankara. Sustainable Cities and Society 5:101807.
Crossref
|
|
|
|
|
Morrissey AJ, Browne J (2004). Waste Management Models and their Application to Sustainable Waste Management. Waste Management 3(24):297-308.
Crossref
|
|
|
|
|
Nishtala SR, Solano E (1997). Description of the material recovery facilities process model: design, cost, and lifecycle inventory. Internal Rep. Dept. of Civil Engineering, North Carolina State University, Raleigh, N.C, USA.
|
|
|
|
|
Paul K, Chattopadhyay S, Dutta A, Krishna AP, Ray S (2019). A Comprehensive Optimization Model for Integrated Solid Waste Management System: A Case Study. Korean Society of Environmental Engineers, Environmental Engineering Research 24(2):220-237.
Crossref
|
|
|
|
|
Popescu DE, Bungau C, Prada M, Domuta C, Bungau S, Tit DM (2016). Waste management strategy at a public University in smart city context. Journal of environmental protection and ecology 17(3):1011-1020.
|
|
|
|
|
Rigamonti L, Irene S, Mario G (2016). Integrated municipal waste management systems: An indicator to assess their environmental and economic sustainability. Ecological Indicators 60:1-7.
Crossref
|
|
|
|
|
Smyth DP, Fredeen AL, Booth AL (2010). Reducing solid waste in higher education: the first step towards 'greening' a University campus. Resource Conservation Recycling 54:1007-1016.
Crossref
|
|
|
|
|
United States Environmental Protection Agency (USEPA) (1997) Full cost accounting for municipal solid waste management: a handbook. EPA Report No 530-R-95-041. United States Environmental Protection Agency, Washington, DC.
|
|
|
|
|
Zen IS, Subramaniam D, Sulaiman H, Saleh AL, Omar W, Salim MR (2016). Institutionalize waste minimization governance towards campus sustainability: a case study of Green Office initiatives in Universiti Teknologi Malaysia. Journal Cleaner Production 135:1407-1422.
Crossref
|
|