Full Length Research Paper

ABSTRACT
Mechanisms of the interannual variability of upwelling onset dates on the Petite-Cote of Senegal are investigated using daily NEMO model data outputs and NOAA ocean surface temperature observations (OISST). We first determined the phenology (onset dates, end dates, duration and occupied area of the upwelling) over the Petite-Côte located in south of the Senegalese coast. Our results show that upwelling in the Petite-Côte starts on average on 03-December (with a standard deviation of 13 days) and ends on average on 13-June (with a standard deviation of 11 days). Upwelling lasts, on average, 6 months in the region. The maximum upwelling intensity is noted on 15-May and the maximum occupied area exhibits a February-May plateau. We then performed a composite analysis based on the earliness of the upwelling setup dates to understand the mechanisms involved. Our results show that for the earliest upwelling years, we note a strengthening of the vertical velocities 3 weeks before the onset of the upwelling but we note especially an abnormal intensification of the coastal jet. The latter seems to be the initiator of the early onset of the upwelling in the region. These reinforcements are associated with a significant decrease in surface temperature (SST) and an intensification of northerly trade winds.
Key words: Upwelling, phenology, Senegalese coast, petite-côte.
INTRODUCTION
The Senegalese upwelling is the southern part of the Canary Islands upwelling system, which is one of the four major upwelling systems in the world, along with the Benguela in South Africa, California in North America and Peru-Chile (Humboldt) in South America. It consists of an upwelling of deep water towards the surface. Despite a relatively small surface area, less than 1% of the ocean surface, these regions are known for their intense biological productivity. This richness is mainly due to the trade winds that blow parallel to the coast, generating coastal upwelling (Rebert, 1978; Roy, 1989). Coastal and off-shore upwelling result from these northeasterly winds, which drive a zonal Ekman transport under the action of the Coriolis force (Jacox et al., 2018). This transport is indeed divergent, particularly strong at the coast, but also in the ocean interior over a distance depending on latitude (Faye et al., 2015). Mass balance requires compensation by an upward vertical transport of cold and nutrient-rich waters, which favors the phytoplankton growth (Herbland and Voituriez 1974; Huntsman and Barber, 1977; Bricaud et al., 1987; Van Camp et al., 1991). Indeed, the trade winds are the driving force behind the permanent or seasonal upwellings that develop along the West African coastline, from Morocco to Senegal via Mauritania. The northern trade winds push the waters offshore. According to mass conservation, a vertical flow compensates for this imbalance and brings nutrient-rich deep cold water to the surface. The West African upwelling is very particular (Lathuilière, 2008); among the 4 major upwelling systems, it is probably the less studied. After a major effort in the 1970s, this region has been little studied until fairly recently. Furthermore, the inter-comparison of the 4 upwelling systems shows that the West African Coastal Upwelling is the one that presents both the greatest seasonal variability and the greatest diversity of behavior along the coast. However, the phenology of this system (start date, end date, duration, occupied surface) as well as the behavior of physical parameters before, during and after an upwelling event remain to be studied in depth, especially with data from numerical models that allow a process study. In addition, over the last thirty years, the atmospheric circulation over the tropical Atlantic and the African continent has undergone profound changes, one of the most spectacular consequences was the drought that hit the Sahelian zone from the 1970s (Roy, 1989). These changes can have a significant impact on the marine ecosystem and require a great deal of understanding. This study focuses on the analysis of physical oceanic and atmospheric parameters that initiate the upwelling from the regional circulation model (NEMO) and is part of the general problem of understanding the Senegalese upwelling (especially in the southern part commonly called the Petite Côte, PC) in terms of phenology, variation of basic upwelling parameters (SST, Wind, Currents, Mixing layer, Thermocline) and the effect of possible changes in atmospheric circulation on this part of the Canary Islands system.
Fishing is the main activity of coastal populations. However, the fishing activity depends intrinsically on the intensity of the upwelling (in terms of surface occupied, duration, etc.). In recent years, the fishing activity has decreased dramatically (fishermen often return with low catches) and has important socio-economic consequences (Merem et al., 2019). In the perspective of a good management of the resource and its control, it is important to understand the functioning of the upwelling. In other words, this study will make it possible to understand the inter-annual variability of the Senegalese upwelling in order to be able to prevent possible events of intensification and/or relaxation of the upwelling which is very important for predictability. In this study, we propose to study the following two main questions:
(i) What is on average the duration, the area occupied, the start date, the end date of upwelling in the Petite-Côte?
(ii) What are the physical oceanic and atmospheric parameters that govern the early initiation of upwelling in the Petite-Côte?
DATA AND METHODS
Observation
We used the Optimium Interpolation Sea Surface Temperature V2.0 (OISST) ¼° data which can be downloaded at https://psl.noaa.gov/data/gridded/data.noaa.oisst.v2.highres.html. OISST is a daily product of National Oceanic Atmosphere Administration (NOAA); it is an analysis constructed by combining observations from different platforms (satellites, ships, buoys, and Argo floats) on a regular global grid. A spatially complete SST map is produced by interpolation to fill in the gaps. The methodology includes bias adjustment of satellite and ship observations (referenced to buoys) to compensate for platform differences and sensor biases.
There are two types of daily OISSTs, named after the relevant SST satellite sensors. These are the Advanced Very High-Resolution Radiometer (AVHRR) and the Advanced Microwave Scanning Radiometer on the Earth Observing System (AMSR-E). The AVHRR has the longest record (late 1981 to present) of SST measurements from a single sensor design. Infrared instruments, such as AVHRR, can make observations at relatively high resolution but cannot see through clouds. Microwave instruments such as the AMSR-E can measure SST in most weather conditions (with the exception of heavy rain) but not near land.
ATLTROP025 model interannual simulation
We use also the Nucleus for European Modelling of Ocean (NEMO) model with version 3.6 in this study. It is a general circulation model which, like all OGCMs, tries to solve the primitive Navier-Stokes equations. NEMO was born as part of the new version of Océan PAraléllisé (OPA), (Madec et al., 1998) for ocean dynamics and thermodynamics, Louvain-la-neuve Ice Model (LIM) for atmospheric dynamics and thermodynamics and Tracer in the Ocean Paradigm (TOP) for biogeochemistry (Madec, 2008, 2014). It is then intended to be a flexible tool to study over a wide spatio-temporal spectrum the ocean and its interactions with the other components of the terrestrial climate system (atmosphere, sea ice, biogeochemical tracers etc...). The prognostic variables are the three-dimensional velocity field (u, v, w), sea surface height (linear or not), temperature and salinity. The distribution of the variables is done on a three-dimensional Arakawa C-grid using a vertical z-coordinate (with integer or partial levels), or an s-coordinate (which takes into account the topography), or a combination of both.
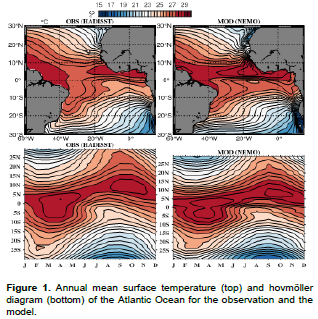
The outputs used in this study are daily and cover the period 1990-2015. The regional grid of 1/4° horizontal resolution encompasses the tropical Atlantic (35°S - 35°N, 100°W - 15°E). It has 75 irregular levels on the vertical, 12 levels in the upper 20 m and 24 levels in the first 100 m. This configuration has already been described in detail in Hernandez et al. (2016), a study in which it is shown that the NEMO v3.6 model successfully reproduces the mean state of the tropical Atlantic and sea surface cooling following tropical storms and hurricanes west of the region. Beyond the validation done by Hernandez et al. (2016), we compared the mean state of the NEMO model data with that of the OISST observations. We clearly see that the model is able to reproduce the mean state of the tropical Atlantic (Figure 1).
Lateral boundaries are forced with daily outputs from the MERCATOR GLORYS2V3 global reanalysis. Details of the method are given in Madec (2014). At the surface, atmospheric fluxes of momentum, heat, and freshwater are provided by bulk formulas (Large and Yeager, 2009). The model is forced with the DFS5.2 product (Dussin et al., 2014) which is based on the ERA-interim reanalysis (Dee et al., 2011) and consists of 3 h fields of wind speed, temperature, atmospheric humidity, daily longwave, shortwave and precipitation fields.
The model reference experiment is initialized with temperature and salinity climatology provided by World Ocean Atlas (WOA98) from Levitus et al. (1998) and is integrated over the period 1979-2012. For more information, the reader can use the following address http://www.nemo-ocean.eu.
Methodology
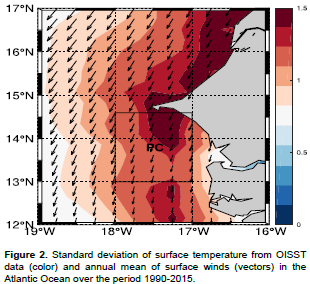
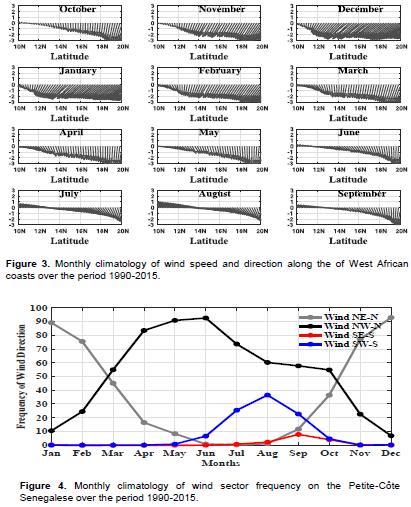
We first calculated the anomalies of the atmospheric and oceanic variables. These anomalies are obtained by removing from the raw value, the seasonal cycle over the whole period. We then calculated all the indices averaged in the study area shown by the black rectangle in Figure 2. We show also in Figure 2, the standard deviation of sea surface temperature and note that its maximum is located along the Senegalese-Mauritanian coasts, which shows a very high variability of the SST in these regions. The annual mean surface winds are superimposed and show mainly a northeast direction.
Several indices have been developed to quantify the upwelling phenomenon. These indices are often based on surface data, especially satellite data, and are essential to characterize the upwelling phenomenon in terms of spatio-temporal intensity. In the literature, four upwelling indices are most often used: an upwelling index based on the SST (Demarcq and Faure, 2000; Caniaux et al., 2011), an upwelling index based on winds and an upwelling index based on chlorophyll.
To characterize the cold tongue in the tropical Atlantic, Caniaux et al. (2011) defined an index based on a temperature threshold. Their SST threshold was chosen based on the contour of the isotherms that characterize the upwelling in the cold tongue area of the equatorial Atlantic. This index expresses the cooling intensity and is defined point by point by subtracting the SST for each grid point from a SST threshold within a domain A. The surface (SPC) occupied by the upwelling and the intensity (TlPC) of the cooling (considered here as the upwelling index) are given respectively by the following relations:
PC stands for the Petite-Côte, A is the area of the region and He the Heaviside function defined as follows:
We adopted the same method in our study (as in Caniaux et al.; 2011) to characterize the coastal upwelling index. The threshold temperature chosen, expressing the limit value of the SST at which we consider that the upwelling has started, is taken at 24°C. Note that this threshold SST value is very sensitive to our results but represents a value that allows us to obtain results comparable to those obtained using other methods (Teisson, 1983). Furthermore, the method of Caniaux et al. (2011) is used because it has the advantage of providing, in addition to the start and end dates, the upwelling surface which is important information for understanding the variability of the upwelling in this region.
The start date is obtained, for each year, as the first day when upwelling index is greater than zero and the end dates are obtained as the day when the value of the latter is equal to zero. This is our methodology for characterizing the upwelling phenology (start dates, end dates, surface area, date of maximum area) mentioned in Table 1.
One of the questions we are interested in is the oceanic and atmospheric mechanisms involved during early upwelling years. Thus, we chose to perform a composite analysis based on Table 1. The composite analysis method is a very useful statistical tool to spatially and temporally isolate the average behavior of a large meteorological field with respect to an area of influence that we want to test. This method does not allow to apprehend the complexity of physical processes. In fact, it has certain advantages for extracting signals or interactions from a complex environment. We defined a threshold to characterize the early (late) years by considering the years whose date of onset of the upwelling is less (more) than 1 time the standard deviation below (above) the mean start date. The threshold of 13 days which represents 1 time the standard deviation (Table 1) allows us to isolate early and late upwelling years. Thus, a year is considered as early year if it starts before 21-November and late if it starts after 16-December. The years that do not meet this selection criterion are considered as normal years. From these criteria, we form three groups of samples mentioned in the following Table 2.
We compared our results with the literature and relatively good consistency is found. For example, 2002 and 2006 upwellings are of chosen as case studies years in terms of late upwelling setup (Marin et al., 2009; Polo et al., 2008). Thus, we chose to average 30 days before and 30 days after the onset of upwelling for all atmospheric and oceanic variables to better diagnose the behavior of the parameters for early upwelling years. Finally, for the composite analysis of the different variables, we apply a lanczos filter to the data at intra-seasonal timescale to remove frequencies greater than 90 days.

RESULTS AND DISCUSSION
Seasonal cycle of the local atmospheric variables
One of the most important parameters for understanding coastal upwelling is the study of wind speed and direction. Thus, we show in Figure 3, the monthly climatology of wind direction and intensity. From October, the winds begin to intensify and are from North to Northeast in Mauritania but from North to slightly Northwest in the Petite-Côte. From November, the winds are, practically, of North-East sectors along the West African coast and intensify until March. From November, the winds are of North-West sectors in the Senegalese coasts (Figure 3). From April to May, the winds turn to the southeast, weaken in June and have a low intensity or even cancel out over the period from July to September. These results confirm those found by Roy (1989) when he studied the fluctuation and variability of winds along the Senegalese coast over the period 1963-1986 with observation data from weather stations.
On the other hand, the wind frequency map shows that the winds are predominantly northeast from November to March, then predominantly northwest from April to October with a penetration of monsoon winds with a southwest component during the months of June to October (Figure 4). Southeast winds are less frequent in the region and show their weakest maxima in September.
Phenology of upwelling in the Petite-Côte
Figure 5 shows the monthly climatology of the upwelling index and upwelling area calculated from the method of Caniaux et al. (2011). It shows a significant seasonal variation of the index with a maximum noted in March coinciding with the maximum of the average area occupied by the upwelling. Note that the maximum area shows a plateau from January and lasts relatively four months (January to May). On the other hand, the upwelling in the Petie-Côte begins on average on December 3 (with a standard deviation of +/- 13 days) and ends on June 13 (with a standard deviation of +/- 11 days (Figure 5 and Table 2) with a significant daily variance (shaded area). The mean upwelling duration is 192 days (about 6.5 months) and the maximum mean upwelling index is 0.5032 coinciding with 15 May. For more information, details are given in Table 2.
On the other hand, a synthesis of Table 2 is shown in Figure 6, highlighting practically all the information on the phenology of upwelling in in the Petite-Côte. Upwelling features show strong interannual variability in the starting dates, duration (in days) and the surface area (in km², the larger the circle, the larger the surface area and vice versa).
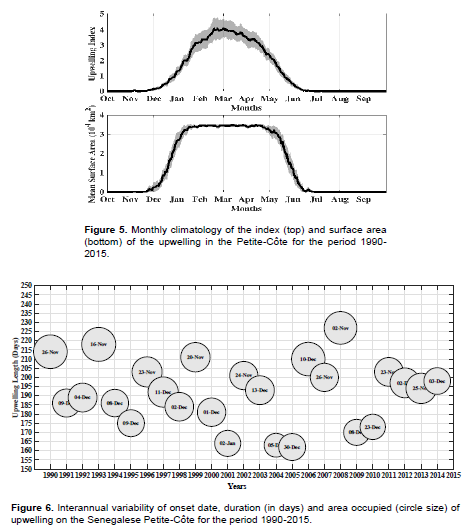
Note that, years in which upwelling starts earlier do not necessarily correspond to years of strong upwellings in terms of intensity and surface area. For example, the year 1994 (in which upwelling started earlier, e.g. on November 16, 1993) do show, practically, comparable surface area compared to normal years. Also, a year of late upwelling formation may correspond to a normal year in terms of surface area. However, the duration of the upwelling seems to be often related to the earliness of the upwelling. The earlier the upwelling, the longer the duration. We understand that the interannual variability of the upwelling system in the region is complex and requires extensive analysis. One of the important scientific questions of this paper is to understand the interannual variability of the onset dates of upwelling in the Petite-Côte. We will attempt to answer this question in the following paragraphs.
Composite analyses
Ensemble averages of atmospheric and oceanic variables were made for early upwelling years, with the starting date for each year as the center (corresponding to lag 0). Days before the upwelling starting date correspond to negative lags: for example, lag -1 corresponds to one day before the upwelling start date and lag +1 corresponds to one day after the upwelling start date and so on.
Surface temperature
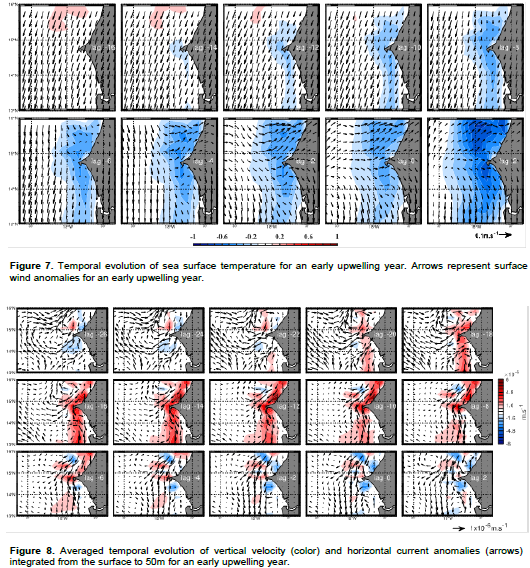
The composite analysis on surface temperature shows that for an early upwelling year, SST anomalies are abnormally negative and form 14 days before (lag -14) the start of the upwelling corresponding to a strong cooling of the SST in the area (Figure 7). This strong cooling first appears a few tens of kilometers from the coast and occupies virtually the entire Senegalese coastal region several days after the start of the upwelling (Figure 7). The distance between the maximum cooling and the coast confirms that upwelling in this area occurs not at the coast but at some distance from it (Figure 7) and confirms the work of Ndoye et al. (2014) among others.
This cooling is also associated to the strengthening of northeasterly to northerly winds favorable to the upwelling in the Petite-Côte. The cooling values at lag 0 range between -0.2°C and -0.3°C. The wind pattern may play an important role in the early initiation of the upwelling. Indeed, according to Ekman's theory, winds parallel to the coast are more efficient to produce upwelling under the effect of Ekman transport. However, on the Petite-Côte, the winds are often parallel to the coast (purely from the North) and therefore favorable to upwelling which is the case in lag 2.
Currents
The pattern of the vertical velocity for an early upwelling year is shown in Figure 8. Positive anomalies of vertical velocity are observed before the onset of the upwelling. Upwelled waters start 3 weeks (lag -22) before the onset of the upwelling, even if the values are low of the order of 1.10-8 m.s-1. Starting date of the vertical velocities (at lag -22) together with that of the negative SST (lag -14) clearly shows that the ocean takes 7 days to react to wind favorable to the upwelling (Figure 8). Maximum values of the vertical velocity (~ 8.10-8 m.s-1) are observed at about two weeks before the upwelling onset along the entire coastal edge. These upwellings are also located within a few tens of kilometers of the coastline in agreement with the SST anomalies in Figure 7. We also note that the upwelling is almost spatially in homogeneous, probably due to the configuration of the continental slope.
The horizontal currents show a strengthening two weeks before the onset of the upwelling. The strengthening of the zonal current is more intense to the north of the Petite-Côte and is directed offshore in accordance with Ekman's theory. Moreover, the strengthening of the zonal current coincides with a strengthening of the meridional current. The latter is often associated with the coastal upwelling jet (Figure 8). It is thought that the strengthening and weakening in the intensity of the coastal jet are tightly correlated to the variation winds which, in turn, trigger early upwelling formation. A striking future about the Senegalese upwelling is that the region is one of the richest in biodiversity and fisheries resources on the planet.
Correlation between variables
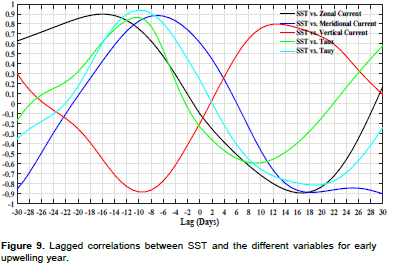
We calculated the lagged correlations between the composite SST index and the composite indices of the different variables for an early upwelling year. We clearly observed that for an early upwelling year, the SST is highly correlated with all variables 8-10 days before the onset of the upwelling (Figure 9). The exception is for the zonal current where the maximum correlation is observed two weeks before the onset of the upwelling. Correlation between SST and the costal jet is positive and denotes that the coastal jet becomes stronger carrying the colder northern waters southward, which participates on the early of the upwelling formation (Figure 9).
CONCLUSION
In this study, we were interested in looking at the atmospheric and oceanic mechanisms that drive the onset dates of coastal upwelling in the Petite-Côte which is located south of the Senegalese coast. Indeed, the region presents a strong interannual variability in terms of upwelling onset date, its duration and its intensity. To answer to the questions we are interested in, we used daily data outputs from the NEMO model in its version 3.6 and NOAA's OISST sea surface temperature observations. The methodology used in this study is mainly based on a composite analysis which is a statistical method widely used in the scientific community.
We began by describing the average wind conditions (intensity, direction and frequency) in the region. The results show that the winds in the Petite-Côte are mainly from the North. From North to North-East from October to May, the Eastern component disappears in summer in favor of the Western component. Winds from the south are weak in this area (Figures 3 to 4). The coastal upwelling index ( ) and the surface area ( show a very marked seasonal cycle. Indeed, our results show that upwelling in the Petite-Côte starts on average on December 3 and ends on June 13 with intense activity in April-May, peaking in mid-May (Figure 5). Moreover, the observation of the starting dates of the upwelling shows a strong interannual variability (Figure 6).
To understand this strong interannual variability, we performed a composite analysis using the earliness of the upwelling onset dates as the basic criterion to isolate early and late onset years. From the 26 years of data (1990-2015), we were able to isolate 3 early and 3 late years from the previously defined criterion (Table 2).
Our results show that for an early upwelling year, there is a strong cooling several days before the onset of upwelling. This cooling is due to the strengthening of northeast to north winds favorable to the upwelling. The offshore surface current increases as well as the coastal upwelling jet which is abnormally intense several days before the onset of the upwelling. This strong cooling of the SST is also associated with intense vertical velocity (up to 8.10-6 m.s-1).
Our results show and highlight that the relationship between the different variables is complex and deserves further analysis. For example, a year can be early in terms of upwelling onset date but its duration does not reach the climatological mean. On the other hand, upwelling onset dates seem to be related, beyond the Ekman transport, to the local strengthening of the coastal jet. These results must be verified by numerical modeling based on sensitivity experiments on the coastal jet. The validation of these results, by modeling, will bring a step further towards the predictability of the upwelling. The latter is necessary because it will allow a better management of the resource and will constitute a real tool for decision support.
CONFLICT OF INTERESTS
The authors have not declared any conflict of interests.
REFERENCES
|
Bricaud A, Morel A, Andre JM (1987). Spatial/temporal variability of algal biomass in the mauritanian upwelling zone, as estimated from CZCS data, Advances in Space Research 7(2):53-62. |
|
|
Caniaux G, Giordani H, Redelsperger JL, Guichard F, Key E, Wade M (2011). Coupling between the Atlantic cold tongue and the West African monsoon in boreal spring and summer. Journal of Geophysical Research: Oceans 116(C4):1-17. |
|
|
Dee DP, Uppala SM, Simmons AJ, Berrisford P, Poli P, Kobayashi S, Andrae U, Balmaseda MA, Balsamo G, Bauer DP, Bechtold P, Beljaars ACM,van de Berg L,Bidlot L, Bormann N, Delsol C, Dragani R, Fuentes M, Geer AJ, Haimberger L, Healy SB, Hersbach H, Hólm EV, saksen L, Kållberg P, Köhler M, Matricardi M, McNally AP, Monge-Sanz BM,Morcrette JJ, Park BK, Peubey C, de Rosnay P, Tavolato C, hépaut JN, Vitart F (2011). The ERA-Interim reanalysis: Configuration and performance of the data assimilation system. Quarterly Journal of the Royal Meteorological Society 137(656):553-597. |
|
|
Demarcq H, Faure V (2000). Coastal upwelling and associated retention indices derived from satellite SST. Application to Octopus vulgaris recruitment. Oceanologica Acta 23(4):391-408. |
|
|
Dussin RB, Barnier B, Brodeau L, Molines JM (2014). The making of Drakkar forcing set DFS5, DRAKKAR/MyOcean Report (05):10-14. |
|
|
Faye S, Lazar A, Sow BA, Gaye AT (2015). A model study of the seasonality of sea surface temperature and circulation in the Atlantic North-eastern Tropical Upwelling System. Frontiers in Physics 3:76. |
|
|
Herbland A, Voituriez B (1974). La production primaire dans l'upwelling mauritanien en mars 1973. Cah ORSTOM sér Océanogr 12(3):187-201. |
|
|
Hernandez O, Jouanno J, Durand F (2016). Do the Amazon and Orinoco freshwater plumes really matter for hurricane?induced ocean surface cooling? Journal of Geophysical Research: Oceans 121:2119-2141. |
|
|
Huntsman SA, Barber RT (1977). Primary production off north-west Africa: The relationship to wind and nutrient conditions. Deep-Sea Research 24(1):25-33. |
|
|
Jacox MG, Edwards CA, Hazen EL, Bograd SJ (2018). Coastal upwelling revisited: ekman, bakun, and improved upwelling indices for the U.S. West Coast. Journal of Geophysical Research: Oceans 123(10):7332-7350. |
|
|
Large WG, Yeager S (2009). The global climatology of an interannually varying air-sea data set. Climate Dynamics 33(2-3):341-364. |
|
|
Lathuilière C (2008). Echanges côte-large et propriétés biogéochimiques dans les regions d'upwelling de bord Est. Theses, Université Pierre et Marie Curie - Paris VI. |
|
|
Levitus S, Conkright ME, O'Brien T, Boyer TP,Stephens C, Johnson D, Baranova O, Antonov J, Gelfeld R, Rochester J, Forgy C (1998). World Ocean Database. Introduction, vol. 1. U.S. Govt. Print. Off, Washington, DC. 346 p. |
|
|
Madec G (2014). ''NEMO ocean engine'' (Draft edition r5171), Note du Pole de modélisation 27, Inst. Pierre-Simon Laplace, France, ISSN No. 1288-1619. |
|
|
Madec G (2008). NEMO ocean engine. Note from the Pole of Modeling, Institut Pierre Simon Laplace (IPSL), France, No 27, ISSN No (1288-1619):31-39. |
|
|
Madec G, Delecluse P, Imbard M, Levy C (1998). OPA8. 1 ocean general circulation model reference manual. Notes du Pôle de Modélisation IPSL, Pierre Simon Laplace, Paris. |
|
|
Marin F, Caniaux G, Bourlès B, Giordani H, Gouriou Y, Key E (2009). Why were sea surface temperatures so different in the Eastern Equatorial Atlantic in june 2005 and 2006? Journal of Physical Oceanography 39(6):1416-1431. |
|
|
Merem EC, Twumasi Y, Wesley J, Alsarari M, Fageir S, Crisler M, Romorno C, Olagbegi D, Hines A, Ochai GS, Nwagboso E, Leggett S, Foster D, Purry V, Washington J (2019). Analyzing the Tragedy of Illegal Fishing on the West African Coastal Region. International Journal of Food Science and Nutrition Engineering 9(1):1-15. |
|
|
Ndoye S, Capet X, Estrade P, Sow B, Dagorne D, Lazar A, Gaye A, Brehmer P (2014). SST patterns and dynamics of the southern Senegal-Gambia upwelling center. Journal of Geophysical Research: Oceans 119(12):8315-8335. |
|
|
Polo I, Lazar A, Rodriguez-Fonseca B, Arnault S (2008). Oceanic Kelvin waves and tropical Atlantic intraseasonal variability. 1: Kelvin wave characterization. Journal of Geophysical Research: Oceans 113(C7):1-18. |
|
|
Rebert JP (1978). Variability of Surface Conditions in the West African Upwelling, in Symp. Canary Current: Upwelling and Living Matter (No. 100). |
|
|
Roy C (1989). Fluctuations of winds and upwelling variability off the coast ofSenegal, Oceanologica Acta 12(4):361-369. |
|
|
Teisson C (1983). Le phénomène d'upwelling le long des côtes du Sénégal: caractéristiques physiques et modélisation. Doc CRODT-ISRA (123) |
|
|
Van Camp L, Nykjaer L, Mittelstaedt E, Schlittenhardt P (1991). Upwelling and boundary circulation off northwest Africa as depicted by infrared and visible satellite observations. Progress in Oceanography 26(4):357-402. |
|
Copyright © 2024 Author(s) retain the copyright of this article.
This article is published under the terms of the Creative Commons Attribution License 4.0


