Full Length Research Paper

ABSTRACT
This study focuses on the Sahel, one of the areas with the highest concentration of desert dust, with source areas having fine particle emissions in Chad, Niger, Mauritania, etc. It also includes areas of subsidence of air masses that promote the deposition of dust, such as Senegal. It turns out that the countries of Sahel are among the poorest in the world. They have a relatively low electrification rate. However, this area is also characterized by its good solar potential which makes it an ideal place for the installation of photovoltaic solar collectors. Senegal has launched the challenge to solve this problem of electrification by turning to renewable energies. But being a drop zone, the sensors on the ground will be impacted. This study defines the impact of the thickness of the dust deposit layer on a polycrystalline photovoltaic sensor. By looking at the behaviour of irradiation and aerosol deposition in Senegal with the ERA5 and Giovanni data, the intra-annual profile of deposition and irradiation in Senegal was established. By applying the results obtained on the climatology of these parameters to a monocrystalline solar photovoltaic collector, it was contrasted that the evolution of the power, as well as the yield of the collector was strongly impacted by the accumulation of the deposit after 5 years. The power delivered by the collector went from 59.779 W during the month of the 1st year of accumulation to 4.28 W during the last month of the 5th year of accumulation. The resulting yield is also affected. More detailed illustrations are given in this work.
Key words: Dust, accumulation, photovoltaic, polycrystalline, efficiency, Senegal.
INTRODUCTION
Photovoltaic solar energy comes from the conversion of sunlight into electricity within semiconductor materials such as silicon covered with a thin metallic layer (Saint-Gregoire, 2009). These photosensitive materials have the property of releasing their electrons under the influence of external energy. This is the photovoltaic effect (Quilliet et al., 1960; Wilson and Woods, 1973). The energy is provided by photons (components of light) which strike the electrons and release them, inducing an electric current (Mouratoglou and Pierre-Guy 2009). This direct current is calculated in watt-peak (Wp) and can be transformed into alternating current using an inverter. The energy produced is available as direct electricity or stored in batteries (decentralised electrical energy) or as electricity fed into the grid. It is said to be renewable because its source (the sun) is considered inexhaustible on a human time scale (Dahmoun, 2021).
Countries in the Sahelian zone are continuously affected by the presence of dust in the atmosphere. As Senegal is located in an air mass subsidence zone, aerosols in our atmosphere tend to fall and form accumulations of deposits. Accumulations impact ground-based devices such as solar photovoltaic collectors. This study simulates the deposition of aerosol on a photovoltaic collector over 5 years, applying the results obtained from the climatology of irradiation and dry dust deposition.
This application was done by taking the first grid. This grid is for Senegal, a country that is beginning to turn to renewable energies, namely photovoltaic energy. The behaviour of these collectors in the presence of deposit accumulation is shown in this work.
MATERIALS AND METHODS
The aim of this study was to simulate the deposition of dust on a solar photovoltaic panel. In the present case the panel used is polycrystalline panel. The accumulation of deposits took place over 5 years.
We placed ourselves in the first grid, more precisely in Senegal. With the climatology of irradiation and dust deposition made previously using the ERA5 and Giovanni data, we were able to simulate the impact of prolonged dust deposition on PV panels with the appropriate equipment. The dust thickness at which the panel production reaches a critical threshold was determined. Figure 1 shows a simplified diagram of the set-up.
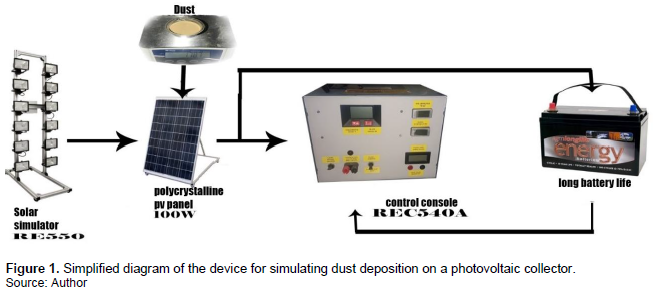
A RE550B solar simulator was installed and used as a light source to illuminate a 100 W polycrystalline solar panel. The panel is connected to a long-life battery which in turn is connected to a control console.
The panel is also connected to the control console, which allows to read the current and voltage characteristics of the panel, as well as other parameters such as the temperature of the panel and the irradiation received by the panel.
The light intensity received by the panel is calibrated by adjusting the distance between the panel and the solar simulator and by adjusting the number of lamps lit. After connecting the battery to the PV panel, it is connected to the control console to supply it with power. The console is supplied with power by the battery, which protects it from current fluctuations, voltage drops and power cuts. Once the installation is complete and the dust deposit in G1 in grams per square meter per month is known, the procedure of accumulating dust deposits on the sensor begin.
In order to know the thickness of the deposits on the collector, the density of the collected dust was first determined.
In this study 127.7 g occupies a volume of 100 ml, which gives 127.7×10⁻⁴ g/m3. The present panel is about 1 m2 in area considering the uniform deposition over the entire panel surface. The thickness of the deposit is obtained by taking the infinitesimal height of the cube formed by the deposit whose base area is the surface of the panel.
All the manipulations in this part were done as follows.
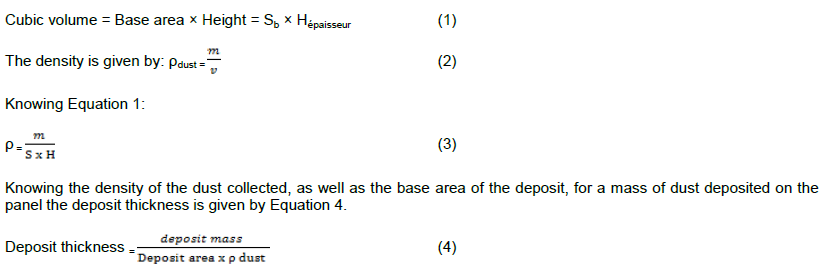
A solar simulator type RE551B consists of a frame of 12 lamps, each of which can deliver 500 W. The solar simulator is accompanied by a safety device containing two switches and two circuit breakers. The simulator consists of two blocks of 6 lamps and each block is controlled by a switch and a circuit breaker (Figure 2).
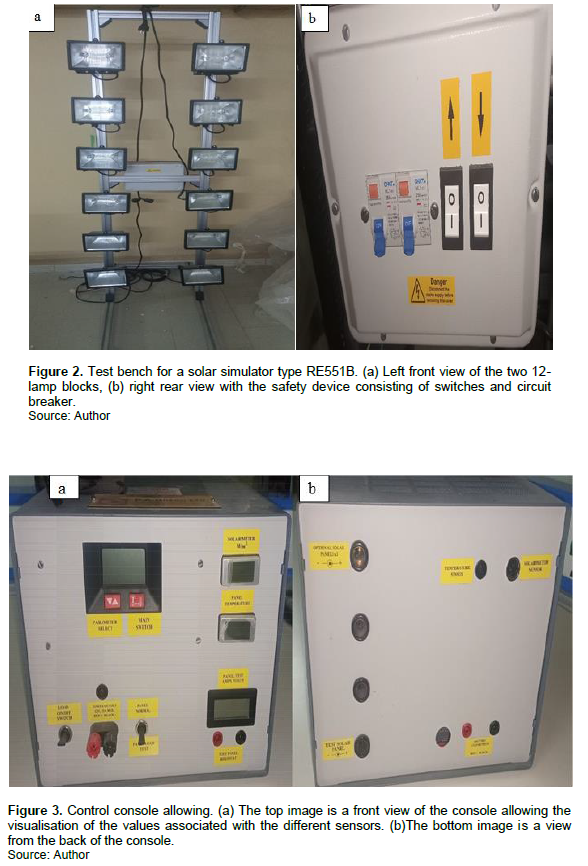
There is also a control console which allows the front panel to read the voltage and current delivered by a panel, the power of the solar flux and the temperature of the panel. On the rear panel are all the ports for connecting the various sensors to the console (Figure 3).
A rheostat is also used, which is nothing more than a manually variable resistor. In the present study, it is connected to our solar collector and then to the control console (Figure 4).
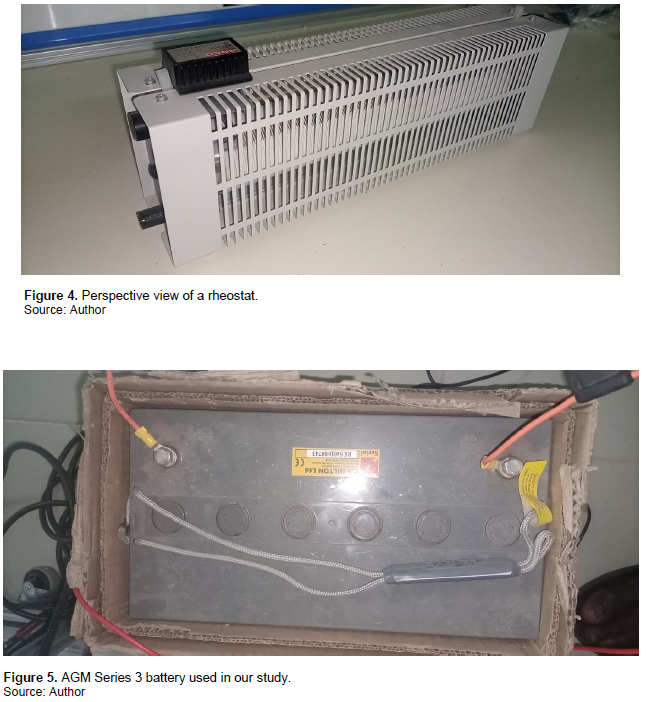
There is need for a battery that will be connected to both the PV solar collector and the console in order to have storage and also protect the console from being switched on or off too suddenly when it is directly connected to the panel (Figure 5).
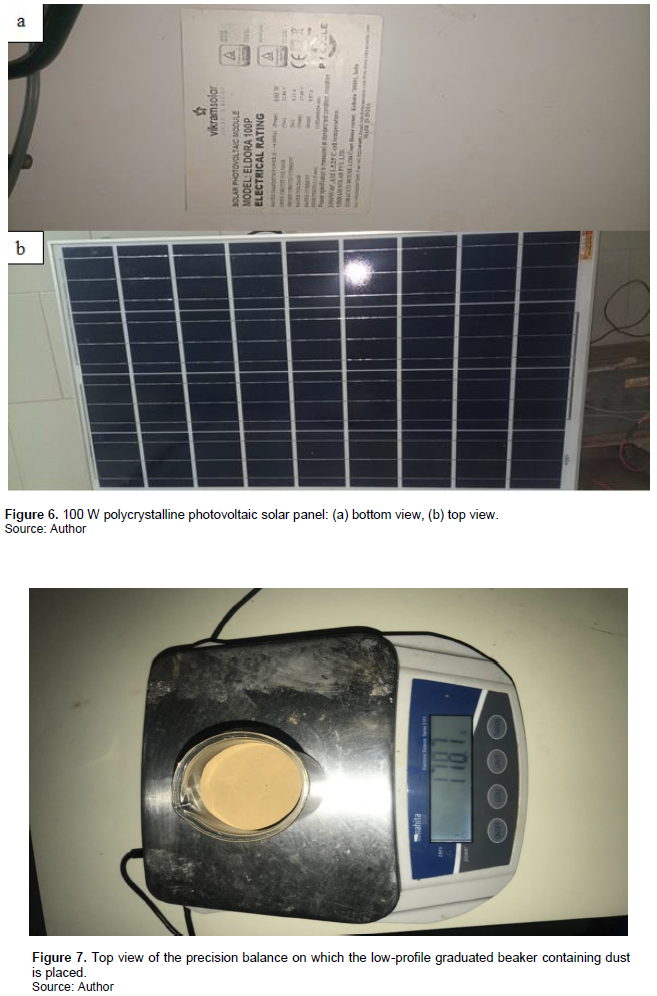
There is need for a polycrystalline panel of one square meter on a tiltable bench, with a power of 100 W, an open circuit voltage of 21.84 V, a short circuit current of 6.11 A, a maximum power voltage of 17.99 V and a maximum power current of 5.57 A (Figure 6).
Finally, there is a precision balance, a low-profile beaker with a graduated scale for weighing the dust collected (Figure 7).
In this work, UV index aerosols (AUVI) and dust depositions were used. The data were derived from MODIS sensor on the Terra and Aqua satellites. The AUVI data were initially derived from the Total Ozone Mapping Spectrometer (TOMS) version 8 daily global gridded data product (EP) containing total column ozone, UV aerosol index, Lambertian effective surface reflectivity (Rayleigh corrected) and local noontime UV-B irradiances. The data were considered in a global grid of size 180° × 288° with a lat-long resolution of 1.00 × 1.25 degrees. The AUVI were also obtained from the OMI science team. The OMTO3d product is produced by meshing and averaging only good quality orbital data over the total ozone level 2 (OMTO3, based on the improved TOMS version-8 algorithm) on grids of resolutions 1°×1°.
These data are pre-processed by Acker in 2014 on the https://giovanni.gsfc.nasa.gov/giovanni/).The irradiation is directly extracted from the ERA5 platform. ERA5 is the fifth generation of ECMWF reanalysis for global climate and weather for the last 4 to 7 decades. Currently, data are available from 1979 onwards. ERA5 re-places the ERA-Interim reanalysis. The data were re-gridded to a regular lat-lon grid of 0.25° for the reanalysis and 0.5° for the uncertainty estimation. There are four main subsets: hourly and monthly products, both on pressure levels (upper air fields) and single levels (atmospheric, ocean wave and land surface quantities).
RESULTS AND DISCUSSION
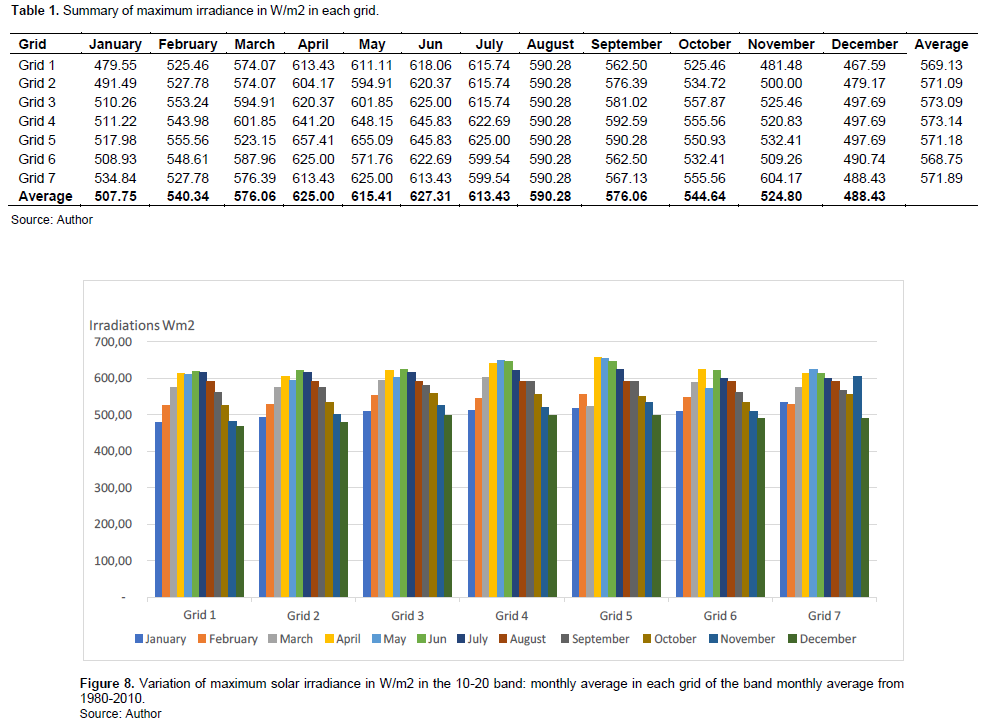
Table 1 and Figure 8 summarize the variation of maximum solar radiation observed over 30-year monthly averages from 1980 to 2010. The results are close to Soulouknga et al. (2017). For each of the seven grids of the 10-20 bands, the highest values are observed in April, June and July. The observations found were in line with Bilal et al. (2007).
Table 2 and Figure 9 give the average dust deposition on each of the seven grids of the 10-20 bands; the results are close to Orange et al. (1990). It can be seen that in January and February the maximum deposition is located on the first grid (G1), with a monthly average per square meter per month exceeding 2.5 g. Grids G3 and G4 have a deposition of 2.28 g during these first months (Soleilhavoup, 2011). G2 and G6 have 1.52 g of deposition. G5 and G7 have the lowest deposits in January and February (0.76 g).
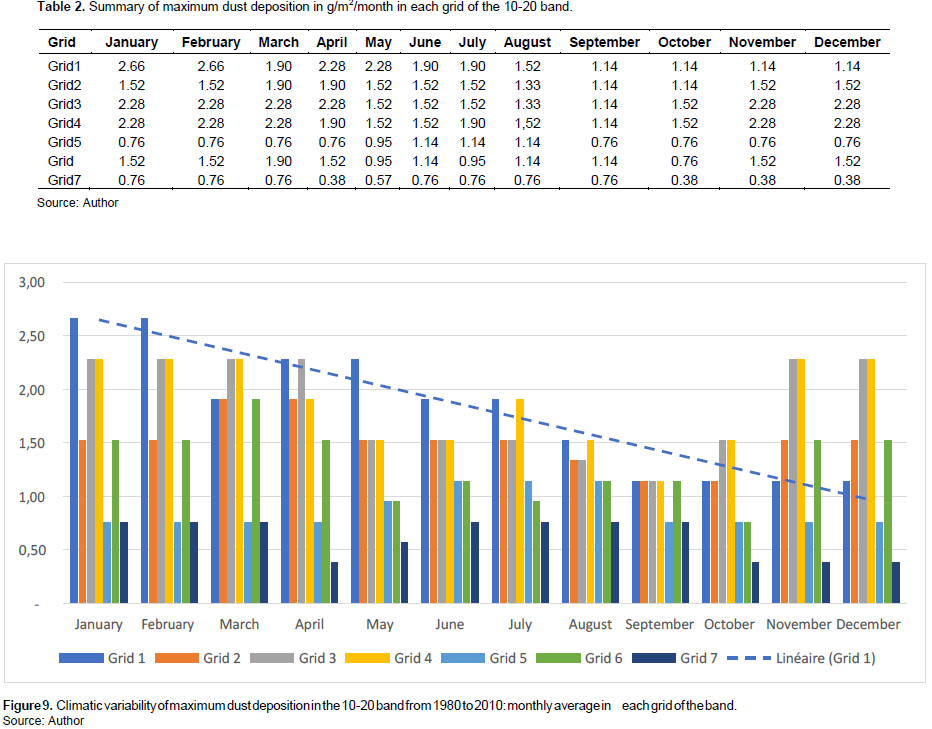
For the month of March, G3 and G4 keep the same deposit values. However, G1, G2 and G6 have a deposit of 1.9 g. The deposit values in G5 and G7 remain the same as in January and February.
In April the deposit in G1 rises slightly as well as in G3 with a value of 2.9 grams. G2 and G4 keep the same values as G2 in March. The deposits for G5 and G6 remain the same as in January and February, while the deposit in G7 drops to 0.38 g.
May and June have quite similar profiles with a slightly higher deposition in G1 for May; but, it was higher in G5, G6, and G7 for June.
In July the deposition values in G1 do not change compared to the previous month and the deposition in G3 increases to the same value as in G1. The deposits in G2, G3, G5 and G7 also remain the same as in June. In G6, there is a slight decrease.
In August the deposition in the first four grids decreases, but in G5 and G6, we have the same variations as in June with a deposition of 1.4 g/m2/month; while the deposition in G7 remains almost the same.
In September the lowest deposition values are noted for G1, G2, G3, and G4, with 1.4 g. In G5 and G7, the same deposits are noted. In G6, we have the same values as in the first three grids. In October, November and December, we note that the deposit in G1 remains the same as in September, but in G2, G3 and G4 it rises again to the same values as in January, that is, 1.5 and 2.28 g, respectively.
It is interesting to note the downward trend of dust deposit in G1 between January and December.
During and after the passage of Ultraviolet Index Aerosols (AUVI), deposits are noted in the 10-20 bands. Countries like Senegal, the two Guineas, part of Mali, Burkina Faso, Niger, Chad and Nigeria are covered by the deposit depending on the month. A maximum deposition in grids 3 and 4 is noted in November and December. This concerns Niger and part of Chad, because these two grids are source zones. According to the process of uplift, transport and deposition of fine particles, aerosols and the sandblasting process are favoured by harmattan circulation. A large part of the particles fall first on and around this same uplift zone, hence we have maximum deposits in Niger and Chad area. In January and February, the maximum deposits are located in grids 1 and 2. These two grids mainly cover Senegal and part of Mali. There are correlations between the deposition observed in the Chad-Niger region and the deposition in the Senegalo-Malian region. After the uplift of aerosols in grids 3 and 4, particles smaller than or equal to 20 µm are transported over thousands of kilometres in the lower and middle layers of the atmosphere; they end up arriving in grids 1 and 2. A shift of 'about 1 month and a half is observed. A significant deposit is observed in January, February, June and August in the Tchat-Niger region as well as Senegal-Malian zone in March, April, May, July and September.
Regarding the evolution of PV production in the absence of collector deposition, Table 3 gives a summary of the evolution of the current, voltage and power characteristics of a solar PV panel as a function of the average monthly irradiation in G1, which includes Senegal. In this table, it is considered that there is no deposition and therefore no accumulation; the powers obtained are optimal.
The evolution of the PV production for a year of deposit accumulation on the collector is shown in Table 4. The evolution of the PV production during the 2nd year of deposit accumulation on the collector is shown in Table 5. The evolution of the PV production during the 3rd year of deposition on the collector is shown in Table 6. The evolution of the PV production during the 4th year of deposit accumulation on the collector is shown in Table 7. The evolution of the PV production during the 5th year of deposit accumulation on the collector is shown in Table 8.
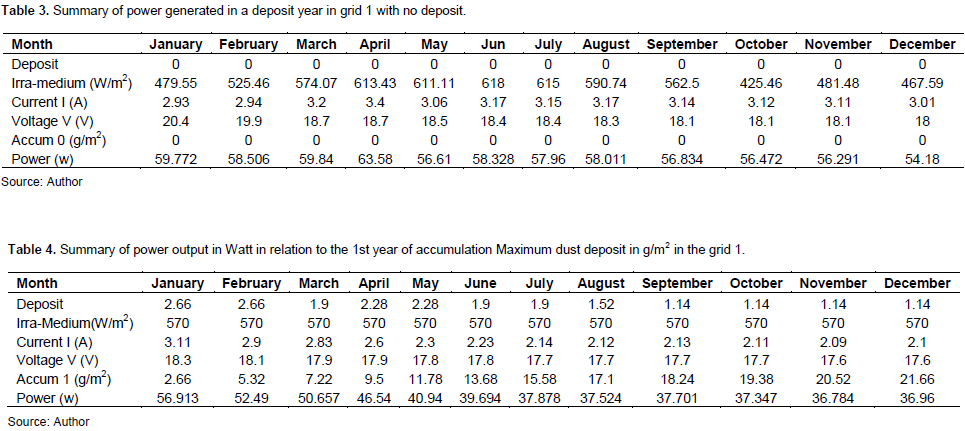
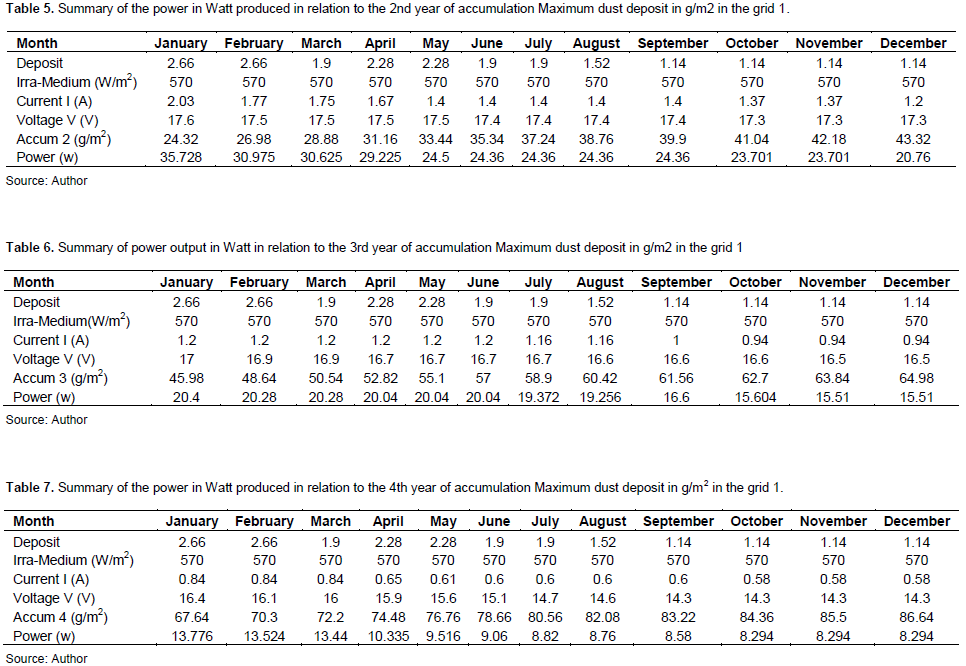
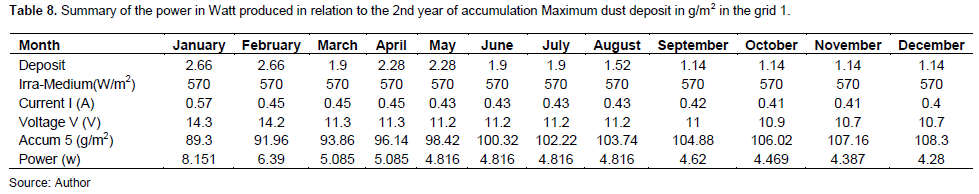
Tables 4 to 8 summarize the behaviour of the current, voltage and power characteristics as a function of the evolution of the accumulation of dust on the collector. The accumulation is simulated over 5 years. Table 4 summarizes the behaviour of the panel during the first year of dust accumulation. In Tables 5, 6, 7 and 8, we have, respectively, the 2nd, 3rd, 4th and 5th years.
Figure 10 shows the evolution of the power produced by the panel during the first year of accumulation. Between January and June the power produced by the panel falls more rapidly, for a deposit of 2.66 g; we have a power of 56.9 W in January. In June, for a deposit of 13.68 g on the sensor, we have a power of 39.64 W. Between June and December, that is, the 6 and 12th month, the decrease of power, although present, is less marked; we note a loss of 2 W.
In the second year of accumulation, as shown in Figure 11, the power loss is less regular than in the first year of accumulation. In fact, between the 13 and 14th, 16 and 17th, 23rd and 24th months, the power drops are more significant for the other months. It is also noticed that during the second year of accumulation, the loss of power is very minimal between the 17th and 23rd months.
During the third year of accumulation, between the 25 and 30th months, the power hardly changes despite the accumulation of deposits; it is between the 31st and 33rd months that a significant drop was observed (Figure 12).
In the 4th year of deposit accumulation, Figure 13 shows the shape of the curve is reversed compared to the 3rd year. Between the 36 and 38th months, the decrease in power is slightly visible, although very small. It is between the 38 and 40th months that the decrease in power is most significant. Between the 40 and 48th months, the power continues to decrease but more moderately. These results are similar to those of Diop et al. (2021), Ndiaye et al. (2017) and Neher et al. (2017).
With the 5th year of accumulation (Figure 14), the power is at its lowest with 8.36 W in month 49, 5 W in month 51 and 4.28 W in month 60.


In the first year of accumulation of dust deposits we have for the first month a deposit of 2.66 g and a power of 56.9 W; in the 12th month the deposit was 21.66 on the collector and the power delivered was 36.96 W, that is, a power loss of 19.97 W.
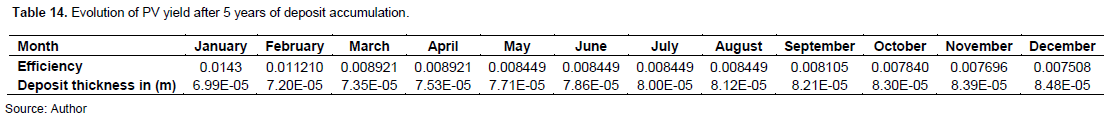
In the second year of accumulation, in the 13th month the deposit is 24.32 g, the power produced is 35.7 W; in the 24th month the accumulation is 43.32 g and the power delivered by the collector is 20.76 W, that is, a power loss of 14.94 W. For the 3rd year, at the 25th month, the accumulation is 45.98 g for a power of 20.4 W; at the 36th month for 64.98 g of accumulation on the collector we have a power of 15.51 W, that is, a power loss of 4.89 W. At the 4th year, for a deposit of 67.64 g, we have a power of 13.77 W in the 37 and 48th month, an accumulation of 86.64 g with a power of 8.29 W, that is a power loss of 5.48 W. In the 5th year of deposit accumulation, the power is 8.15 W, for an accumulation of 89.3 g in the 49th month and in the 60th month the power drops to 4.28 W, for a deposit of 108.3 g; there was a power loss of 3.87 W. It can be seen that the power losses go from almost 20 W in the first year of accumulation to 3.87 W in the last year of accumulation, so there is an inverse evolution between the gradient of loss of the accumulation on the collector. However, the power still increases from 56.9 to 4.28 W in 5 years of dust accumulation on the PV collector. Table 9 summarizes the evolution of PV performance in the absence of deposits. Tables 10 to 14 summarise the evolution of the PV performance with respect to the thickness of the deposit on the collector.
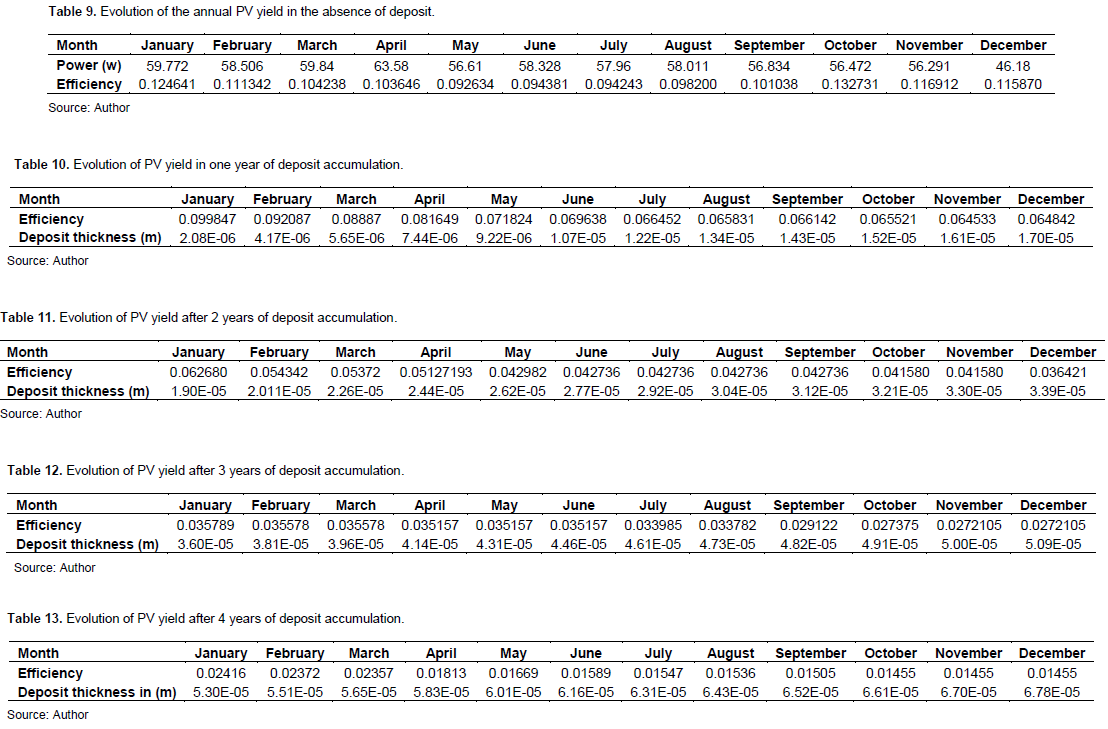
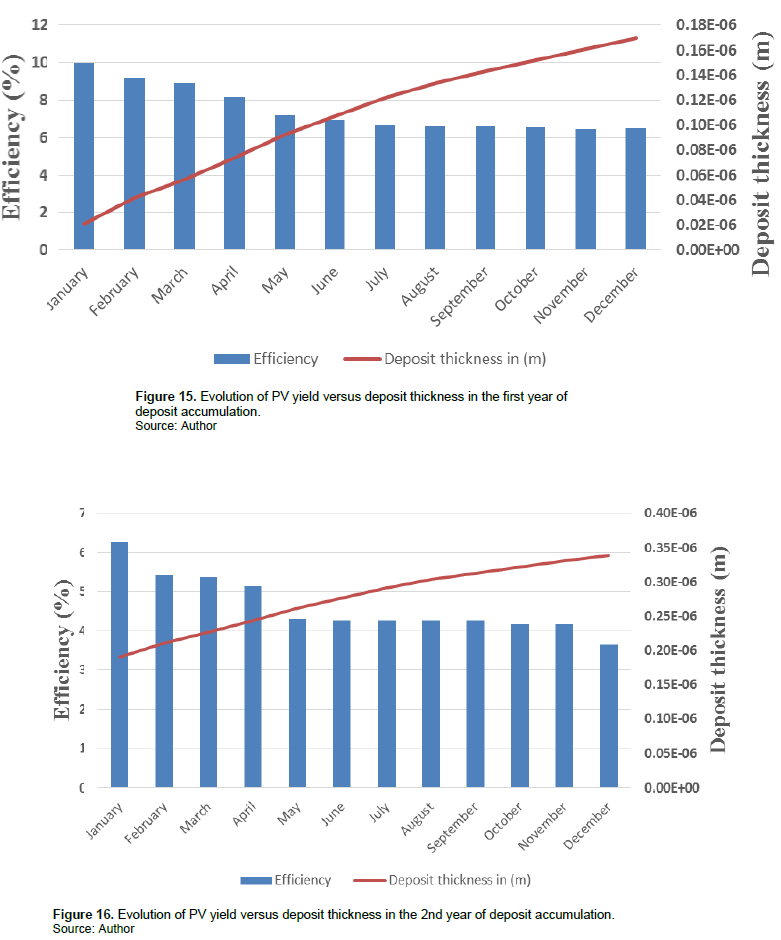
In Figure 15 the collector efficiency decreases with increasing deposition thickness for the first year between the 1st and 7th months. As the deposition thickness increased from 2 to 10 μm the efficiency dropped from 10 to 6%. Between the 8 and 12th months the deposit thickness increased from 12 to 17 µm but the yield remained constant at 6%.
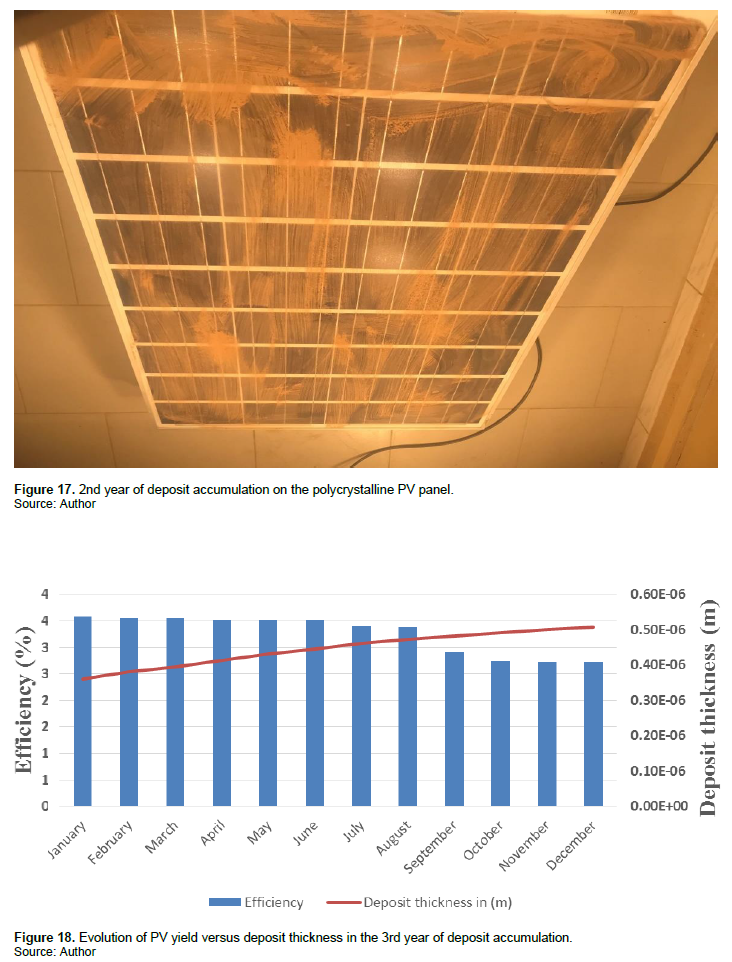
For the second year (Figures 16 and 17), the evolution of the yield goes from 6.2 to 4.2% between 13 and 17th months at the same time as the thickness of the deposit goes from 19 to 26 µm. It remains relatively constant while the thickness increases between the 18 and 24th month from 27 to 33.9 µm.
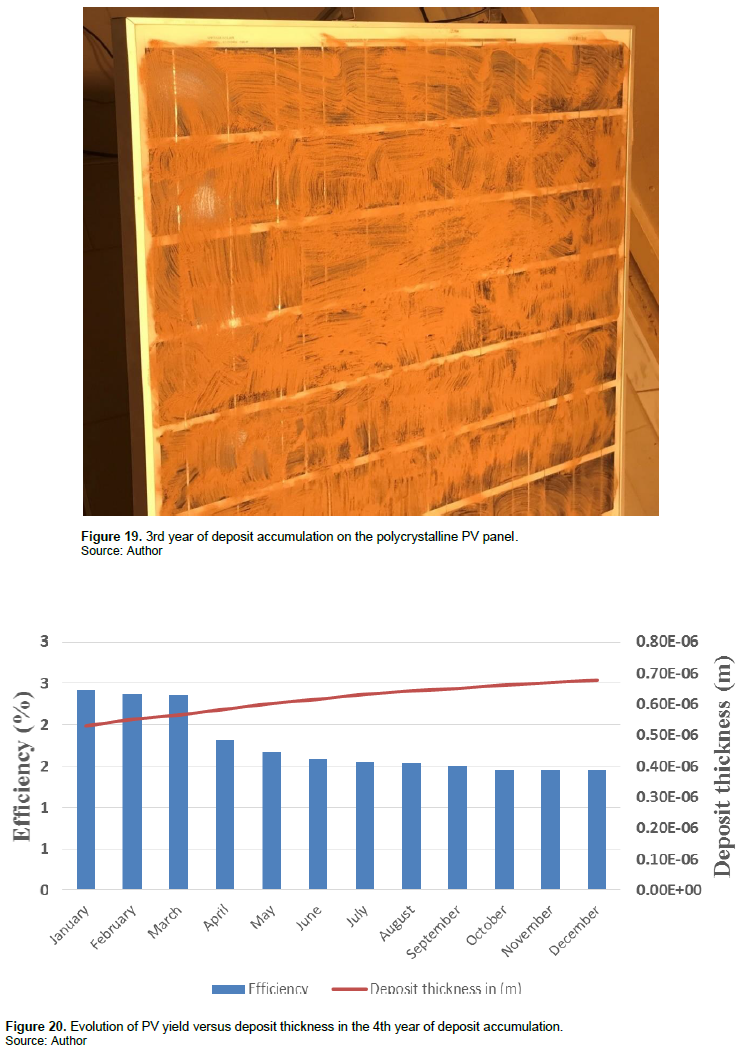
In the third year (Figures 18 and 19), the yield remains constant between the 25 and 30th months at 3.5% while the thickness increases from 36 to 40 µm. It is between the 34 and 35th months that the yield drops again significantly to 2.7%, with a deposit of 49 µm thickness.
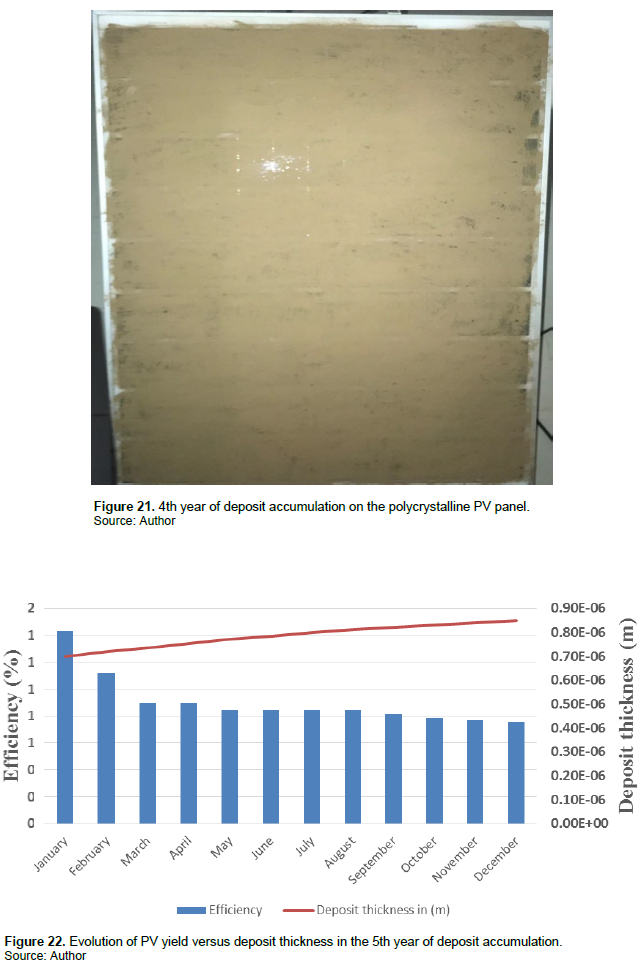
With the 4th year (Figures 20 and 21), the yield is 2.3% at month 39; at 1.45% the deposit thickness is 67.8 µm.
From the 5th year (Figures 22 and 23) to the 50th month, the deposit thickness is 73.5 µm and the yields become almost zero.
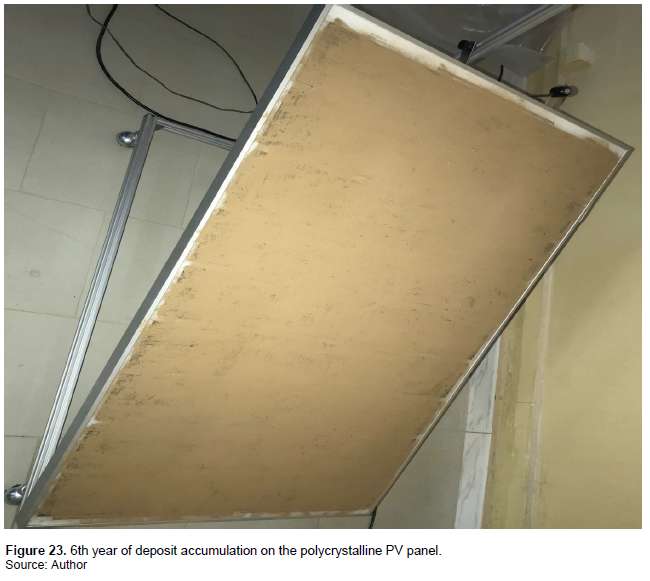
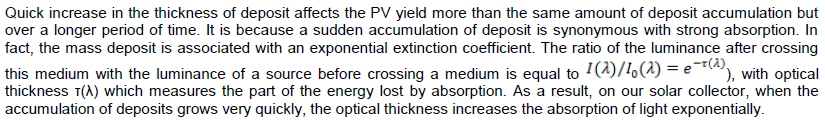
This decrease of the production of the PV collector is because desert dust results from the cracks of quartz grains, which have reflecting and absorbing properties. Therefore, when the radiation arrives on the plate covered with a layer of dust, part of the radiation is reflected, part is absorbed and another is transmitted. When the thickness of the deposit increases, the part of the radiation absorbed increases. This reduces the irradiation transmitted to the panel and consequently the energy produced by the panel.
CONCLUSION AND PERSPECTIVES
The study reveals good solar potential in the 10° North - 20° North band, which exceeds 500 W/m2 from February to November. This attests to the good capacity to receive photovoltaic devices from the countries of the Sahelian zone, in particular Senegal. However, the study of the dust deposit reveals that Senegal characterized by grid 1 is the most impacted from January to July. In this work the results showed that when the dust deposit thickness is equal to 24.4µm the efficiency decreases by half and when it reaches 73.5 µm the PV efficiency starts to become almost zero. The other interesting fact is that it is the rapid increase of the deposit thickness that affects the efficiency more, than when it is more moderate. With this work it will be easier to predict how often the collectors should be cleaned, and after how long without cleaning the sensor will enter a critical phase of production in relation to the user's needs.
CONFLICT OF INTERESTS
The authors have not declared any conflict of interests.
REFERENCES
|
Bilal BO, Sambou V, Kébé CMF, Ndongo M, Ndiaye PA (2007). Study and Modeling of the Solar Potential of the Nouakchott and Dakar Sites. Journal of Sciences 7:57-66. |
|
|
Dahmoun WI (2021). "Renewable energies: one of the pivots of sustainable development in Algeria." International Journal of Advanced Research on Planning and Sustainable Development 4. |
|
|
Diop D, Moulaye D, Abel S, Pascal DB, Serigne AAN, Astou S 2021). "Influence of Dust Deposition on the Electrical Parameters of Silicon-Based Solar Panels Installed in Senegal (Dakar Region). Energy and Power Engineering 13(5):174-189. |
|
|
Mouratoglou P, Pierre-Guy T (2009). "Photovoltaic solar energy." Industrial Realities 4:91-70. Réalités industrielles - Novembre 2009 - L'électricité solaire et les pays de la Méditerranée. |
|
|
Ndiaye A, Kébé CM, Bilal BO, Charki A, Sambou V, Ndiaye PA (2017). Study of the correlation between the dust density accumulated on photovoltaic module's surface and their performance characteristics degradation. In Innovation and Interdisciplinary Solutions for Underserved Areas. Springer, Cham. Pp. 31-42. |
|
|
Neher Ina, Tina B, Susanne C, Bernd E, Klaus P, Bernhard P, Christophe S, Stefanie M (2017). "Impact of atmospheric aeroosols on photovoltaic energy production Scenario for the Sahel zone." Energy Procedia 150:170-179. |
|
|
Orange D, Gac JY, Probst JL, Tanr D (1990). "Measurements of Saharan dust deposition. A simple sampling technique: the pyramidal collecting system." Comptes Rendus de l'Academie des Sciences. Série II 311:167-172. |
|
|
Quilliet A, Peter G (1960). "The surface photovoltaic effect in silicon and its application to the measurement of the lifetime of minority carriers." Journal of Physics and Le Radium 21 p. |
|
|
Saint-Gregoire P (2009). "Solar photovoltaic energy: fundamental aspects, current situation, and perspectives in the framework of the water problem." (STM 9), no. 16-27. |
|
|
Soleilhavoup F (2011). "Accumulation and erosion microforms on desert rock surfaces of Sahara." Geomorphologie-Relief Processus Environnement 2:173-186. |
|
|
Soulouknga, Marcel H, Ousmane C, Serge YD, Timoleon CK (2017). "Evaluation of global solar radiation from meteorological data in the Sahelian zone of Chad." Renewable energies: wind, water and sola 4(1):1-10. |
|
|
Wilson JIB, Woods J (1973). The electrical properties of evaporated films of cadmium sulphide. Journal of Physics and Chemistry of Solids 34(2):171-181. |
|
Copyright © 2024 Author(s) retain the copyright of this article.
This article is published under the terms of the Creative Commons Attribution License 4.0


