Full Length Research Paper

ABSTRACT
INTRODUCTION
Sahel climate is characterized by strong climatic variations of temperature, humidity and precipitation (Foxa and Rockstrom, 2003; Kandji et al., 2006). In Sahel countries generally and Mali in particular, economy depends mainly on agriculture, so these variations and the lack of efficient policy in environment management increase the poverty and affect social instability (food insecurity, migration, social conflicts, etc.).
An efficient management of under and over ground water is a key factor for agriculture sustainability which depends mostly on the precipitation. For farmers, precipitation is the main parameter, because it directly affects their incomes (Udual and Ini, 2012). Researches on modeling, prediction and forecasting climate mitigation in general and precipitations in particular are necessary conditions to increase agriculture production.
Although researches have been done in the field of rainfall modeling and predicting, the complexity of the trend climate mitigation makes it remain a challenge mainly for Sahel countries. Analysis of rainfall data strongly depends on its availability and distribution pattern. It has long been a topic of interest in the fields of meteorology to establish a statistical probability distribution that can provide a good estimation.
Mali climate represent a better sample for Sahel climate variation studies, because of its geographic position. Mali climate is straddling to the sub-tropical band called the Sahel; in which northern parts reach well into the dry Sahara desert, while the southern regions experience a wetter, more tropical, climate. The seasonal rainfall in Mali is controlled by the movement of the tropical rain (also known as the Inter-Tropical Conversion Zone, ITCZ) which oscillate between the northern and southern tropics over the course of a year, and brings rainfall to the southern regions of Mali between June and October, peaking in August. Seasonal temperature variations are large, and differ in their patterns for different parts of the country (Jones et al., 2005).
The analysis and modeling of rainfall data based on time frequency trend is very complex (Phien, 1987; Manik and Datta, 1998; Zhang, 2003; Cousineau et al., 2004). The recent years have seen the increasing use of statistical theory (Vivekanandan, 2013). Gumbel distribution function approach the latest innovation based on statistical theory. This distribution with cumulative probability can be used to estimate the magnitudes of floods with different return periods, because of the simplicity with which the quartiles can be calculated.
FREQUENCY ANALYSIS
Sites description
The four sites have been selected based on the availability of long period data and their position. This climate is mainly characterized by a high variability of inter-annual and inter-decadal times-scales, which can make long-term trend difficult to be identify. The selected four sites represent the complexity of rainfall in Mali.
1. Mopti (14°:406’27N) capital of the fifth administrative region of Mali, limited by Tombouctou in the north and Segou region to the southwest and Burkina Faso to the southeast. The Niger River crosses Mopti, makes this region in terms of water, a well-irrigate; so agriculture is well-developed, with also a particular successful fishing activities and shepherd. Mopti serves as an important commercial crossroads between Mali’s north, south and bordering nations. Tourism is also-developed, notably in the cities of Djenne and Mopti.
2. Hombori (15°142’297N) is a small town in the community of Douentza in Mopti region, situated on the national road 15 highway linking Mopti to Gao and Kidal regions. This small commune is the gate of Sahara. The climate in Hombori differs from other sites, the lack of important precipitation activity and continuous aquifer can be tapped by deep wells making the provision of drinking water in the commune difficult.
3. Kayes (4°1126’46N), the main city of the first administrative area of Mali is crossed by Senegal River, the region is bordered by the countries of Mauritania at the north, Senegal at the west, Guinea at south and region of Koulikoro in the east. At the Guinean border, the climate is rather wet, but becomes Sudanian and later Sahelian to the north.
4. Koutiala (12°528’44N) is situated in Sikasso region (southern-most), the third region of Mali. This region receives more rain than any other Malian regions. Koutiala is the heartland of the cotton production in West African regions. The quantity and the quality of cotton produce in the area makes this site the second industrial city of Mali.
Data analysis
To reduce the complexity of analysis, we used regression analysis. Regression analysis is a process of fitting a function to a set of data points. Curve fitting with polynomials is done with polyfit function which uses the least squares method. Polyfit function finds the coefficients of a polynomial representing the data; used them to find new values of the data.
Based on year cumulated precipitation
Figure 1 represent the year-to-year cumulated precipitation, blue curve represented the record data and the red one is the best polynomial fit of the recorded data used polyfit function. It illustrates the downward trend for total precipitation, with minimum in the 1980s followed by small increases in the 1990s.

The downward trend is more important for Mopti, Kayes and Hombori. From 1990, there was a small increase followed by decreases to 2004 except for Kayes (Figure 1c). The decrease of precipitation is observed in all the sites in the period of 1950 to 1980. This decrease is more important for Koutiala and Hombori. A relative increase was observed for the period of 1990 to 2000. The drought (1980’s to 1990’s) decimated the livestock (20 to 50%), caused scarcities of water and food, and increased immigration and social conflicts between famers and shepherds.
Based on the number of rain days in year
From Figure 2, it is noted that the trend of number of rainfall days is downward for Mopti, Kayes and smaller for Koutaila and Hombori, with a minimum situated in the interval 1980 to1995.

A small increasing of the precipitation (Figure 1) is observed at the end of 1990s for all the sites. The global trend for both curves (Figures 1 and 2) is the reduction of precipitation and the number of precipitation days. Figures 1 and 2 shows the variation on trend of the precipitation and the number of rainfall days for 56-year period. A period of particularly high rainfall (cumulate precipitation and number of rain days) occurred in the early 1950s, whilst the early 80s were very dry, causing widespread dryness in Mali and other Sahelian countries. Precipitation has recovered to some extent for all sites since 90s, but the increase has been quickly followed by the decrease in 2000. It is recommended that an efficient under-ground management policy to compensate this reduction of precipitation should be made.
PROPOSED METHOD: GUMBEL DISTRIBUTION FUNCTION
 Since 1970, attention of the research on climate modeling has been focused on the discrete distribution function provides by Lagrangian distributions (Vivekanndan, 2013; Consul et al., 1972; 1973; Heathcote et al., 2004). This distribution function is been found more general in nature and wider in scope. Gumbel distribution is the latest innovations for climate modeling. It can be represented as follows (Consul et al., 1972; Heathcote et al., 2004):
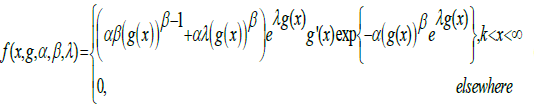
Where  is a continuous monotonic increasing function, k is is any positive real number, with
 .png) satisfying the conditions
satisfying the conditions  this condition is also known as Weibull three parameters distribution probability function. Similarly, many distributions can be found by efficient parameters selection (Isaic-Maniu, 1983; Gumbel, 1958; Chausse, 2010).
Parameters estimation
In the wide fields of management, planning, design and prediction parameters play a key role in modeling and predicting. In all this paper, we selected  . To be specific, some significant parameter estimation methods such as method of moments (MOM), maximum likelihood method (MLM), method of least squares (MLS) and the probability weighted moments (PWM) are used for the determination of Gumbel weibul distribution function parameters.
Method of moments
The method of moment is probably the oldest method for constructing an estimator. The advantage of this method is the simplicity, and the facility of implementation widely used. In MOM  and
and  are estimated as (Vivekanandan, 2013; Hall, 2006):

Where, 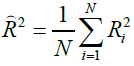 and
and  are the mean and standard deviation of the annual recorded data.
Maximum likelihood method
Maximum-likelihood method was first proposed for factor analysis by Bowman et al. (1985). This method consists of setting the Gumbel parameters which maximize the likelihood distribution function by the following formula (Vishwa et al., 2013):
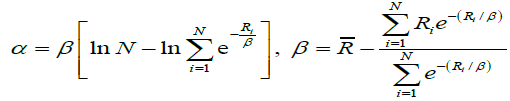
Where,  is the recorded annual cumulate rain based on the daily record of ith year and N is the sample size.
Method of least squares
The least-squares method is one of the most important estimation methods, which attempts to obtain such values of the factor loading and the unique variance that minimizes a different loss function. The parameters estimation is computed using the following formula (Vishwa et al., 2013; Manik and Datta, 1998).
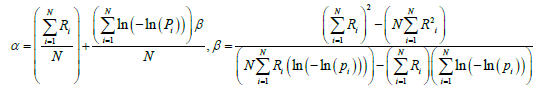
Where, 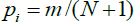 and defines the cumulative probability of non-exceed for each . Here, m is the rank assigned to each of the data points arranged in ascending order (rank 1 is assigned to the smallest value and N to the largest value).
Probability weighted moments
Probability weighted moment was introduced by Arthur et al. (1979) and Landwehr et al. (1979). This method takes into account the weight moment to determine the parameters computed as (Landwehr et al., 1978; Vishwa, 2013):

Where, .png) and
and 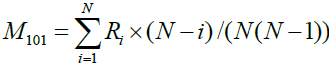
Where is the recorded annual cumulate record based on the daily record of ith year and N is the sample size.
Good fit techniques
In this section, we used good fit technique to check the compatibility of the methods.
Anderson-Darling test
Anderson-Darling (AD) test was initiated by Andersion and Darling (1954) as an alternative to statistical tests for detecting sample distributions. AD test is non-directional and can be applied to Normal, Weibull, and other types of distributions (Anderson and Darling, 1954; Heatcote, 2004). It is calculated from the following formula:
The  statistic is defined by:
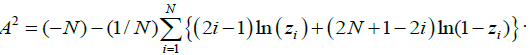 .
.
For a given sample of N values,  .
.
Kolmogorov-Smirnoff test
Kolmogorov-Smirnoff (KS) test was first introduced by Kolmogorov (1933, 1941) and Mezbahur et al. (2006) as a test of the distance or deviation of empirical distributions from a postulated theoretical distribution. KS test for a given theoretical cumulative distribution is defined by:
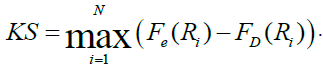 .
.
Where, 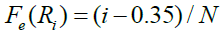 the empirical cumulative distribution function (CDF) of is
  is the computed CDF of . Here, ‘i’ is the rank assigned to each data point arranged in ascending order (Kolmogorov et al., 1933) (rank 1 is assigned to the smallest value and N to the largest value).
Diagnostic test
D-index statistics is defined by (United States Water Resources Council, 1981):
Where, 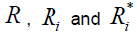 are the average precipitation, the ith highest recorded and estimated annual cumulated records, respectively. The D-index test essentially gives weightage to the upper most six data points rather than the data points at lower levels. The least value D-index is considered as the best method.
Chi-square test
This distribution was introduced by the German statistician Friedrich Robert Helmert in 1876. He used distribution of the sample variance using the following formula.
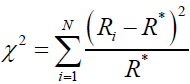
Where, are the year recorded data, year, total year and the expected rain recorded, respectively
Simulation results
After computing the value of  and
and  for MOM, MLM, MLS and PWM, we estimated each method using good fit technique, the result of the simulation is presented in Table 1.
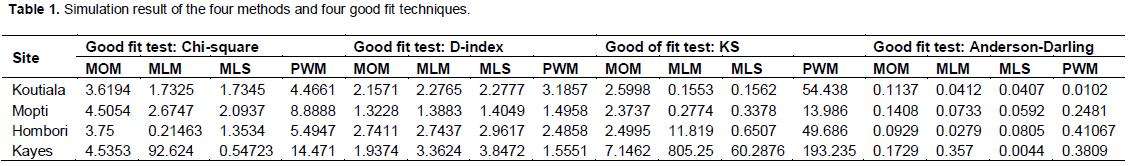
From Table 1, Anderson-Darling technique in general provided small values for all the methods then the other good fit test techniques. It may be noted that the good fit test technique of Anderson-Darling is suitable for the four methods: MOM, MLM, MLS and PWM, when compared with the other values given by Chi-square, D-index and Kolmogoro-Sminov test. Anderson-Darling good fit test for all the sites precipitation analysis is suggested. To improve the efficiency of the modeling, we proposed to use the return period and the standard error.
Return period
Estimation of rainfall for a desired return period is a pre-requisite for planning, which can be achieved by probabilistic approach involving fitting of probability distributions to the recorded data which can be done using the return period and the standard error. The return period is defined by Bedient and Huber (1948) as an annual maximum event that has a return period (or recurrence interval) of T years. The return period and the standard error are computed by the following formulas using the parameters  from Table 1 to compute the return period.
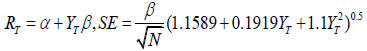
Where,  and T is the year (period). For the test, we used the lower and upper confidence limits (LCL and CL) of the estimated rainfall
  at 95% significance level for each return period (T) represented by:

RESULTS AND DISCUSSION
In order to make the final selected method for each site, we used the Anderson good fit test technique to compute the standard error and the return period, then we introduced the ratio of the standard error to return period for the period; the result of the simulation is presented in Table 2 as estimated in percent.
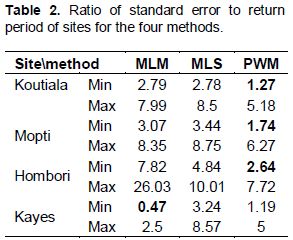
From Table 2, the minimum ratio (in bold) are 1.27, 1.74, 2.64 and 0.47 for Koutiala, Mopti Hombori (PWM method) and Kayes (MLM method), respectively. So, it may be noted that the percentage of variation of estimate precipitation between the upper and lower limit will be more suitable for small value of the ratio. Finally, the method PWM is considered for modeling the sites of Mopti, Koutiala, and Hombori using PWM and MLM for Kayes (Figure 3, 4, 5 and 6). The plotting of the return period is presented by Figures 3, 4, 5 and 6. The recorded and the estimated precipitation are also represented.


Figures 3, 4, 5 and 6 represent the plotting of the recorded and estimated precipitation using Gumbel Weibull distribution function for the sites of Mopti (Figure 3), Koutiala (Figure 4) and Hombori (Figure 6) using PWM and Kayes (Figure 5 using MLM), with confidence limit at 95% level.

The plot showed that the percentages of variations on trends in annual precipitation are strictly inside the confidence limits at 95% (between the UCL and UCL). We can conclude that the selected good fit technique (Anderson-Darling) and methods (PWM, MLM) for predicting are the best estimation.
CONCLUSION
Predicting and forecasting rainfall is very important in risk assessment and decision making. Any change in preci-pitation affects socio-economic developments and human livelihood. To reduce the risk, a prediction tool is neces-sary to improve the regional climate modeling.
Based on the limitation of the frequency analysis (Figures 1 and 2) due to the complexity of rainfall analysis, we proposed Gumbel Weibull probability function through the four methods of parameters computation (MLM, MLS, PWM and MOM). The four good fit tests are also used to estimate the efficient method. The results of the good test show the efficiency of Anderson-Darling techniques as compared to the Komorov-smirnov, D-Index and Chi-square proposed techniques. The results of the minimum ratio show the efficiency of PWM method for Koutial, Mopti and Hombori and MLM for Kayes precipitation modeling and predicting. The plotting results of the estimated and the recorded precipitation, show the efficiency of the selected method and test technique (Figures 3, 4, 5 and 6).
CONFLICT OF INTERESTS
REFERENCES
|
Anderson TW, Darling DA (1954). A test of Goodness of fit. J. Am. Stat. Assoc. 49(268):765-769. Crossref |
||||
|
Arthur JG, Maciunas JL, Matalas NC, Wallis JR (1979). Probability Weighted Moments: Definition and Relation to Parameters of several Distributions Expressable in Inverse Form. Water Resour. Res. 15(5):1049-1055. Crossref |
||||
| Bedient P, Huber W (1948). Hydrology and Flooding, Analysis. Addison Wesley Publishing Co. | ||||
| Bowman KO, Shenton LR (1985). John Wiley and Sons Canada. 5:467-453. | ||||
| Chausse P (2010). Computing Generalized Method of Moments and Generalized Empirical Likelihood with R." J. Stat. Softw. 34(11):1-35. | ||||
|
Consul PC, Shenton LR (1972). Use of Lagrangian expansion for generating generalized Probability distribution. SIAM J. Appl. Math. 23(2):239-248. Crossref |
||||
|
Consul PC, Shenton LR (1973). Some interesting properties of Lagrangian stributions. Commun. Statist. Simul. Computat. 2(3):263-272 Crossref |
||||
|
Cousineau D, Brown S, Heathcote A (2004). Fitting distributions using maximum likelihood: Methods and packages. Behav. Res. Methods Instrum. Comput. 36 (4):742-756. Crossref |
||||
|
Foxa P, Rockstrom J (2003). Supplemental irrigation of dry-spell mitigation of rainfall agriculture in the Sahel. Agric. Water Manage. 61:29-50. Crossref |
||||
| Gumbel EJ (1958). The Statistics of Extremes, New York: Columbia University Press. | ||||
| Hall AR (2006). Generalized Method of Moments (Advanced Texts in Econometrics). Oxford University Press. | ||||
|
Heathcote A, Brown S, Cousineau D (2004). QMPE: Estimating Lognormal, Wald and Weibull RT distributions with a parameter dependent lower bound. Behav. Res. Methods Instrum. Comput. 36:277-290. Crossref |
||||
| Helmert FR (1876). Ueber fie Wahrscheinlichkeit der Potenzsummen der Potenzsummen der Beobachtungsfehler und uber einige damit im Zusammenhange stehende Frragen. Zeitschrift für Mathematik und Physik 21:S.102-219. | ||||
| Isaic-Maniu A (1983). Metoda Weibull - aplicatii, Ed. Academiei, Bucharest. | ||||
| Jones PD, Osborn TJ, Briffa KR, Folland CK, Horton B, Alexander LV, Parker DE, Niasse M (2005). Climate Induced Water Conflict Risks in West Africa: Recognizing and coping with increased climate impacts on shared watercourses. An International Workshop organized by centre for study of Civil War, International Peace research institute, Oslo (PRIO) and Centre for International Environmental and Climate research at University of Oslo (CICERO) for the global environmental change and human security program (GECHS). | ||||
| Kandji ST, Verchot L, Mackenson J (2006). Climate change and Variability in the Sahel Region: Impacts and Adaptation Strategies in the Agricultural Sector. World Agroforestry Centre/United Nations Environment Programme. | ||||
|
Kolmogorov AN (1941). Confidence limits for an unknown distribution function. Annals of Mathematical Statistics. 12:461-463. Crossref |
||||
| Kolmogorov AN (1933). Sulla Determinazione empirica di une legge di distribuzione. Giornale dell'Istituto Italiano degli Attuari. 4: 83-91. | ||||
|
Landwehr JM, Matalas NC, Wallis JR (1978). Some comparisons of flood statistics in real and log space. Water Resour. Res. 4(5): 902-920. Crossref |
||||
|
Landwehr JM, Matalas NC, Wallis JR (1979). Probability weighted moments compared with some traditional techniques in estimating Gumbel parameters and quantiles, Water Resour. Res. 15(5):1055-1106 Crossref |
||||
| Manik D, Datta SK (1998). A comparative study of estimation of extreme value. J. River Behav. Control 25(1):41-47. | ||||
| Mezbahur R, Larry MP, Herbert CH (2006). A modified Anderson-Darling Test for uniformity. Bull. Malays. Math. Sci. Soc. 20(1):11-16. | ||||
|
Phien HN (1987). A review of methods of parameter estimation for the extreme value type–1 distribution. J. Hydraulics 90 (3 & 4): 251-268. Crossref |
||||
| Udual CUI, Ini DE (2012). Analysis of Rainfall Trends in Akwa Idom State, Nigeria. J. Environ. Earth Sci. 2(8):60-70. | ||||
| United States Water Resources Council (USWRC) (1981). Guidelines for determining flood flow frequency, Bulletin. 17B:50 | ||||
| Vishwa N M, Diwinder K A (2013). Exact Modelling and Analytical Study of Annual Maximum Rainfall with Gumbel and Frechet Distributions Using Parameter Estimation Techniques World of Sciences Journal. (02). | ||||
| Vivekanandan N (2013). Inter-comparison of parameters of Gumbel Distribution for Rainfall Frequency Analysis. J. Environ. Sci. Comput. Sci. Eng. Technol. 2(4):1336-1346. | ||||
|
Zhang J (2002). Powerful goodness-of-fit tests based on the likelihood ratio. J. R. Stat. Soc. 64(2):281-294. Crossref |
||||
Copyright © 2024 Author(s) retain the copyright of this article.
This article is published under the terms of the Creative Commons Attribution License 4.0


