ABSTRACT
In this study, healthcare waste (HCW) generated in four referral hospitals in Tanzania namely: Muhimbili National Hospital (MNH), Kilimanjaro Christian Medical Center (KCMC), Bugando Medical Center (BMC) and Tumbi Regional Referral Hospital (TRRH) was characterized to establish its feasibility for energy recovery. The HCW collected and loaded into the incinerators was weighed and its composition determined (as highly infectious, infectious, sharps and non–infectious waste). To achieve effective energy recovery, waste segregation and color coding system were assessed. The moisture content and heating values of the waste were determined experimentally, ranging from 9.3 to 9.9 MJ/kg. Using interviews, direct observations and field measurements, the HCW generation rates, number of patients per day, number of beds and incineration rates in each health care facility were determined. Results indicated that the HCW generated were 2345, 789, 807 and 232 kg/day at MNH, KCMC, BMC and TRRH, corresponding to 1.34, 1.02, 1.1 and 0.76 kg/capital/day, respectively. The major component of the waste stream was infectious waste (which ranged from 34 to 76%). The moisture content ranged from 16 to 72% with the mean value of 43%. Further analysis on the characteristics of HCW indicated high potential for energy recovery from waste incineration.
Key words: Waste characterization, waste generation rate, waste segregation, moisture content, calorific value of waste, composition of healthcare waste, incineration, heat recovery.
Healthcare waste is the waste that is collected from hospitals, clinics and medical offices, ambulatory, surgical center, urgent care clinics, nursing homes, blood banks, birth centers and hospice homes (WHO, 2000). According to Diaz et al. (2008) developing countries face severe problem in managing the healthcare waste (HCW) because segregation of waste at the production point is not done adequately and in most of these countries HCW is still handled and disposed of together with domestic waste. According to Yu et al. (2014), the composition of HCW differs from one healthcare facility (HCF) to another depending upon the economic and cultural status of the patients and condition of the area where the HCF is located. Most literature give explanations about the risks associated with HCW such as air pollution and human health risks, but few literatures consider HCW as potential sources of heat energy (Bujak, 2009). Furthermore, in developing countries, energy reach waste which is potential for energy recovery is discarded. Mohee (2005) revealed that, an understanding of the characteristics of the waste to be incinerated is an important step for waste to energy practices. WHO (2016) pointed out that healthcare waste can be characterized by quantity, composition, bulk density, color coding and heating value. Diaz et al. (2008) contended that for energy recovery practices, it is necessary to characterize waste by quantity, composition as well as by heating value. WHO (2007) also suggested that, waste should be characterized according to material or its classification (e.g., sharps or infectious, pathological, chemical, radioactive, or non–risk waste, and by waste generation rate. Manyele and Lyasenga (2010) stated that if HCW is not properly sorted during generation, its handling becomes even more difficult due to contamination and sharps injuries. In the absence of adequate information on the characteristic of waste, it is not possible to design incineration plant for heat energy recovery. UNEP (2012) reported the type of waste treatment technology to be dependent on waste characteristic, environmental concerns and legal requirements in the specific region.
Marinkovic et al. (2008) reported that in the developed countries, hospital waste is segregated into color-coded and labeled bags or containers, but in developing countries, the implementation of the standards varies from one place to another. Bdour et al. (2007) describe the related issues to be lack of proper source segregation, lack of color coding and lack of records relating to waste composition and quantity. Consequently, some waste components such as pharmaceutical and domestic waste are mixed together. Stankovi? et al. (2008) pointed that in some cases, nothing is segregated except sharps. Shareefdeen (2012) revealed that sometimes carelessness of the paramedic staff results in mixing of non-hazardous waste and hazardous waste items such as human organs and radioactive items. Hence lack of source segregation, lack of color coding, lack of record keeping and carelessness of the staff are observed as some of the main issues leading to poor segregation practices across HCFs in the developing countries. Kagonji and Manyele (2011) reported that in Tanzania waste segregation is not done at the generation points because of poor environmental awareness as well as lack of financial capacity to procure waste bags and waste bins for segregation of waste. Waste collectors usually transfer some of the waste mixed up irrespective of the types and hazards posed by the waste involved. In this research, waste segregation at the selected HCFs is studied.
In Tanzania, generation of healthcare waste (HCW) has increased in the past ten years due to the increased number and size of HCFs, medical services and use of disposal medical products. In the study by Manyele and Lyasenga (2010) it was reported that there was a serious inadequacy in handling medical solid wastes in Dar es Salaam City. Due to poor control of wastes, hazardous wastes reached the dumpsite without notice. In addition, they have reported that, data on waste generation in Dar es Salaam was in adequate, making it difficult to plan for an efficient medical waste management system. Currently, within the HCFs in Tanzania, waste characterization is done only by color coding. According to Eleyan et al. (2013) color coding allows the waste to be categorized as highly infectious, infectious, non-infectious and sharps. In this study, HCW from the selected HCF’s in Tanzania were characterized by quantity, composition and heating value notably, an understanding of the composition of HCW is fundamental for deciding on waste handling disposal alternatives and hence on WTE options. Diaz et al. (2008) pointed that proper characterization of the waste can also prevent accidents and exposure to waste by handlers including operators of the treatment facility. Waste characterization also provides the knowledge about heating value which is important when considering heat recovery from the incineration of waste (Bujak, 2010).
Calorific value of waste
Calorific value of medical waste is an important data for incineration, which governs the design and operation parameters of the incinerators. According to Yu et al. (2014), calorific value of waste is governed by the composition of the waste. In order to estimate the calorific value of the waste mix an average of the waste composition is found. Bujak (2010) revealed that knowledge of the low calorific value of the waste enables the estimation of the quantity of secondary fuel or the determination of the energy efficiency of an incinerator that integrates heat recovery system. Yu et al. (2014) pointed that a material can burn without supporting fuel when it has a calorific value of minimum 14.4 MJ/kg, this is almost dry wood. Bujak (2010) contended that, to know the overall calorific value of the waste, one need to measure the calorific value or estimate by analyzing the waste composition. Mohee (2005) commented that if the amount of waste is known, and the calorific value of the waste is known, it is possible to design the size of the incinerator and flue gas treatment system. According to Bujak (2010), there are two kinds of methods of measuring calorific value currently. The first is to estimate the calorific value of waste by element analysis (proximate analysis); the second is to measure calorific value of mixed sample by Bomb Calorimeter (ultimate analysis). However, there are great differences between the measured value by these two methods and the actual value because of the complex chemical elements of HCW. Since the ultimate analysis requires very expensive equipment and highly trained analyst, this research has opted for proximate analysis which requires standard laboratory equipment which is easy to run by a well-equipped scientist or engineer. In proximate analysis as the model for determining HHV/CV, the applied calculations are performed using Equation 1:
HHV = 0.3536FC + 0.1559VM – 0.0078AC (1)
where, VM = Volatile matter; FC = Fixed carbon; HHV = high heat value (in MJ/kg)
Colour coding for waste containers
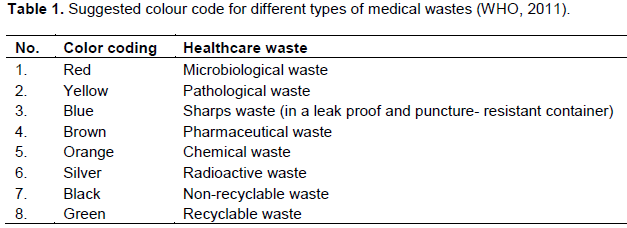
Surveys have shown that an appropriate method of characterizing and segregating the waste is by sorting the waste into different colour code. However, there is no standard colour code to follow by all countries for the medical segregation. In this research, characterization of HCW according to color coding established by the WHO, have been studied.
According to Marinkovic et al. (2008) the element that is a deficiency in the existing colour coding system for the medical waste segregation is, unavailable of different containers for the subdivisions of medical waste. WHO (2011) recommends the subdivision of medical wastes as followed: microbiological waste, pathological waste, sharps, pharmaceutical waste, chemical waste, radioactive waste, non-recyclable waste and recyclable waste. Therefore, different colour coding has to be assigned to different waste for effective segregation. Thus, the recommended colour codes with few amendments are as shown in Table 1. According to WHO (2011), all waste must be segregated at the point of generation and all containers must bear international symbols with appropriate coding. Containers should never be filled above the ¾-full line indicated on the safety box.
Heat recovery from HCW
Bujak (2010) revealed that during the incineration, energy in the form of heat can be recovered from the incineration plant and be used for other purposes. He pointed that this is called waste to energy or energy from waste. Waste-to-energy (WtE) or energy-from-waste (EfW) is the process of producing energy in the form of heat from the primary treatment of waste or the processing of waste into a fuel source. Kothari et al. (2010) contended that most WtE processes generate electricity and/or heat right through combustion, or produce a combustible fuel commodity, such as methane, methanol, ethanol or synthetic fuels. Bujak (2009) reported that countries or regions with successful energy-from-waste sectors have ensured that energy-from-waste goals are incorporated into both their energy policies and their waste management policies. For example, in 2000, the European Union announced a “Green Paper” designed to protect energy resources, and established a road map to accomplish renewable energy targets. At the same time, it has forbidden the direct landfilling of wastes that can be converted to energy, in line with the Landfill Directive published in 1999. Psomopoulos et al. (2013) reveals that in Europe, heat and electricity from waste, distributed to households and industry substitutes the energy produced by conventional power plants, using fossil fuels. This helps to cut down CO2 emissions and to reach the goal of 20% reduction of greenhouse gases by 2020.
Despite of its potential benefits to healthcare facilities in Tanzania, energy recovery from incineration of HCW has not been fully practiced because of a number of challenges. Bujak (2009) pointed that (WtE) project must meet certain basic requirements. In particular, the energy content of the waste, the so-called lower calorific value (LCV) of the waste must be at least 6 MJ/kg or above, throughout all seasons. The annual average lower calorific value must not be less than 7 MJ/kg (UNEP, 2012). The specific composition of the waste is also important. For instance, an extreme waste composition of only sand and plastics is not suitable for incineration, even though the average lower calorific value is relatively high. Furthermore, in order to operate the incineration plant continuously for energy recovery, waste generation must be fairly stable during the year.
Study areas
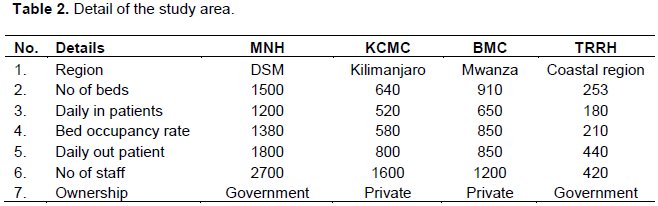
Muhimbili National Hospital (MNH), Kilimanjaro Christian Medical Centre (KCMC), Bugando Medical Centre (BMC) and Tumbi Regional Referral Hospital (TRRH) were chosen to be the study areas in order to have comparison between National Referral Hospital (MNH) and other referral hospitals that are up country, with adequate interactions as indicated in Table 2. Also, to have difference between government and private owned facilities. The selected HCF was also suitable for this research in terms of availability of adequate information and data.
Data collection methods
Methods of data collection used in this study were interviews, direct observations on the waste management practices and direct measurements of the waste. In determining quantities of waste, healthcare workers were oriented on waste segregation. Waste was thus collected already segregated at the production point from every department and service delivery points. Composition of the waste from each HCF was observed and noted according to labels on the polythene bags, namely; high infectious waste, infectious waste, sharps, non–infectious waste and food waste, following colour coding procedures as recommended by WHO (2011). Other wastes such as radioactive waste, pharmaceutical waste and pressurized containers were not included in this study due to the fact that they cannot be incinerated. The waste was then weighed using top loading balance (model MB 640). The weighing exercise continued for 28 days. The average of waste generated per day was determined using Equation 2:

where w = average waste generated per day, wi = daily waste generation recorded for n days.
The aim of conducting HCW weighing exercise was to determine the amount of waste which was collected at each HCF per day. Data obtained were used in the selection of proper type of incineration facility that could incinerate the waste collected at the particular HCF, aiming at recovering energy from the incineration of the waste. According to Diaz (2005), the design capacity of the incineration facilities normally ranges from 20 kg/h for intermittent duty, pathological and non-pathological systems to 2,830 kg/h for continuous-duty systems. For batch units, the capacities range from 70 kg/batch to 1,720 kg/batch. Appropriate precautions were taken during measurements whereby; protective gears like gloves, coats, and mask were worn as Personal Protective Equipment (PPE) for hygiene purposes.
Determination of waste composition
Since waste was collected already segregated in color coded bags, each bag was weighed separately, thus the percentage composition of each waste category was found using Equation 3:
where, wcd = total waste collected per day (kg/day); Pc = percentage composition of each waste category (%), and wj = total waste category generated per day (kg/day).
Determination of moisture content (MC)
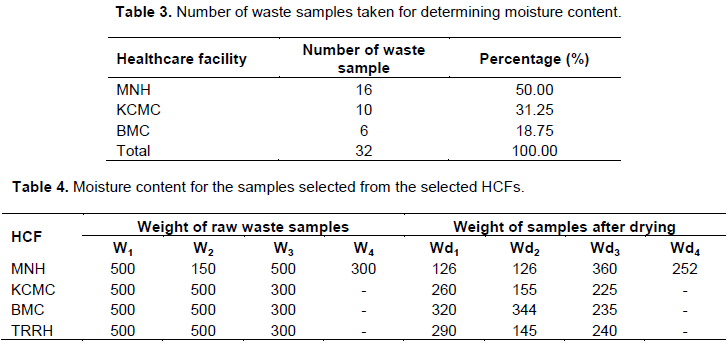
Table 3 shows the number of waste samples taken during laboratory analysis for determination of moisture content. A total of 32 samples were analyzed.
Table 4 summarizes distribution of waste samples collected from different HCFs during laboratory analysis for moisture content determination. The weights of samples after drying for 2 h at 105oC are also indicated. In Table 4, all symbols denoted by W, stands for measured weights, whereby, W1 = fraction of all HCW; W2 = pieces of boxes and papers; W3 = food waste; W4 = yard waste and pieces of boxes; Wd1 = fraction of all HCW after drying; Wd2 = pieces of boxes and papers after drying; Wd3 = food waste after drying; and Wd4 = yard waste and pieces of boxes after drying.
The moisture content of HCW was measured by using oven drying method. The empty dried crucible was weighed, and then the sample was placed on it and weighed together. Then they were dried in the oven at 105oC for 2 hours and weighed again. Then they were dried in the oven at 105oC for 2 hours and weighed again. The moisture content of the sample was calculated using Equation 4:
Determination of high heating value (HHV) of HCW
In this study, each of the 32 samples used for determining moisture content was used to determine the HHV (calorific value). Yu et al. (2014), defined Calorific value as the amount of heat released for every unit dry mass of the waste burnt. Waste with high calorific value produces more heat than those with low values. According to Bujak (2015a, b), high amount of heat produced by dry waste provide additional fuel for incinerating the waste thus reducing the overall cost for fuel. If the released heat is significant, heat energy recovery options can be considered. A high calorific measurement implies that the waste could be suitable for incineration combined with heat energy recovery (Yu et al., 2014).
Laboratory analysis
In order to establish thermal energy potential (Calorific value) of HCW, proximate analysis which involve determination of moisture content as physical characteristics, volatile matter, ash content and fixed carbon was performed. The proximate analysis was done in order to estimate the calorific value of HCW. Samples from MNH, KCMC, BMC and TRRH were distributed in different categories for execution of proximate analysis.
Volatile matter (VM)
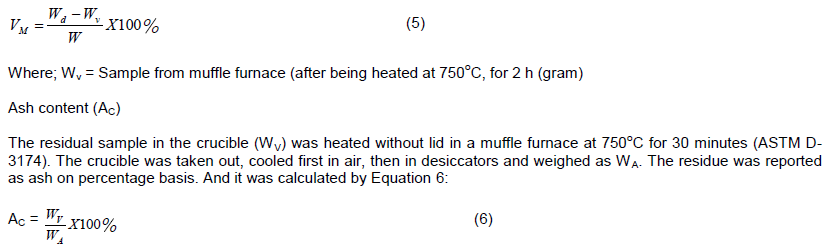
The crucible with samples after drying (Wd) which was used during measurement of moisture content was covered with lid and then taken into muffle furnace, which was maintained at 950oC for 7 minutes (ASTM D-3175). The sample was cooled in air and weighed again as Wv. Loss in weight was reported as a volatile matter on percentage basis. Equation 5 shows the calculation of volatile matter.
Where; Wv = Sample from muffle furnace (after being heated at 750oC, for 2 h (gram)
Ash content (AC)
The residual sample in the crucible (WV) was heated without lid in a muffle furnace at 750oC for 30 minutes (ASTM D-3174). The crucible was taken out, cooled first in air, then in desiccators and weighed as WA. The residue was reported as ash on percentage basis. And it was calculated by Equation 6:
Fixed carbon (FC)
Since the material composition (100%) comprises of MC, VM, AC and FC, then to calculate FC was just matter of algebra. FC was calculated using Equation 7:
FC % = 100% - (%AC + %VM + % MC) (7)
The High Heating Value (calorific value) for each selected sample was calculated using Equation 8:
HHV = 0.3536FC + 0.1559VM – 0.0078AC (MJ/kg) (8)
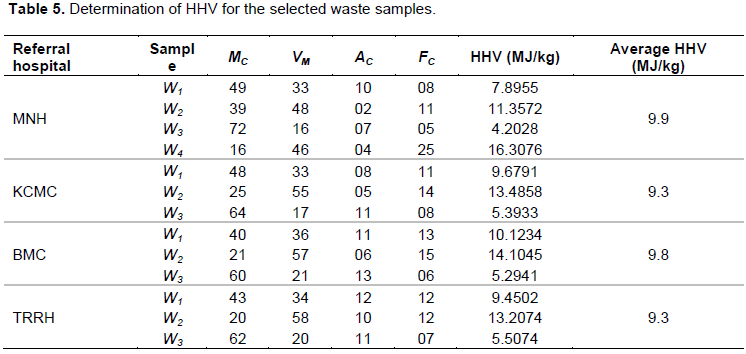
Details are given in Table 5 for the four referral hospitals.
Estimation of Heat generation from waste incineration using HHV, data generated experimentally, the heat that can be generated from the waste for a given referral hospital was estimated from Equation 9:
Qgen = HHV x Wt (9)
where, Wt = waste generation rate per day, excluding food waste.
Total HCW generation in the selected HCFs
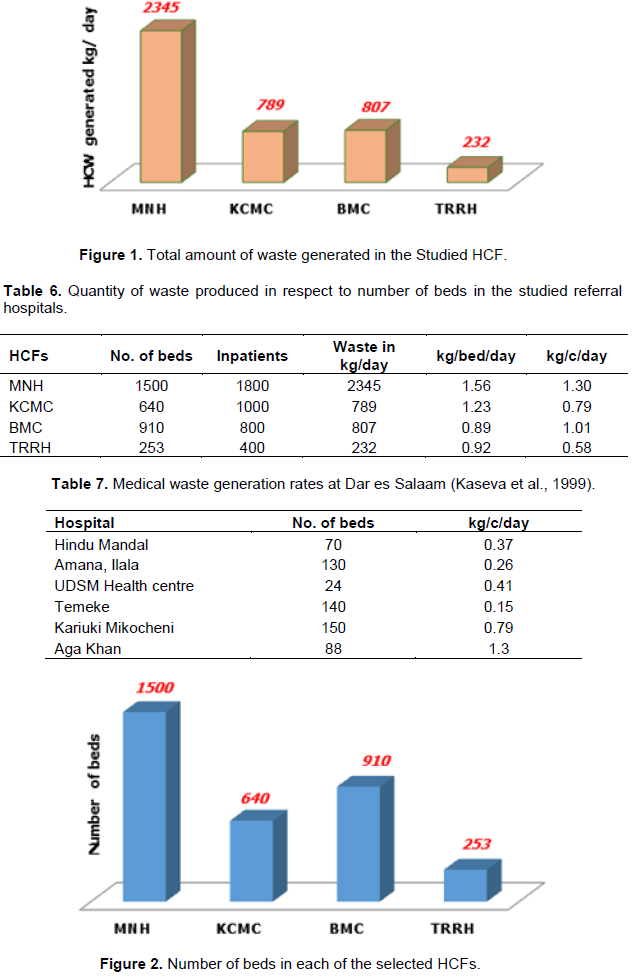
The amount of HCW generated were established to be 2345, 789, 807 and 232 kg/day in MNH, KCMC, BMC and TRRH, respectively, as shown in Figure 1. Another study on HCW generation rate in Dar es Salaam (Manyele, 2004), which included four sampled HCF’s, (MNH, Mwananyamala, Agha Khan and University of Dar es Salaam health centre, established generation rate at MNH to be the highest. This study has established similar results in referral hospitals as indicated in Figure 1. Also, results from this study have shown that the lowest generation rate and per capital in the studied HCFs was from TRRH which has a generation rate of 232 kg/day and the generation rate of 0.76 kg/c/day. Literature data on the other hand, shows higher rate of medical waste generation of about 2,250 kg/day in Amana and 2,500 kg/day in Ligula hospital (Kagonji and Manyele, 2011).
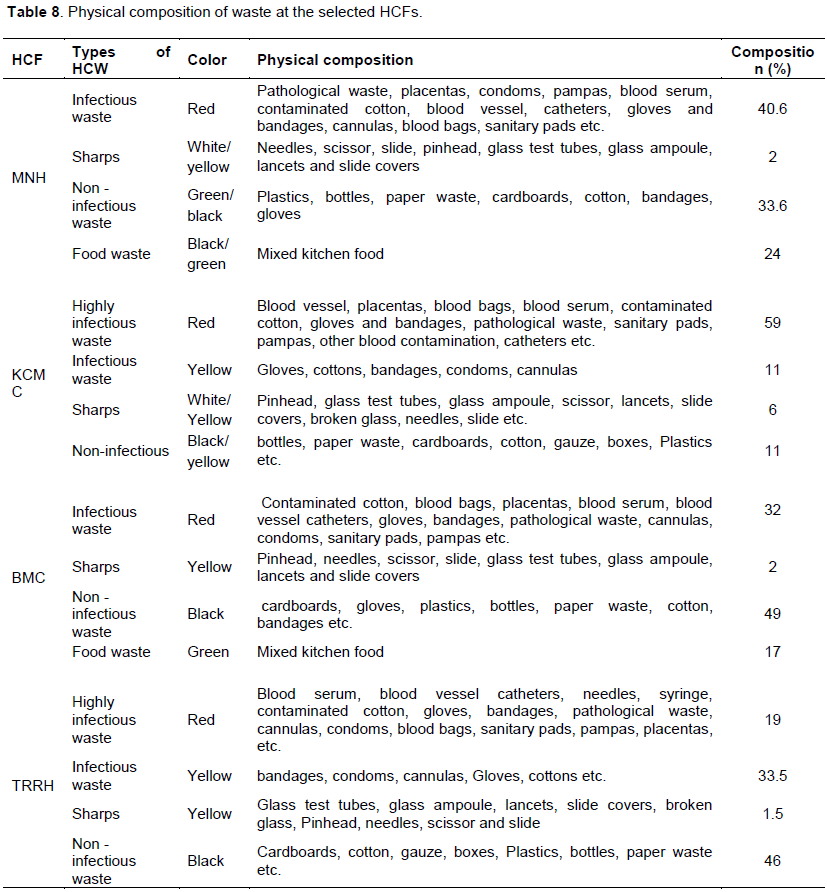
According to Anicetus et al. (2020), waste generation rates were reported to be 325, 299, 143.4 and 232 for MNH (based on waste collected at the small-scale incinerator), Mwananyamala Regional Hospital, Ilala Regional Hospital and Temeke Regional Hospital, respectively. Also, another study (Manyele, 2004) which was conducted outside Dar es Salaam reported that the rate of waste generation at a given hospital increases with the number of beds available and the occupancy rate (Table 6 and 7). This study has established similar results as presented in Tables 6 and 7. Figure 2 indicates the number of beds in each of the selected HCFs. Table 8 summarizes the color codes used for different HCW as observed in the selected zonal referral hospitals, composition of which was estimated by actual measurements as reported also by Kagonji and Manyele (2011).
Waste generation rate based on number of patients
Results obtained indicated that the mean value of waste generation rate was 1.30, 0.71, 1.00 and 0.51 kg/c/day for MNH, KCMC, BMC and TRRH, respectively, as indicated in Figure 3. In another study (Mato and Kaseva, 1999), it was indicated that waste generation for other HCFs in Dar es Salaam City (Hindu Mandal, Aana, UDSM Health Centre, Temeke, Kariuki-Mikocheni, and Aga Khan were established to be 0.37, 0.26, 0.41, 0.15, 0.79, and 1.3 kg/c/day, respectively. Comparing with the results presented in Figure 3, it is evident that generation rate at referral hospitals is higher compared to other lower grade hospitals. According to Kagonji and Manyele (2011), waste generation rate per patient per day was also high about 1.8 (Amana) and 2.0 kg/c/day (Ligula), values of which are higher than those reported in Figure 3.
Waste generation rates based on number of beds
Waste generation rate (kg/bed/day) varied from the lowest (0.91) observed at TRRH to the highest (1.56) observed at MNH. Despite the large number of beds at MNH, the higher rate of waste generation shown in Figure 4 is an indication of higher generation rate in kg/day compared to other HCFs. This can be attributed to the large number of services offered, number of patient’s effective waste collection and onsite transportation and storage.
Waste generation in different departments according to waste category
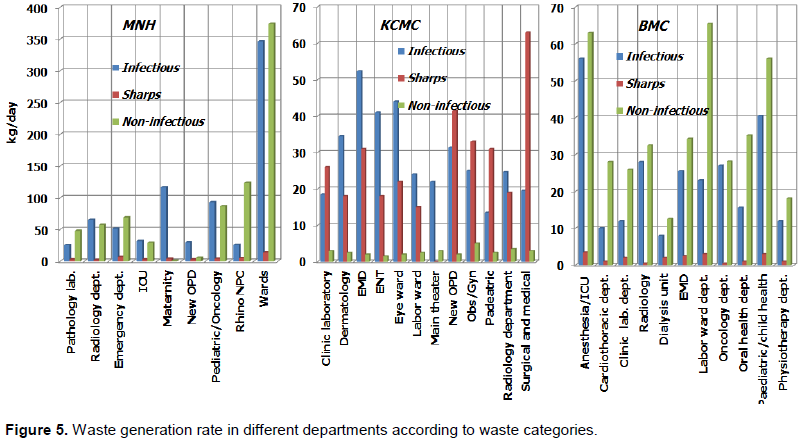
In this study waste in each department was categorized according to waste category namely infectious, sharps and non–infectious. The study reveals that the highest amount of waste generated at MNH was non–infectious in wards, while at KCMC it was sharps in surgical and medical wards. In BMC it was non–infectious in labour ward as indicated in Figure 5. The study reveals further that, among the studied HCFs, all departments at KCMC produced the highest amount of sharps waste, BMC produces the highest amount of non–infectious waste, and BMC produces the lowest amount of sharps waste as indicated in Figure 5. According to Matee and Manyele (2015), the labour ward produced the highest amount of sharps waste followed by Pediatrics ward at MNH. Additionally, higher values of sharp waste generation observed outlines the days with high demand on medical services due to emergency cases referred. Also, this implies that waste generated at KCMC is suitable for incineration with energy recovery because the composition of waste generated contains the highest amount of sharps waste when compared to MNH and BMC. Matee and Manyele (2015) revealed that, during the incineration process, sharps waste plays a big contribution to maximum temperature in the combustion chambers, thus, waste composition and the amount of waste fed into the incineration facility contributes to the incinerator performance. The study also revealed that waste composition at MNH contains the lowest sharp waste generation rate.
Total waste generation rates in different departments
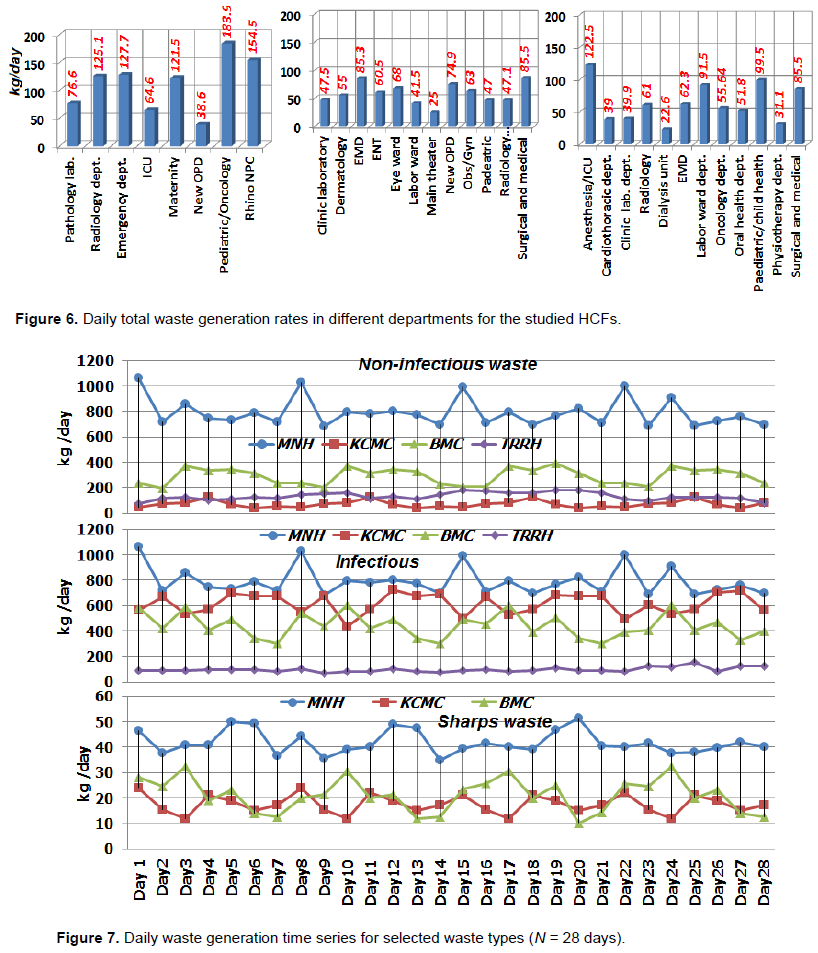
The study on medical waste generation per department in kg/day in each of the research centers (sectional overview) revealed that the highest waste generation rate in MNH was 183.9 in pediatric or oncology, KCMC 85.5 in surgical and medical, BMC 122.5 in Anesthesia/ICU, respectively as indicated in Figure 6. Likewise, the lowest waste generation rate in MNH was 38.6 in OPD, KCMC 25 in theatre and BMC 22.6 in dialysis unit. In most of HCFs, the highest waste generation was found to occur in surgical and gynecology, orthopedic. Medical department produces the lowest amount as reported in the literature (Manyele, 2004). It is worth noting that such inconsistence in waste generation rates is due to the nature of activities performed in each department, number of patients, and nature of treatments in each department. Additionally, such overview will assist the hospital management to prepare effectively waste management weekly reports and annual cost for the waste disposal.
Daily waste generation data for selected waste types
The study reveals that the highest amount of non–infectious waste was produced in MNH, While KCMC generated the lowest amount of non–infectious waste. Also, the study showed that the highest infectious waste was generated in MNH, and the lowest amount was at TRRH. Likewise, the highest amount of sharp waste was generated in KCMC, while the lowest amount was in MNH as indicated in Figure 7. The inconsistence is due to the nature of treatment, technology used and level of waste segregation.
Composition of HCW
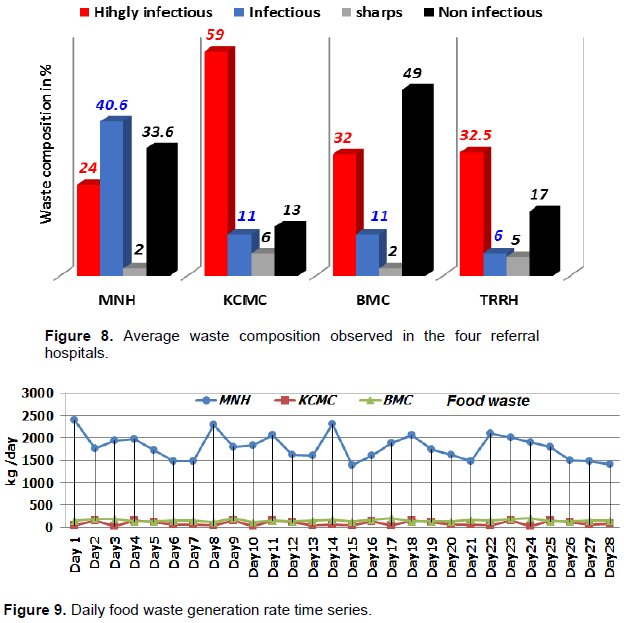
In this study, the composition of HCW was determined by considering types of HCW generated, colour coding and physical composition. Since waste was collected already segregated in colour coded bags, each bag was weighed separately. Thus the percentage composition of each waste category was found. Results show that a substantial amount of waste consisted of paper products, bottles, plastic and textiles in the form of cotton and gauze. Results also show that, the major components in the medical waste stream was hazardous (from 34% to 76%), as indicated in Figure 8. This result indicates that, the percentages of hazardous waste in the studied HCF’s are higher compared to the amount given by WHO (2015) which ranges between 10-25%. This is because segregation of the waste at the production point was not properly performed, so hazardous waste was mixed with non-hazardous waste.
In this study, waste segregation by color coding was assessed in four referral hospitals. Results show that KCMC generates 59% of highly infectious waste. This is the highest amount compared to the other selected HCFs as indicated in Figure 8. The reason can probably be that in KCMC the waste was poorly segregated at the production point in such a way that highly infectious waste was mixed with general waste. The other types of waste such as pharmaceutical, chemical, radioactive, recyclable and non-recyclable were not identified in this study because of poor segregation practices. However, there is no typical color code to follow by all countries for the HCW segregation.
Food waste generation rate as a candidate for energy recovery via bio-digestion
The study discovered that the highest amount of food waste was generated at MNH as indicated in Figure 9. In the studied HCFs, food waste generated is incinerated together with infectious waste. Paratosh et al. (2017), revealed that conversion of food waste into energy via anaerobic processes in terms of methane is economically worthwhile. According to Babalola (2020), the most appropriate alternative aimed at handling food waste is anaerobic digestion followed by composting. Incineration turn out to be the third most suitable alternative in terms of the overall results, while landfilling is presumed to be the worst case because of the substantial costs and low benefits. Generated waste at MNH is suitable for energy recovery via bio–digestion, for generation of bio gas but less suitable for incineration with energy recovery because food waste contains low calorific value.
Food waste generation in the studied HCFs
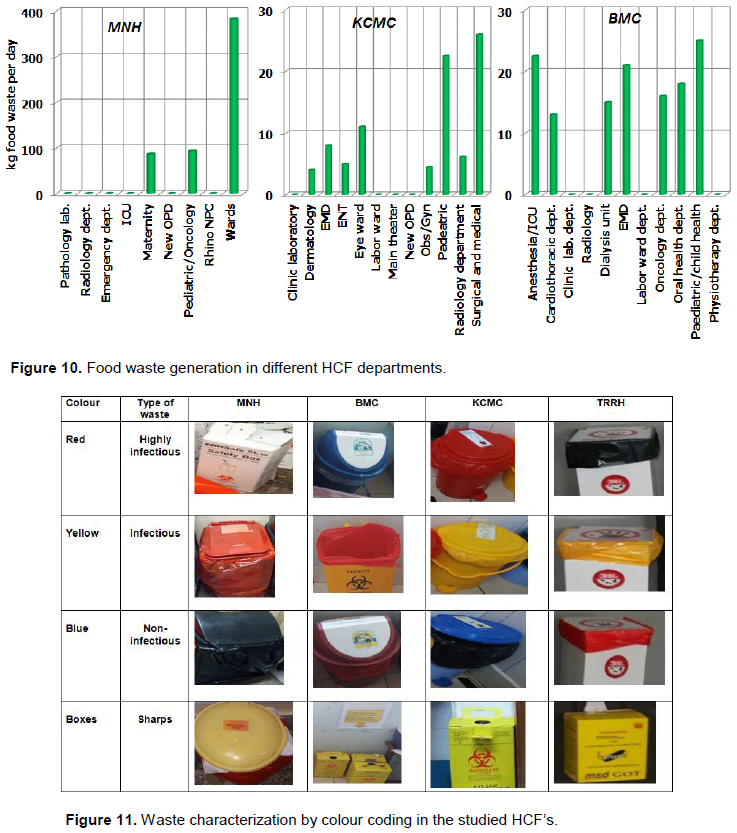
The study revealed that, departments that generated the highest amount of food waste were wards, surgical and medical, and pediatric in MNH, KCMC and BMC respectively as indicated in Figure 10. The amount of food waste generation depends on several factors such as the rate of in patients and bed occupation rates.
Color coding
Color coding surveys have shown that an appropriate method of identifying and segregating the waste is by sorting the waste into different colour code (WHO, 2011). The deficiency in the accessible colour coding system for the HCW segregation is unavailability of different containers for the subdivisions of the waste. WHO (2011) has suggested subdivision of HCW as follows: microbiological waste, pathological waste, sharps, pharmaceutical waste, radioactive waste, non- recyclable waste and recyclable waste. Thus, different colour coding has to be assigned to different waste for effective segregation as indicated in Table 1. Figure 10 shows the practical interpretation of waste characterization by colour coding in the studied HCFs. From these findings, waste bins covered with respective coloured polyethylene bags were expressed as flows: highly infectious waste-red; infectious waste–yellow and non-infectious waste-black/blue. Sharps waste is collected in the sharps box, yellow coloured as indicated in Figure 11. However, WHO (2011), has recommended further subdivision of the waste collected as indicated in Table 1.
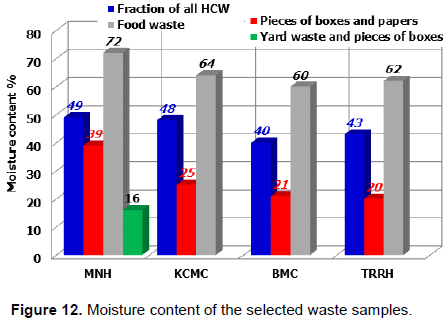
Moisture content of waste
In this study, the moisture content of each of the analyzed sample was obtained, and the average moisture content was calculated, as shown in Figure 12. Results indicated that moisture content ranged from 16 to 72% with the mean value of 43% High moisture content of the waste reduces the heating value of the waste that causes the waste to consume more fuel when incinerated. This study has indicated that average HCW moisture content was high compared to the given standard of 15% by the total weight of the waste (UNEP, 2012). This implies that, more fuel will be needed for the incineration process.
Calorific value (heating value) of HCW
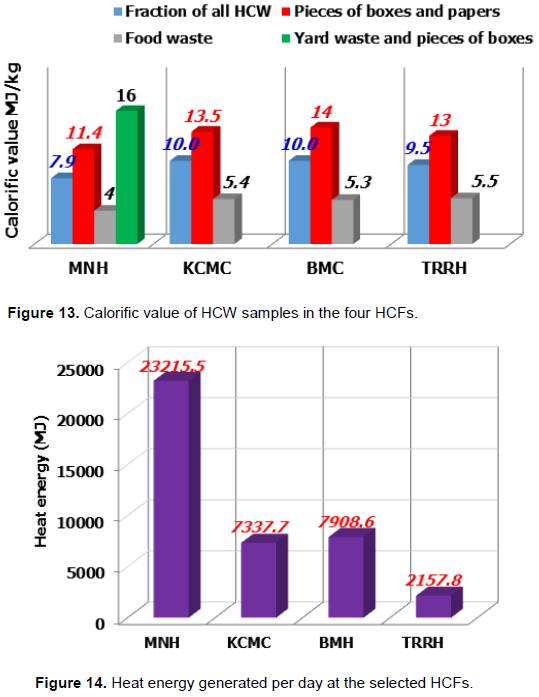
The average calorific value measurements of all samples from MNH, KCMC, BMC and TRRH were 9.9, 9.3, 9.8 and 9.3 MJ/kg, respectively as presented in Table 5. The results show that yard waste and pieces of boxes have the highest percentage calorific value of 16 as presented in Figure 13. The average calorific value of the HCW in MJ/kg ranged from 9.3 to 9.9 with mean value of 9.5. This value is above the recommended value of 7 MJ/kg (UNEP, 2012). This implies that the waste is suitable for incineration with heat energy recovery.
Estimate of heat that can be generated via incineration based on HHV
The study found out that, heat energy recovered from the incineration of the HCW per day was 23215.5, 7337.7, 7909.6 and 2157.8 MJ/day at MNH, KCMC, BMC and TRRH, respectively, as indicated in Figure 14. The study revealed that, incineration capacity suitable for incineration of the generated waste can range from 50 to 120 kg/h for all the selected HCFs. Based on the results obtained from this study, waste generated from the selected HCFs can be incinerated with energy recovery.
The amount of waste generated at MNH, KCMC and BMC was enough for the sustainable energy recovery except for TRRH. Also, the generation rates at referral HCFs was higher compared to other lower grade HCFs. MNH had the highest waste generation rate based on number of beds among the studied HCFs due to the fact that MNH is the biggest HCF in Tanzania with big number of patients, thus with various services offered. All departments at KCMC produced the highest amount of sharps waste compared to MNH and BMC which produced the lowest amount. This implied that waste generated at KCMC was more suitable for incineration with energy recovery. Surgical, gynecology and orthopedic were the departments which produced the highest amount of waste compared to medical which produced the lowest amount. The inconsistence in waste generation rates is due to nature of activities performed in each department. The results from this study will assist the HCFs management to effectively prepare weekly waste management reports and annual cost for the waste disposal. The highest amount of food waste was generated at MNH which also generated the lowest amount of sharps waste. Thus, waste generated at MNH is suitable for energy recovery via bio – digestion which generates bio gases but less suitable for the incineration with energy recovery since food waste contains low calorific value.
Waste segregation was done through color coding, however, for effective waste segregation further subdivision according to WHO (2015) can properly identify kinds of waste to be incinerated in order to provide room for waste circulation which is really practiced in Tanzania. The percentage of hazardous waste produced was high (34-75%) compared to the amount provided in literatures which ranged between 10 and 25%. This implies that waste segregation at the production point was inadequately performed. Also, the mean value of the moisture content of the waste generated was 43 percent which is high compared to the value of 15 percent by the total weight of the waste from the literatures. This implies that more fuel was needed for the incineration process. Also, the mean average calorific value for the HCW generated was above from the recommended value in the literatures. This implies that waste generated was suitable for incineration with energy recovery. The estimated heat energy recovered in MJ that can be generated via incineration based on HHV for the generated waste was 23215.5, 7337.7, 7908.6, and 2157.8 for MNH, KCMC, BMC and TRRH respectively. This implied that heat energy can be recovered from the incineration of waste generated at the studied HCFs.
Findings provide information to the hospital decision makers and health workers for improvement of waste characterization practices. Also, this study has established a data base of information on the requirements for the heat energy recovery from the incineration of HCW. This study has shown that all studied HCF have enough HCW generation rate that encourages stakeholders and administrators to pay attention and promote strategies that will result in reducing the cost of incineration of HCW by practicing heat energy recovery. Based on the findings of this study, it is recommended that, waste characterization is a useful practice, since it gives information to hospital decision makers and implementers about the actual quantity, composition, and heating value of HCW for heat energy recovery purposes.
The authors have not declared any conflict of interests.
REFERENCES
|
Anicetus H, Manyele S, Saria J, Mbuna J (2020). Assessment of air pollutant emissions from healthcare waste incinerators of different design features. African Journal of Environmental Science and Technology 14(10):311-328.
|
|
|
|
Babalola MA (2020). A Benefit Cost Analysis of Food and Biodegradable Waste Treatment Alternatives. Sustainability 12(1916):1-17.
Crossref
|
|
|
|
|
Bdour A, Altrabsheh B, Hadadin N, Al-Shareif M (2007). Assessment of medical waste management practice: A case study of northern part of Jordan. Journal of Waste Management 27:746-759.
Crossref
|
|
|
|
|
Bujak J (2010). Experimental Study of the Lower Heating Value of Medical Waste. Polish Journal of Environmental Studies 19(6):1151-1158.
|
|
|
|
|
Bujak J (2015a). Production of Waste Energy and Heat in Hospital Facilities. Energy 91:350-362.
Crossref
|
|
|
|
|
Bujak J (2015b). Thermal Treatment of Medical Waste in a Rotary Kiln. Journal of Environmental Management 162:139-147.
Crossref
|
|
|
|
|
Bujak J (2009). Experimental Study of the Energy Efficiency of an Incinerator for Medical Waste. Challenges and Opportunities. Energies 8(12):14182-14196.
|
|
|
|
|
Diaz LF (2005). Editorial| Waste Management-Volume 25, Issue 6.
Crossref
|
|
|
|
|
Diaz LF, Eggerth LL, Enkhtsetseg SH, Savage GM (2008). Characteristics of Health- Care Waste. Waste Management 28(7):1219-1226.
Crossref
|
|
|
|
|
Eleyan D, Al-Khatib IA, Garfield J (2013). System Dynamics Model for Hospital Waste. Characterization and Generation in Developing Countries. Waste Management and Research 31(10):986-995.
Crossref
|
|
|
|
|
Kagonji IS, Manyele SV (2011) Analysis of the Measured Medical Waste Generation at Amana and Ligula Hospitals Using Statistical Methods. African Journal of Environmental Science and Technology 5:815-833.
|
|
|
|
|
Kothari R, Tyagi VV, Pathak A (2010). Waste-to-Energy: A Way from Renewable Energy Sources to Sustainable Development. Renewable and Sustainable Energy Reviews 14(9):3164-3170.
Crossref
|
|
|
|
|
Manyele SV (2004). Medical Waste Management in Tanzania: Current Situation and the Way Forward. African Journal of Environmental Assessment and Management 8:74-99.
|
|
|
|
|
Manyele SV, Lyasenga TJ (2010). Factors Affecting Medical Waste Management in the Lower- Level Health Facilities. African Journal of Environmental Science and Technology 4 (5):304-318.
Crossref
|
|
|
|
|
Matee VE, Manyele SV (2015). "Analysis of Temperature Profiles and Cycle Time in a Large-Scale Medical Waste Incinerator", Engineering 7:717-732.
Crossref
|
|
|
|
|
Mato RR, Kaseva ME (1999). Critical review of industrial and medical waste practices in Dar es Salaam City. Resources, Conservation and Recycling 25(3-4):271-87.
Crossref
|
|
|
|
|
Marinkovic N, Vitale K, Janev HN (2008). Management of hazardous medical waste in Croatia. Waste Management 28:1049-1056.
Crossref
|
|
|
|
|
Mohee R (2005). Medical Waste Characterization in Healthcare Institutions in Mauritius. Waste Management 25(6):575-581.
Crossref
|
|
|
|
|
Paratosh K, Kushwaha SK, Yadav M, Pareek N, Chawade A, Vivekanand V (2017). Food Waste to Energy: An Overview of Sustainable Approaches for Food Waste Management and Nutrient Recycling. BioMed Research International.
Crossref
|
|
|
|
|
Psomopoulos CS, Stavroulakis C, Stavropoulos V, Themelis NJ (2013). Greenhouse gases emission reduction potential in Greece by implementing WTE facilities in strategically selected urban areas. Fresenius Environmental Bulletin 22(7a):2042-2047.
|
|
|
|
|
Shareefdeen ZM (2012). Medical Waste Management and Control. Journal of Environmental Protection 3:1625-1628.
Crossref
|
|
|
|
|
Stankovi? A, Niki? D, Nikoli? M (2008). Report: Treatment of medical waste in Nišava and Toplica districts, Serbia. Waste Management and Research 26(3):309-313.
Crossref
|
|
|
|
|
UNEP (2012). Compendium of Technologies for Treatment /Destruction of Healthcare Waste Osaka: International Environmental Technology Centre, United Nation Environmental Program.
|
|
|
|
|
World Health Organization (WHO) (2000). Wastes from Health-care Activities. Fact Sheet No. 253, October 2000.
|
|
|
|
|
WHO (2007). Population health and waste management: scientific data and policy options. Copenhagen: WHO Regional Office for Europe.
View
|
|
|
|
|
World Health Organization (WHO), (2011). Health-care waste management- Fact Sheet N°281© 2017 The author and GRDS Publishing. All rights reserved. Available Online at: http://grdspublishing.org/World Health Organization, 2004. Safe health-care management, Policy Paper, 2004.
|
|
|
|
|
WHO (2015). Health-care waste. Fact sheet no. 253.
View
|
|
|
|
|
WHO (2016). "Guidance for Healthcare Waste Management in Low Income Countries.
|
|
|
|
|
Yu B, Huang Z, Zeng Y (2014). Analysis on the Component Characteristics and Calorific Value of Medical Waste. Journal of Chemical and Pharmaceutical Research 6(5):1558-156.
|
|