Full Length Research Paper

ABSTRACT
Climate models are generally used to evaluate the climate change impacts. However, they have important biases at the regional or local scales. This study evaluates the future temperature projections in Lake of Guiers/Senegal. For this, the daily maximum and minimum temperature from the ensemble mean of five (5) Coordinated Regional climate Downscaling Experiment (CORDEX) regional climate models (RCMs) under the greenhouse gas scenarios RCP4.5 and RCP8.5 and three (3) bias correction methods (Linear scaling, variance scaling and quantile mapping methods) were used. The performance of raw ensemble mean of the models was first evaluated against the WFDEI data. The results show that this latter exhibits some limitations to reproduce the minimum and the maximum temperature at the Lake scale. In order to make temperature data more accurate, the three bias correction methods were used. Results show that bias correction methods improve well the simulated minimum and maximum temperature. The future temperature projections show an increase of temperature which are faster in bias-corrected data. From the results it is indicated that it is necessary to implement appropriate adaptation measures to address these climate changes.
Key words: Climate change, regional climate models, coordinated regional climate downscaling experiment (CORDEX), bias correction methods, Lake of Guiers.
INTRODUCTION
Most of the studies conducted on the West African climate show an increase in temperatures in the Sahel region (IPCC, 2013; Ly et al., 2013; Giorgi et al., 2014). These temperature increases can impact the hydrological cycle and agriculture yields (Salack et al., 2011; Gelata and Gobosho, 2018; Sarr and Camara, 2018). They can also lead to problems in the supply of fresh water to populations through the evaporation phenomena, especially in Sahelian countries which are characterized by a short rainy season (3 to 4 months) and with variability in rainfall distribution (Tall et al., 2016; Luo et al., 2018). Therefore, climate change scenarios are needed in West Africa, particularly in Sahel to evaluate these impacts.
In West Africa climate changes have often been studied with global climate models (GCMs). However, these models have large disparities in this region. In fact, GCMs have difficulty simulating certain surface heterogeneities because of their low spatial resolution (200 to 300 km). Thus, these GCMs are important only when it comes to representing global climate change. That is to say on a large scale. To address these issues, regional climate models (RCMs) are increasingly being used to dynamically disaggregate global climate models (Paeth et al., 2011). In this context, several experiments have been undertaken to produce coordinated experiments using several regional climate models (RCMs). This is the case of PRUDENCE (Baguis et al., 2010), ENSEMBLES-AMMA (Déqué et al., 2012). However, these coordinated experiments focused on limited areas. CORDEX is an international program implemented by several research centers which aim is to produce reliable climate change scenarios for impact studies. The ability of CORDEX RCMs to reproduce the present climate in West Africa has been assessed in numerous studies (Nikulin et al., 2012; Gbobaniyi et al., 2014; Klutse et al., 2015; Akinsanola and Ogunjobi, 2017). The climate change scenarios are obtained by forcing CORDEX RCMs by the Coupled Models Intercomparison Project phase 5 (CMIP5) GCMs from 1951 to 2100 (Giorgi et al., 2009). RCMs are the same basic physical principles as GCMs, but with higher horizontal resolution (~10-50 km). They are much more appropriate for impact studies because of their ability to represent the climate in complex areas such as West Africa. However, the simulated climate is not again in perfect agreement with observation. In fact, these RCMs also have limitations when it comes to focusing at the local-scale such as at the farm or basin scales. That is why, some authors (Hawkins et al., 2012; Kum et al., 2014; Gumindoga et al., 2016; Grillakis et al., 2017) have recommended the use of bias correction methods to eliminate or reduce bias to produce reliable climate change scenarios for impact assessment purposes.
The main objective of this study is to evaluate the performance of the Coordinated Regional climate Downscaling Experiment (CORDEX) models and the three (3) bias correction methods commonly used (Linear Scaling, Variance Scaling and Distribution Mapping) to simulate present and future temperature in the Lake of Guiers.
METHODOLOGY
Study area
The study area is the Lake of Guiers (Figure 1) which is the main reserve of surface freshwater in Senegal. It is located in northern Senegal, in the upper delta of the Senegal river basin, between longitude 15°40’-16° West and between latitude 16°-16°30’ North. It extends between the south of city of Richard Toll (near the border with the Mauritania) and and Louga regions (toward K M SARR) (Figure 1). The minimum and maximum daily air temperatures in this city range between 22 and 36°C, respectively, while the mean annual rainfall is about 403 mm (Niang, 2011; Diédhiou et al., 2019). The main activities carried out in the semi-desert areas surrounding the lake are breeding, fishing, rice and sugar cane cultivation. The lake water is also used as a drinking water resource for the urban centers (165,000 m3/day for a population of 5 million inhabitants) (Sambou et al., 2019).
Datasets
This study uses daily maximum and minimum temperature data from CORDEX RCMs. They are CCLM4, RCA4, HIRHAM, REMO and RACMO. The model institutions, the regional climate models and their reference are presented in Table 1. The spatial resolution of CORDEX RCMs is 0.44° (approximately 50 km). They cover the period 1976-2005 for the historical and 2006-2100 for future. The RCMs outputs are available from this website: https://www.cordex.org/output.html.

These models are described in detail by Giorgi et al. (2009). Two periods are considered in this study: the reference period (1979 - 2005) and the future period (2006 - 2100). The RCMs RACMO, HIRHAM and REMO are forced by the outputs of the GCM EC-EARTH; while models RCA4 and CCLM4 are forced by the outputs of the GCM CNRM-CM5. The climate projections are obtained by forcing the regional climate models by the outputs of the global climate models under the greenhouse gas scenarios RCP4.5 and RCP8.5 which, respectively correspond to radiative forcing of 4.5 and 8.5 W/m² at the horizon 2100. To evaluate the performance of bias correction methods, the Water and Global Change (WATCH) Forcing Data methodology eas applied to ERA-Interim reanalysis data (WFDEI) (Weedon et al., 2014). The WFDEI data are availbable from 1979 to 2012. Two periods are considered in this study: the reference period (1979- 2005), which is the common period between RCMs data and WFDEI data and the future period (2006-2100).
Bias correction methods
In this study, three bias correction temperature methods commonly used namely linear scaling (LS), variance scaling (VS) and distribution mapping (DM) are considered. The period of calibration of this bias correction method is 1979-1993 and the period of validation is 1994-2005.
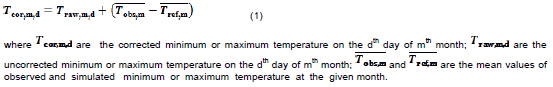
Linear scaling
The Linear Scaling (LS) method (Lenderink et al., 2007) corrects the outputs of the climate model by using the difference in the mean variability between the observations and climate model.

RESULTS
Performance of the multi-model ensemble
Figure 2 shows the monthly maximum and minimum temperature simulated by the five CORDEX RCMs present in the ensemble-mean compared to WFDEI data from 1979 to 2005. The ensemble mean of the model was considered because numerous studies (Kim et al., 2014; Gbobaniyi et al., 2014) pointed that it better reproduces the spatial distribution of the surface temperature. WFDEI data show the lowest minimum and maximum temperature (around 16 and 32°C, respectively) in the Lake of Guiers between December and February. The highest minimum and maximum temperature (around 24 and 38°C, respectively) are recorded from April to June and from July to September, respectively. WFDEI data shows also a decrease of maximum temperature between the end of June and September corresponding to the rainy season in Senegal. The ensemble-mean of the models generally reproduces well the pattern of the monthly maximum and minimum temperature observed in the Lake. Also, the monthly maximum and minimum temperature simulated are closer to that observed, as shown in Figure 3 with a coefficient of determination of 0.96 and 0.97, respectively. It should also be noted that the ensemble mean of the models reproduces quite well the minimum temperature observed. This is confirmed by the results obtained in Table 2. Nevertheless, the simulated temperature is always biased. In fact, it presents an overestimation of the maximum temperature for all months with mean bias of -1.92. For the minimum temperature, it overestimates the observed values only between March and May. Thus, the performance of outputs of the multi-model ensemble can be increased by bias correction methods.
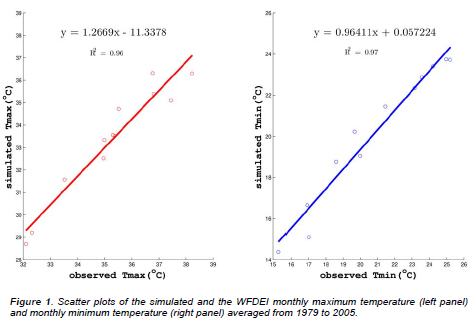
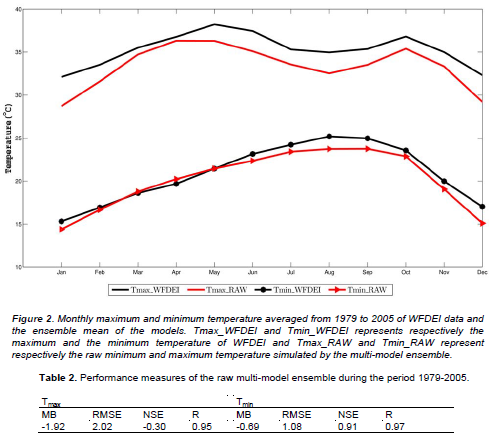
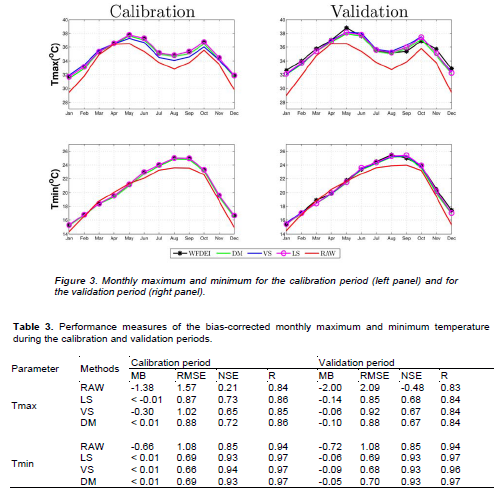
Figure 4 shows the comparison of the monthly maximum and minimum temperature from the WFDEI data, raw multi-model ensemble and bias-corrected respectively during the calibration period (1979-1993) and validation period (1994-2005). The results show that the bias in ensemble mean of the models temperature is remarkably reduced. All the three bias correction methods improve satisfactory the outputs of the ensemble mean of the models. There are very slight differences between the WFDEI data and the bias-corrected multi-model ensemble compared to raw data during the calibration data. But some contrasts exist between the three bias corrected multi-model ensemble mean and theirs performances with respect to both parameters. In fact, results show that Linear Scaling (LS) method is closer to the observed temperature followed by Distribution mapping (DM) method. The statistical performance measures of bias-corrected temperature during the calibration and the validation periods are presented in Table 3. The statistical indicators values reflect the good performances of the three bias correction methods during the calibration and validation periods. During the calibration period the mean bias is less than 0.01 excepted VS method for the monthly maximum temperature. On the other hand, VS method better corrects the mean bias of the monthly maximum temperature during the validation period. The good results obtained with the statistical parameters (RMSE < 1, NSE and R values close to 1) during both periods highlight the ability of bias correction to improve the simulated monthly maximum and minimum temperature. We also note that the ability of the three bias correction methods to better correct the minimum temperature. This might be due to fairly good capacity of the five models present in the ensemble mean to better simulate the minimum temperature. Therefore, the minimum temperature become easier to bias-corrected.
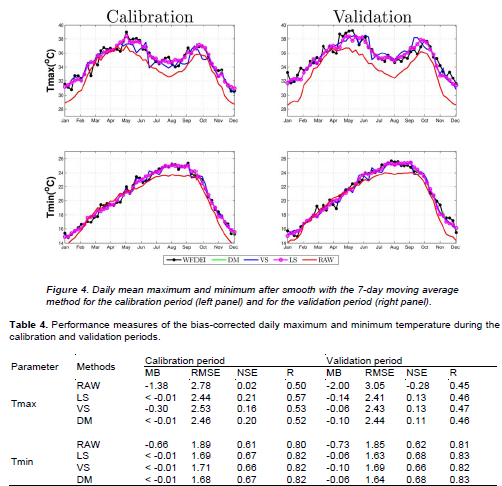
To see the performance of bias correction methods at the daily time scale, Figure 5 shows the 7-day mean of the maximum and minimum temperature from the WFDEI data, raw multi-model ensemble and bias-corrected, respectively during the calibration period (1979-1993) and validation period (1994-2005). Table 4 shows the statistical performance measures of daily maximum and minimum temperature. The results show that all bias correction methods improve also the daily maximum and minimum temperature during the calibration and the validation period. As for monthly time scale, LS and DM methods better improve the quality of daily maximum and minimum temperature simulated by multi-model ensemble. Moreover, slight differences are noted when the performance of both methods was considered. That is to say, both bias correction methods show similar performances. The results obtained in Table 4 confirm the good performances of bias correction methods. In fact, low mean bias are recorded (MB < 0.01°C) for the daily temperature values except the VS method for daily maximum temperature as in monthly scale during the calibration period. However, when we compare the statistical parameters, results show that bias correction methods perform better on the monthly scale over the daily. The results obtained during the validation period show that VS method is more suitable for daily and monthly maximum temperature. Moreover, the DM method is better suitable to bias correct the daily minimum temperature. For monthly minimum temperature, DM and LS method seem to give the best bias-correction. Globally, the three temperature bias correction methods improve the performance of the ensemble mean of the models. The ability of bias correction methods to improve the performance of the ensemble mean of the models strengthens our confidence in the future temperature projections in the Lake of Guiers.
Projection of future temperature
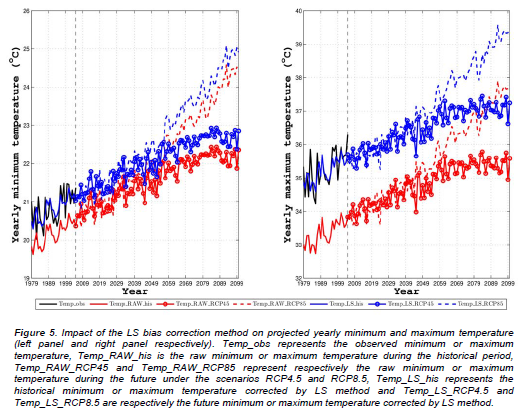
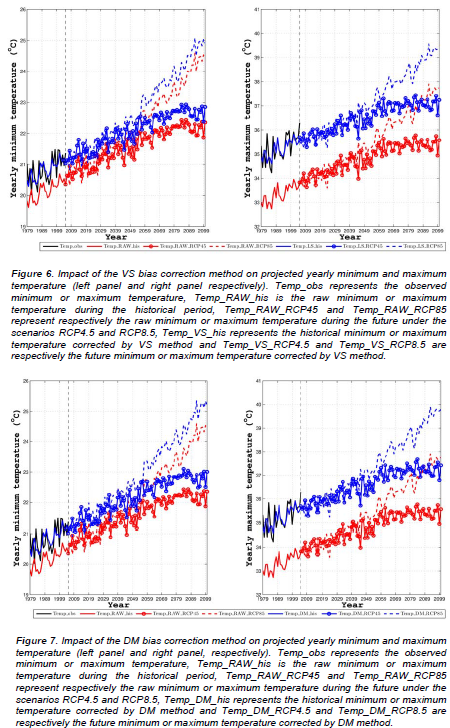
After evaluating the bias correction methods, the temporal evolution of annual maximum and minimum temperature from 1979 to 2100 was studied. Figures 6, 7, and 8 illustrate the impact of the LS, VS, and DM bias correction methods on the projected annual minimum and maximum temperatures, respectively. The results show that the correted data reproduce well the WFDEI data during the reference period (1979-2005) compared to raw data. However, it was found out that the corrected data by DM method (Figure 8) shows the highest performance in simulated annual temperature (MB=0.04°C/ <0.01°C, NSE=0.39/0.36 for yearly maximum/minimum temperature, respectively) compared to VS method (Figure 8) (MB=-0.04°C/-0.01°C, NSE=0.34/0.30 for yearly maximum/minimum temperature) and LS method (Figure 7) (MB=-0.05°C/ <-0.01°C, NSE=0.39/0.30 for maximum/minimum temperature). It was also noted that the multi-model mean corrected by the three methods considered shows an upward trend in temperatures compared to that uncorrected almost over the entire period in both scenarios (RCP4.5 and RCP8.5). This overall increase is greater in the pessimistic scenario (RCP8.5) than in the medium scenario (RCP4.5). The magnitude of the difference between the corrected and uncorrected multi-model mean is much greater when considering the maximum temperature. But the sign of the change signal in raw data is not modified in those bias-corrected. Globally, important increases are observed in future maximum and minimum temperature when the raw ensemble of the models and bias-corrected under both scenarios were considered. This is in agreement with several results obtained on the Sahel (IPCC, 2013; Ly et al., 2013; Sylla et al., 2016). This increase is greater from 2060 especially under the RCP8.5 scenario. In fact, an increase of 0.8 to 0.15°C per decade and of 0.5 to 0.53°C per decade is predicted, respectively under the RCP4.5 and RCP8.5 scenarios for the mean annual minimum temperature. For the mean annual maximum temperature, the increase range between 0.08 and 0.22°C per decade and 0.55 to 0.66°C per decade, respectively under RCP4.5 and RCP8.5 scenarios. The lowest increases in minimum and maximum temperature were obtained with raw multi- model mean and the highest increases in minimum and maximum temperature were obtained with multi-model mean bias-corrected by DM (Figure 8) and VS methods (Figure 7), respectively.
DISCUSSION
This study evaluates the performance of the ensemble-mean of five (5) CORDEX regional climate models (RCMs) models and the three (3) bias correction methods commonly used (Linear Scaling, Variance Scaling and Distribuiton Mapping) to better simulate present and future temperature in the Lake of Guiers which plays an important role in the socio-economic development of Senegal (Sambou et al., 2019; Diedhiou et al., 2019). The results show that the ensemble-mean of model simulates well the observed minimum and maximum temperature. However, it still contains some bias. According to Luo et al. (2018), these biases come from to the forcing of Global Climate models (GCMs) or produced by a systematic error of the model. Therefore, it is very important to bias-correct the RCMs data before studying the climate change (Chen et al., 2013; Ajaaj et al., 2015). The results show that all methods used can improve the original RCMs outputs with few differences. The simplest bias correction method is the Linear Scaling (LS) which corrects the outputs of the climate model by using the difference in the mean variability between the observations and climate model. Thus, the biases in variance are not corrected. However, it was found that for the daily and monthly minimum temperature during the validation period LS method gives the best results. Thus, the uncorrected minimum temperature might not be biased in variance. Of the three bias correction methods used, the DM method is the most advanced. It is used to adjust the mean, the standard deviation and the quantile. This method better corrects the minimum temperature at daily and monthly scale compared to others methods during the validation period. However, it seems be more suitable when we want to bias correct the extreme events (McGinnis et al., 2015; Luo et al., 2018).
After evaluation, the evolution of the future minimum and maximum temperature corrected and uncorrected under scenarios RCP4.5 and RCP8.5 from 1979-2100 was diagnosed. The multi-model mean simulated a strong rise in minimum and maximum temperature which is more important under the RCP8.5 scenario. These results are in agreement with those obtained by Giorgi et al. (2014) and Sylla et al. (2016) in Western Sahel. After correction, the trends are not so modified but the magnitude of climate change signal is amplified in the multi-model mean bias-corrected. This is in agreement with Mbaye et al. (2015) results over Senegal river basin.
The large increase of both temperature and minimum temperature could lead to an increase in evapotranspiration phenomena in Lake of Guiers (Tall et al., 2016) and a decrease in the water content of the soil located at the edge of the lake. This could lead to problems of availability of resources because this lake is the largest reservoir of freshwater in Senegal (Sambou et al., 2018). This situation could also be detrimental for agricultural yields. In fact, strong temperature increase can affect the grain weight and the duration of grain growth (Sarr and Camara, 2018).
CONCLUSION
In this work, the ensemble mean of 5 CORDEX RCMs was considered to analyze the evolution of future temperature in the Lake of Guiers. The performances of the ensemble mean of the models to reproduce the minimum and maximum temperature are first assessed. Results show that the multi-model ensemble mean reproduces globally well the observed data. However, it presents some biases which can be reduced by bias correction methods. After bias correction, the agreement between the multi-model ensemble mean and the WFDEI data has considerably increased.
Results show an increase of annual minimum and maximum temperature in the lake. Moreover, the magnitude of this increase is more important in the multi-model ensemble mean bias-corrected compared to that raw, but the degree of frequency in raw data is not affected.
This future increase in temperature predicted by the uncorrected and corrected ensemble mean of the models can have harmful consequences for the local populations due to the increase of evapotranspiration and water demand. Therefore, it would be important to better quantify the future climate change impact on the hydrological cycle in the Lake of Guiers.
CONFLICT OF INTERESTS
The author has not declared any conflict of interests.
REFERENCES
|
Ajaaj AA, Mishra, AK, Khan AA (2015). Comparison of bias correction techniques for GPCC rainfall data in semi-arid climate. Stochastic Environmental Research and Risk Assessment 30(6):1659-1675. |
|
|
Akinsanola AA, Ogunjobi KO (2017). Evaluation of present-day rainfall simulations over West Africa in CORDEX regional climate models. Environmental Earth Sciences 76(10):366. |
|
|
Baguis P, Roulin E, Willems P, Ntegeka V (2010). Climate change scenarios for precipitation 25 and potential evapotranspiration over central Belgium. Theoretical and Applied Climatology 99(3):273-286. |
|
|
Baldauf M, Seifert A, Förstner J, Majewski D, Raschendorfer M, Reinhardt T (2011). Operational convective-scale numerical weather prediction with the COSMO model: description and sensitivies. Monthly Weather Review doi: 10.1175/MWR.-D-10-05013.1 |
|
|
Chen J, Brissette FP, Chaumont D, Braun M (2013). Finding appropriate bias correction methods in downscaling precipitation for hydrologic impact studies over North America. Water Resources Research 49(7):4187-205. |
|
|
Christensen JH, Carter TR, Rummukainen M, Amanatidis G (2007). Evaluating the performance and utility of regional climate models: the PRUDENCE project. |
|
|
Déqué M, Somot S, Sanchez-Gomez E, Goodess CM, Jacob D, Lenderink G, Christensen OB (2012). The spread amongst ENSEMBLES regional scenarios: regional climate models, driving general circulation models and interannual variability. Climate Dynamics 38(5):951-964. |
|
|
Diédhiou C, Diop S, Faye G, Moshod T, Wade S (2019) Study on the Applicability of Landsat-8 Images as a Tool for Monitoring the Trophic State of Lake Guiers (Senegal). Journal of Water Resource and Protection 11(4):434-447. |
|
|
Gbobaniyi E, Sarr A, Sylla MB, Diallo I, Lennard C, Dosio A, Lamptey B (2014). Climatology, annual cycle and interannual variability of precipitation and temperature in CORDEX simulations over West Africa. International Journal of Climatology 34:2241-2257. |
|
|
Gelata CD, Gobosho L (2018). Climate Change Induced Temperature Prediction and Bias Correction in Finchaa Watershed. American-Eurasian Journal of Agriculture and Environmental Sciences 18(6):324-337. |
|
|
Giorgi F, Jones C, Asrar G (2009). Addressing climate information needs at the regional level. The CORDEX framework. WMO Bulletin, July 2009 issue. |
|
|
Giorgi F, Coppola E, Raffael F, Diro GT, Fuentes-Franco R, Giuliani G, Mamgain A, Llopart MP, Mariotti L, Torma C (2014). Changes in extremes and hydroclimate regimes in the CREMA ensemble projections, Abdus Salam International Centre for Theoretical Physics, Trieste. Italy. Climate Change. |
|
|
Grillakis MG, Koutroulis AG, Daliakopoulos IN, Tsanis IK (2017). A method to preserve trends in quantile mapping bias correction of climate modeled temperature. Earth System Dynamics 8:889-900. |
|
|
Gumindoga W, Rientjes THM, Haile AT, Makurira H, Reggiani P (2016). Bias correction schemes for CMORPH satellite rainfall estimates in the Zambezi River Basin. Hydrology and Earth System Sciences Discussions. |
|
|
Hawkins E, Ho CK, Osborne T, Challinor AJ (2012). Calibration and bias correction of climate projections for crop modelling: an idealised case study over Europe. Agricultural and Forest Meteorology. |
|
|
IPCC (2013). Climate Change (2013): The Physical Science Basis. In T. F. Stocker, D. Qin, G. -K. Plattner, M. Tignor, S.K. Allen, J. Boschung, A. Nauels, Y. Xia, V. Bex and P.M. Midgley (Eds.), Contribution of Working Group I to the Fifth Assessment Report of the Intergovernmental Panel on Climate Change (p. 1535). Cambridge, United Kingdom and New York, NY, U. |
|
|
Jacob D, Barring L, Christensen OB, Christensen JH, Hagemann S, Hirschi M, Kjellström E, Lenderink G, Rockel B, Schar C, Seneviratne SI, Somot S, van Ulden A, van den Hurk B (2007). An Inter-Comparison of Regional Climate Models for Europe: Design of the Experiments and Model Performance. Climate Change 81:31-52. |
|
|
Kim J, Waliser DE, Mattmann CA, Goodale CE, Hart AF, Zimdars PA, Favre A (2014). Evaluation of the CORDEX-Africa multi-RCM hindcast: systematic model errors. Climate Dynamics 42(5):1189-1202. |
|
|
Klutse NAB, Sylla MB, Diallo I, Sarr A, Dosio A, Diedhiou A, Kamga A, Lamptey B, Ali A, Gbobaniyi EO, Awuso K, Lennard C, Hewitson B, Nikulin G, Panitz HJ, Büchner M (2015). Daily characteristics of West African summer monsoon precipitation in CORDEX simulations. Theoretical and Applied Climatology. |
|
|
Kum D, Lim KJ, Jang CH, Ryu J, Yang JE, Kim SJ, Kong DS, Jung Y (2014). Projecting Future Climate Change Scenarios Using Three Bias- Correction Methods. Advances in Meteorology. Volume 2014, Article ID 704151, 12 pages. |
|
|
Lenderink G, Buishand A, van Deursen W (2007). Estimates of future discharges of the river Rhine using two scenario methodologies: direct versus delta approach. Hydrology and Earth System Sciences 11(3):1145-1159. |
|
|
Luo M, Liu T, Meng F, Duan Y, Frankl A, Bao A, De Maeyer P (2018). Comparing Bias Correction Methods Used in Downscaling Precipitation and Temperature from Regional Climate Models: A Case Study from the Kaidu River Basin in Western China. Water 10(8):1046. |
|
|
Ly M, SB, Traoré A, Alhassane, Sarr B (2013). Evolution of Some Observed Climate Extremes in the west African Sahel. Weather and Climate Extreme 1:19-25. |
|
|
Mbaye ML, Faye B, Sambou D, Gaye AT (2018). Potential effect of bias correction on extreme precipitation and temperature changes over Senegal River Basin (West Africa). Science de la vie, de la terre et agronomie 6(2). ISSN 2424-7235. |
|
|
McGinnis S, Nychka D, Mearns LO (2015). A new distribution mapping technique for climate model bias correction. In Machine Learning and Data Mining Approaches to Climate Science: Proceedings of the Fourth International Workshop on Climate Informatics; Lakshmanan, V, Gilleland, E, McGovern, A, Tingley, M, Eds.; Springer: Boulder, CO, USA. |
|
|
Meijgaard E, van Ulft LH, van den Berg WJ, Bosveld F, van den Hurk B, Lenderink G, Siebesma AP (2008). The KNMI Regional Atmospheric Climate Model RACMO, Version 2.1. KNMI Technical Report 302:43. |
|
|
Niang A (2011). Aménagement du lac de Guiers de 1824 à l'avénement des grands barrages du fleuve Sénégal: Prospective géographique. Climat et Développement. |
|
|
Nikulin G, Jones C, Giorgi F, Asrar G, Büchner M, Cerezo-Mota R, Christensen OB, Déqué M, Fernandez J, Hänsler A, van Meijgaard E, Samuelsson P, Sylla MB, Sushama L (2012). Precipitation climatology in an ensemble of CORDEX-Africa regional climate simulations. Journal of Climate 25(18):6057-6078. |
|
|
Paeth H, Hall NM, Gaertner MA, Alonso MD, Moumouni S, Polcher J, Ruti PM, Fink AH, Gosset M, Lebel T, Gaye AT, Rowell DP, Moufouma-Okia W, Jacob D, Rockel B, Giorgi F, Rummukainen M (2011). Progress in regional downscaling of West African precipitation. Atmospheric Science Letters 12(1):75-82. |
|
|
Piani C, Haerter JO, Coppola E (2010). Statistical bias correction for daily precipitation in regional climate models over Europe. Theoretical and Applied Climatology 99(1):187-192. |
|
|
Salack S, Muller B, Gaye AT (2011). Rain-based factors of high agricultural impacts over Senegal. Part I: integration of local to sub- regional trends and variability. Theoretical and Applied Climatology 106(1):1-22. |
|
|
Sambou D, Diekkrüger B, Dina W, Verah H (2018). Water availability and demand under climate change and population growth in Lake Guiers, Senegal. 17th World Lake Conference, Lake Kasumigaura, Ibaraki, Japan, 2018. |
|
|
Sambou D, Diekkrüger B, Mbaye ML (2019). Trends and projections of climate change over the basin of Lake Guiers, Senegal. Conference: EGU General Assembly 2019. |
|
|
Samuelsson P, Jones CG, Willén U, Ullerstig A, Gollvik S, Hansson U, Jansson C, Kjellström E, Nikulin G, Wyser K (2011). The Rossby Centre Regional Climate Model RCA3: Model Description and Performance. Tellus A 63(1):4-23. |
|
|
Sarr AB, Camara M (2018). Simulation of the impact of climate change on peanut yield in Senegal. International Journal of Physical Sciences 13(5):79-89. |
|
|
Sylla MB, Nikiema PM, Gibba P, Kebe I, Klutse NAB (2016). Climate Change over West Africa: Recent trends and future projections. J.A. Yaro and J. Hesselberg (eds.). Adaptation to Climate Change and Variability in Rural west Africa. |
|
|
Tall M, Sylla MB, Diallo I, Pal JS, Faye A, Mbaye ML, Gaye AT (2016). Projected impact of climate change in the hydroclimatology of Senegal with a focus over the Lake of Guiers for the twenty-first century. Theoretical and Applied Climatology. |
|
|
Terink W, Hurkmans RTWL, Torfs PJJF, Uijlenhoet R (2010). Evaluation of a bias correction method applied to downscaled precipitation and temperature reanalysis data for the Rhine basin. Hydrol. Earth System Science 14(4):687-703. |
|
|
Teutschbein C, Seiber J (2012). Bias correction of regional climate model simulations for hydrological climate-change impact studies: Review and evaluation of different methods. Journal of Hydrology 456:12-29. doi: 10.1016/j.jhydrol.2012.05.052. |
|
|
Weedon GP, Balsamo G, Bellouin N, Gomes S, Best MJ, Viterbo P (2014). The WFDEI meteorological forcing data set: WATCH forcing data methodology applied to ERA-interim reanalysis data. Water Resources Research 50(9):7505-7514. |
|
Copyright © 2024 Author(s) retain the copyright of this article.
This article is published under the terms of the Creative Commons Attribution License 4.0


