This study aimed at evaluating the effect of storage time on the stability of pineapple products processed by small and medium scale processing enterprises (SMEs) in Rwanda stored at ambient (21 to 25°C) temperatures. Physico-chemical quality characteristics (pH, moisture, fibre, ash, total soluble solids, titratable acidity, sucrose, reducing sugars, total sugars and ethanol) of the sample products were analysed. Changes in the quality were monitored at three and one months interval for syrups, jams and nectars, respectively. Results showed that for nectars, most of the parameters evaluated were stable up to only two months of storage. All nectars, syrups and jams had a pH ranging from 3-5, the normal pH range for fruit products. The levels of titratable acidity of all products were below the maximum limit of 1.35% set by Codex Alimentarius Commission (CAC) Standards. Similarly, their levels of ethanol were less than the maximum of 0.3% recommended by Codex Alimentarius Commission standards. Syrups and jams were stable for most of the parameters up to six months of storage. There was a significant (p<0.05) decrease of sucrose and increase of reducing sugars in syrup and jam samples, specifically from six months of storage. Products from some enterprises exhibited sugar values higher than the maximum recommended by Rwandan, East African and CAC standards. The studied products exhibited significant variations in most of the studied parameters over the storage period with most of the samples not complying with the standards including sugar levels. Processors, therefore, need to be trained on proper fruit processing and the standard requirements for pineapple fruit products.
Sampling
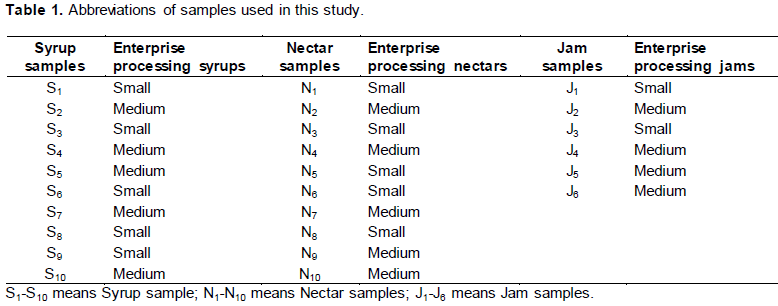
Random sampling technique was used to obtain bottled pineapple nectars, syrups and packaged jam samples at each pineapple processing enterprise involved in the study. Samples, 62 bottles of 500 ml for syrups, 62 pots of jams and 62 bottles of nectars were collected from each enterprise and coded. Table 1 shows the abbreviations of samples used whith their respective codes. For example, s1 meant syrup number one that is collected from the small enterprise number one and N4 meant nectar number four that is collected from the medium enterprise number four. The 10 enterprises were scattered accross the country and not located at the same place. Jams were collected from only six enterprises, which were processing jams in addition to syrups and nectars. Samples were transported in paper cartons and kept at room temperature ranging from 210 to 250C in the Southern province of Rwanda, Huye district for subsequent analysis.
Physico-chemical characteristics determinations
Chemical and physico-chemical characteristics of the products were determined by Official Methods of Analysis of the Association of Analytical Chemists (AOAC, 1995). Totalsoluble solids were determined by using portable refractometer (ref.8145, 0320v, France); pH by potentiometric method, titratable acidity was determined by dissolving a known weight of sample in distilled water and then titrated against 0.1 N NaOH using phenolphthalein as indicator and expressing the results as percent citric acid. Moisture, dietary fibre and ash contents were determined using the approved Official Methods of Analysis (AOAC, 1995). Total sugars, reducing sugars and sucrose were determined according to Luff-Schoorl method (EAS, 2000) and ethanol by densimetric method (AOAC, 1995).
For analysis, one bottle was randomly selected each month for nectars, and every three months for syrups and jams. All determinations were carried out in triplicates and the mean values were reported. All laboratory analyses were conducted at the Laboratory of Analysis of Foodstuff, Drugs, Water and Toxics (LADAMET) of the Faculty of Medicine at the University of Rwanda (UR) from October 2012 to October 2013. Chemicals and reagents were supplied by Merck company, France.
Statistical analysis
Data obtained from the study were analyzed by Genstat statistical software 14th edition (VSN International Ltd, UK). Analysis of variance (ANOVA) was performed to determine significant differences between the main factors. Means were separated by Tukey’s Honest Significant Difference at p<0.05. Data were expressed as Mean±SD.
Chemical characteristics of the pineapple products
pH
The results of pH changes in pineapple syrups during 12 months of storage are shown in Figure 1A. There was a significant (p<0.05) decrease in pH values for samples coded (S1, S2, S5 and S6) and significant increase for S3, S4 and S8 samples up to 12 months of storage. There was no observed significant (p>0.05) change in pH values for samples coded S7, S9 and S10. The highest and lowest pH values were 3.7 and 2.7.
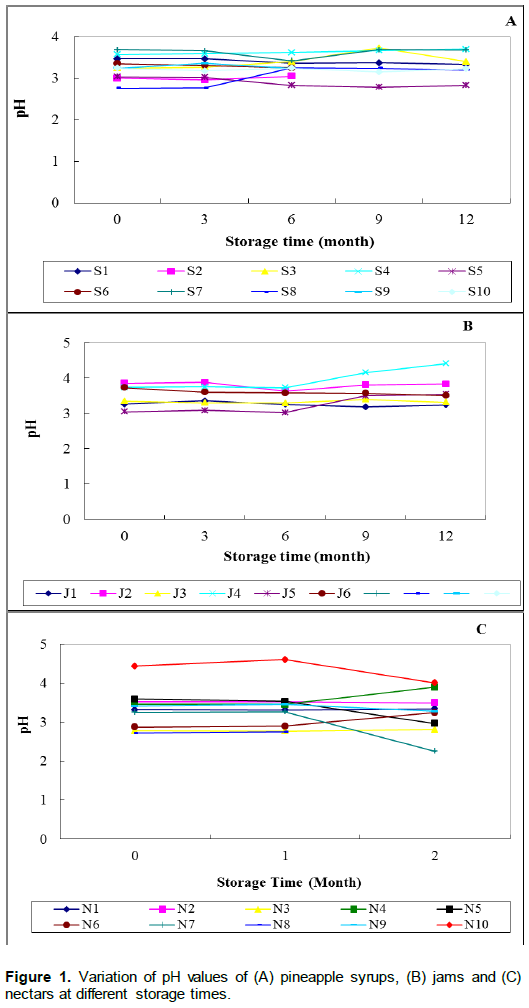
For jams, it was observed that, the products remained stable as the storage time went up to 12 months of storage. The pH values in all five jam samples did not change significantly (p>0.05) except for J6 where it decreased significantly (p<0.05) from 3.73 to 3.51 up to 12 months of storage (Figure 1B). pH ranged from 3.0 to 4.4 over storage time. In the case of nectars, there were no significant (p>0.05) changes in pH values for the majority (60%) of nectars except for N4, N5 and N9 where it decreased significantly at two months of storage while it increased significantly for N3. The pH range was 2.2 to 4.6 (Figure 1C). The highest and lowest pH values of 4.4 and lowest value of 2.2 were respectively observed in nectars as depicted in Figure 1C.
The majority of the samples had a normal pH ranges approaching an estimated pH value of 3.6 of the natural pineapple fruit reported by Nirmara and Reddy (2011) and Camara et al. (1995) and were within the range of 3 to 4 for pineapple products (Tasnim et al., 2010; United States Food and Drug Administration, 2007). Few samples had a pH less than 3.0. This was expected as pineapple fruit pH is known to vary with growing location, harvest time, fruit maturity and other factors, which affect the fruit (Bartolome et al.,1995). The low pH nature of the sampled products was due to the acidic nature of the pineapple fruit used. Fasoyiro et al. (2005) have reported similar pH increase in roselle fruit-flavoured drinks stored at ambient temperature. The authors have suggested that the increase in pH could be due to the decomposition of fermentable substrates especially the carbohydrates in the pineapple fruits and sugars added thereby increasing the acidity. Similar changes may have also taken place in this study for some products resulting in an increased pH. The increase in pH of some products in this study corroborates with a significant increase of pH in untreated and irradiated pineapple juice stored for 13 weeks reported by Chia et al. (2012).
Insignificant changes in pH values as observed in some products in this study were similarly reported in pasteurised pineapple juice during storage period of 13 weeks (Chia et al., 2012), heated orange juice stored at 22°C for 13 weeks (Yeom et al., 2000) and canned orange juice stored for one year at 24°C (Camara et al., 1995). For some products, there was a pH decrease and similar findings were reported by Jan and Masih (2012) during the storage stability study of pineapple juice blend with carrot and orange juice. pH is one of the important quality parameters that describe the stability of bioactive compounds in fruit juices (Sanchez-Moreno et al., 2006), it is therefore noted in this study that, pineapple syrups, nectars and jams had expected pH values for fruit and juice products during the storage period. Though there was variations in pH levels throughout the storage period of the studied products, the levels of pH of the samples in this study lead to suggest that pineapple fruits used for processing were of acceptable grade.
Titratable acidity
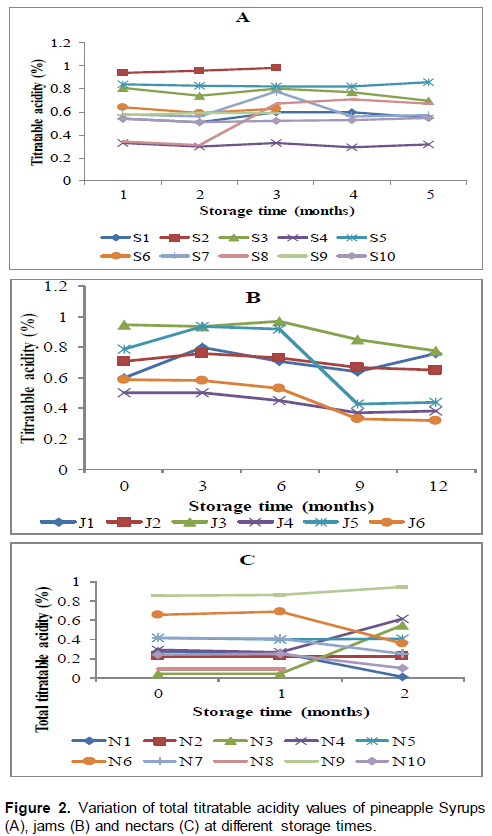
The results of Total Titratable Acidity (TTA) for syrups (A), jams (B) and nectars (C) are shown in Figure 2. Total titratable acidity values did not change significantly (p>0.05) during storage in the majority of the syrups and jams. It changed however significantly (p<0.05) in most of the nectars during storage. Titratable acidity ranged from 0.32 to 0.8%; 0.3 to 0.7% and 0.0 to 0.9%, respectively for syrups, jams and nectars after 12 months of storage. It increased significantly (p<0.05) up to 12 months of storage for samples coded S1 and S8 and it significantly (p<0.05) decreased for samples coded S3 and S7 (Figure 2A). Total titratable acidity in jams was stable throughout the storage period but there was a significant (p<0.05) decrease in samples coded J5 and J6 (Figure 2B). Titratable acidity decreased significantly (p<0.5) in nectars coded N1, N6, N7 and N10 while it significantly increased for samples coded N3, N4 and N9. There was no significant (p>0.05) changes in samples coded N2, N5 and N8 as shown in Figure 2C.
Similar stability in titratable acidity was observed in the thermally pasteurised pineapple juice stored for 13 weeks (Chia et al., 2012) and in grape juice during the storage duration (Buglione and Lozano (2002). The observed significant changes in TTA in some products in the current study were also reported by Ewaidah et al. (1988) in tomato juice stored for one year and Chia et al. (2012) in Ultra Violet (UV) irradiated pineapple juice through the storage period of 13 weeks. Those changes in titratable acidity could be attributed to conversion of acid into sugars (Keditsu et al., 2003). Nevertheless, beside the changes on total titratable acidity, the majority of the products complied with the standards with regards to total titratable acidity whose values were below the maximum limit of 1.35% set by Codex standards for pineapple juice (CAC, 2005b). Therefore, in addition to whatever malpractices that may have been done in the studied samples, TTA values remained close to the values found by Camara et al. (1995) in authentic commercial pineapple juices and nectars, which had legal TTA values.
Moisture
Results for moisture contents in pineapple syrup, jam and nectar are shown in Figure 3 (A, B and C). The results show that, in syrups (Figure 3A), moisture was stable up to six months of storage for samples coded S1, S2, S3, S5, S8 and S9 and the significant changes occurred from the ninth month of storage especially for sample S6. The rest of the syrups (S4, S7, S10) had stable moisture only up to three months of storage. The moisture ranged from 29.5 to 68.0% during 12 months of storage. Moisture content was stable up to three months and started to significantly (p<0.05) either increase or decrease from six months of storage for most of the syrups ranging from 32.63 to 54.66%. Only samples coded S4 was stable up to 12 months of storage (Figure 3A). In nectars, the moisture ranged from 79.93 to 95.38% and significant changes (p<0.05) started to occur at the second month of storage. All of the nectars had moisture values ranging from 78.45 to 95.36% (Figure 3C).
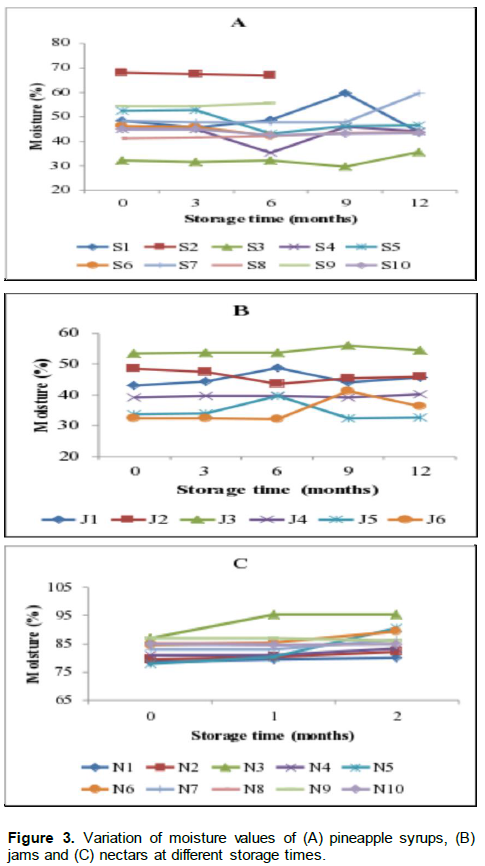
These values are nomal values for fresh fruit and vegetable juices for which a normal moisture values range from 80-95% (Kirk and Sawyer, 1991). The moisture of jams ranged from 31.06% for samples J6 to 56.1% for J3 (Figure 3B). It was stable for only sample J4 throughout the entire storage period of 12 months and for samples J1, J2 and J5 a significant decrease (p<0.05) was observed from the sixth month of storage while for samples J3 and J6 a significant increase was observed from the ninth month. These results show inconsistent changes in moisture for different jam sources over the 12 months of storage period. Moisture is one of the indices used to assess the authenticity of the fruit products. The change in moisture content of some samples could be attributed to either the inappropriate packaging materials (such as packaging not closing tightly), the nature of the packaging material itself in terms of moisture permeability or the change in the structure of the samples (Venir et al., 2007).
Lack of packaging materials has been mentioned as the major constraint in food SMEs business. From these findings, it is observed that significant variations in moisture content started from six months of storage for syrups and jams and from the end of the first month of storage for nectars. Consequently, based on moisture content criterion it is proposed that syrups and jams be stored up to six months and nectars be stored up to one month. Similarily, Alzamora (1993) have found a storage duration of high moisture fruit products ranging from 4 to 8 months.
Fibre
Results showed that samples had very low fibre levels ranging from 0.008 to 0.07%; 0.14 to 0.40% and 0.024 to 0.040% for syrup, jam and nectar samples, respectively at 12 months of storage. The levels of fibre in the studied samples were lower than 5%, which is the minimum limit set by the Codex and East African and Rwandan standards in pineapple fruit juices (EAS, 2000; CAC, 2005a, 2009; RS, 2005). The low levels of fibre content noted in the analysed products was expected because, processed fruit products including juices are known to be low fibre content food products (Kelsay et al., 1979). Dietary fibre comes from the portion of plants that is not digested by enzymes in the intestinal tract (Anderson et al., 2010). Part of it, however, may be metabolized by bacteria in the lower gut. Different types of plants vary in their amount and kind of fibre. Fibre includes pectin, gum, mucilage, cellulose, hemicellulose and lignin (Birch and Parker, 1983). Fruits and vegetables are good source of dietary fibre. Research has shown that a high-fibre diet has several benefits including prevention and treatment of constipation, hemorrhoids and diverticulosis as well as decrease of blood cholesterol (Theuwisen and Mensink, 2008). Pineapple processors are advised to process graded pineapple fruit in order to come up with a product of expected values of fibre content.
Ash
Results showed that ash levels were very low in syrups, jams and nectars. The levels ranged from 0.11 to 1.2%; 0.14 to 0.40% and 0.028 to 0.21%, for syrups, jams and nectars, respectively after 12 months of storage for syrups and jams and after two months of storage for nectars. For syrups, ash levels remained stable up to six months, however, significant (p<0.05) changes were observed from the ninth month of storage. For jams, ash levels were stable throughout the period of 12 months of storage. Only samples J4 and J6 were stable up to six months of storage and significant (p<0.05) changes were observed from the ninth month of storage. For most of the nectars, ash levels remained stable up to two months of storage but for sample coded N6 and N9, there were significant decreases at the second month of storage. For samples N2 and N5, the significant decreases were observed at the end of the first month of storage. Ash levels in a food product represent inorganic residue remaining after destruction of organic matter (Ranganna, 1986). The changes observed in ash content for these few samples were expected as it has been reported that some changes in ash content could occur during storage due to some interactions between constituents (Ranganna, 1986). A similar finding of decrease in ash content for stored soursop juice was observed by Abbo et al. (2006). The stability of ash content in most of the studied products was similar to that reported by Akinyele et al. (1990) who found no significant changes in ash content during the processing and storage duration in pineapples and orange juices. The levels of ash in the studied sample were lower than the expected range of 0.3 to 2% reported in literature for fresh fruits and vegetables (Kirk and Sawyer, 1991). However, similar levels of ash were found by Camara et al. (1995) in authentic pineapple juice concentrate packaged in glass bottles and in pineapple nectars. The very low levels of ash in nectars were obvious because they are only made of 40% of natural pineapple juices (Camara et al., 1995). Ranganna (1986) suggested that the low levels of ash in fruit products could be an indication of the absence of adulterants in the sample products. Accordingly, pineapple products in the current study may be considered as authentic with regards to ash content.
Total soluble solids
Results for total soluble solids in pineapple syrups, jams and nectars are presented in Figure 4. For most of the samples, there was no significant (p>0.05) changes in total soluble solids (TSS) levels throughout the storage time except for S3 where the TSS levels increased significantly from the sixth month of storage (Figure 4A). The levels ranged from 51 to 65° Brix at initial point of storage for syrups. In jams, the TSS levels ranged from 55 to 86° Brix at the initial point except in J3 with the lowest level of 46.33° Brix and J6 with the highest level of 86° Brix (Figure 4B). The levels ranged from 14.17 to 20.17° Brix in nectars at the initial point of storage with the exception of sample N3 which had the lowest level of 6.1°Brix (Figure 4C). However, there was a significant decrease in levels of Brix in N6 and N9 at the end of the first month of storage while there was a significant increase of Brix level in N3 at the end of the first month of storage.
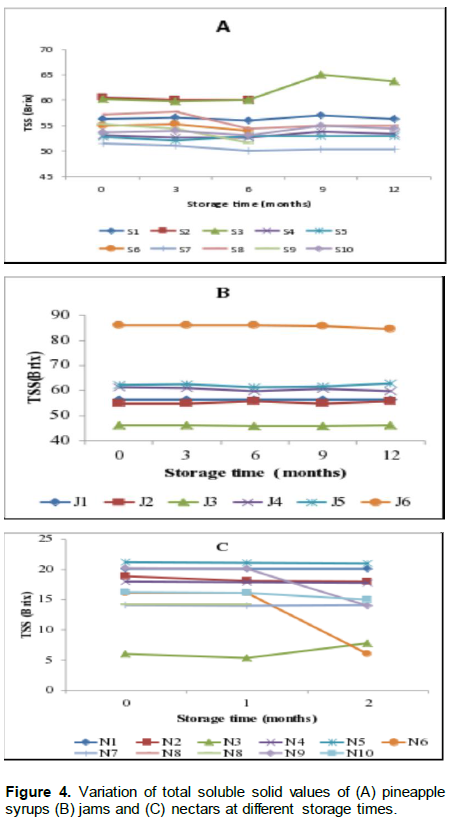
The amount of total soluble solids has been used as an indicator of fruit product quality and authenticity (Camara et al., 1996). The levels of Brix in the nectars were much higher than the levels in the nectars reported by Camara et al. (1996) which ranged from 11.6°Brix to 15.7°Brix. However, Brix levels in nectars were above 12.8 (% v/v), which is the minimum limit in pineapple nectars set by CAC (2005b). Similarly, the Brix levels of syrups S4, S5, S6 and S10 in the current study were close to the one of authentic commercial juice concentrate in the same study of Camara et al. (1996). Therefore, most of the syrups and nectars in this study may be qualified as authentic with regards to TSS. However, jam samples coded J4, J5 and J6 were the only ones for which TSS was above 60% as recommended by CAC (2009), probably because they were manufactured by successful and experienced medium enterprises, which have been operating more than five years. The remaining jams were qualified as not acceptable as far as TSS was concerned, may be because most of them were small enterprises with little experience in fruit processing. Consequently, processors need to be informed that the quantity of sugars added to pineapple syrups should not exceed 25 g/kg (RS, 2005) and that for jams, there is a need of having 40% of fruits used as ingredient in the final product (CAC, 2009).
Sucrose
Figure 5 shows the variations of sucrose levels in the syrups, jams and nectars during storage. There was a statistically significant (p<0.05) decrease in the sucrose levels during the storage period for jams and syrup samples and a slight decrease started at the end of the first month of storage for nectars. The levels ranged from 9.15% in syrups S1 to 15.40% in S4; 6.24% in jam J3 to 13.48% in J4 and 0.36% in nectars N2 to 5.98% in N2 at the initial storage time. The levels of sucrose in syrups and nectars were much higher than the levels reported by Camara et al. (1995) ranging from 4.13 to 5.51% and 0.21 to 3.58% for syrups and nectars, respectively.
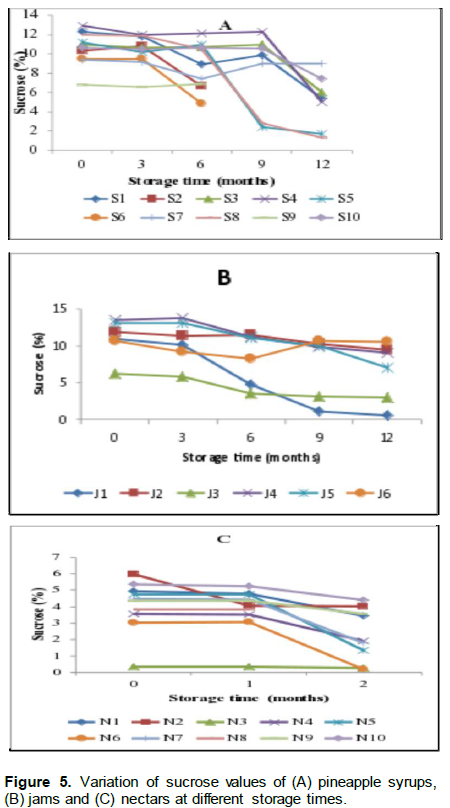
There was a sharp decrease in sucrose levels from the end of the third month for syrups and jams, and the first month of storage for nectars. Ewaidah et al. (1988) reported that the decrease in the sucrose content in canned orange juices stored for one year was due to conversion to reducing sugars. In their study, sucrose was still present for the juices stored at 24°C up to 12 months of storage. Similarly, in the current study, sucrose was still remarkably present in the products stored at a temperature ranging from 21 to 25°C. The storage conditions, such as high temperature have been reported to facilitate the conversion rate of sucrose to reducing sugars and it is suggested that the rate of sucrose hydrolysis is a function of reactants, temperature and acid-catalyst concentration (Babysky et al.,1986).
The current results corroborate with the results of Babysky et al. (1986) who reported hydrolysis of sucrose in apple juice concentrate stored for 111 days. However, the levels of sucrose did not significantly change in the nectars as their shelf life did not go beyond two months. The high levels of sucrose found in this study and variation among product sources could be an indication of an improper addition of sugars during processing.
Reducing sugars
Results of reducing sugars changes over 12 months of storage for (A) syrups (B) jams and over 2 months of storage for (C) nectars are shown in Figure 6. There was a marked increase in reducing sugars for syrups and jams from the end of the third month of storage. Syrup S9 had the highest level of reducing sugars (20.10%) and S10 had the lowest levels (15.59%) at 12 months of storage. The observed differences in reducing sugar contents of the samples were expected because samples came from different pineapple growing locations, which is indicated as one of the key factors contributing to the reducing sugar levels in fruit products in addiidion to the stage of maturity of pineapples to be processed (Tasnim et al., 2010).
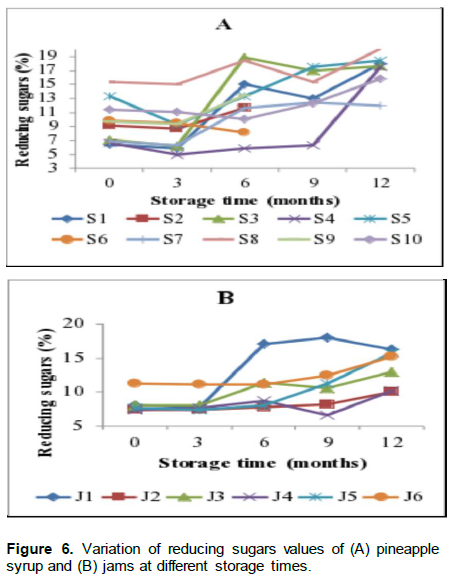
For jams, the levels of reducing sugars ranged between 6.6 and 22.00% throughout the storage period. However, the levels did not significantly change in all the nectars. The rate of increase in reducing sugars ranged between 20 and 70% between the beginning and 12 months of storage. These levels were very low ranging between 0.0031% in N2 to 0.1% in N9 at the beginning of storage.
Similar increase in reducing sugars during the storage were also reported in apple juice by Babsky et al.(1986) and in commercial orange canned nectars by Ewaidah (1988). One of the factors that leads to increased reducing sugars during storage of the juices is the decrease in sucrose which hydrolyses into reducing sugars. It was then observed in this study that the increase in reducing sugar levels starting at the end of the third month of storage and onward followed the same trend of decrease in sucrose. Hence, the rate of conversion of sucrose to reducing sugars could have been affected by storage time, temperature and changes in the chemical constituents of the samples.
For the nectars, sucrose and consequently reducing sugar levels did not change significantly over two months of storage. The coefficient of reducing sugars (predominantly glucose and fructose) over sucrose was close to 1 at the beginning of storage for six out of the ten tested syrups. It ranged from 0.89 to 1.43 for samples coded S1, S2, S3, S4 and S5. This coefficient of authenticity was also close to one for only two jam samples coded J2 and J6. These jams are the only ones that showed insignificant changes (p>0.05) for most of the parameters because they were manufactured by two successful medium enterprises trained by other different agencies in addition to Rwanda Agriculture Board (RAB) and the National Agricultural Export Development Board (NAEB). The coefficient was much less than one for the remaining five syrups, nectars and most of the jam samples. This could be an indication of the addition of much higher sugars in those samples than the recommended amount. Camara et al. (1996) have suggested that the coefficient of fructose plus glucose /sucrose close to one is a reference index of the authenticity of pineapple fruit products. Therefore, the addition of sugar to some syrups, nectars and jams during processing could have been done inappropriately.
Total sugars
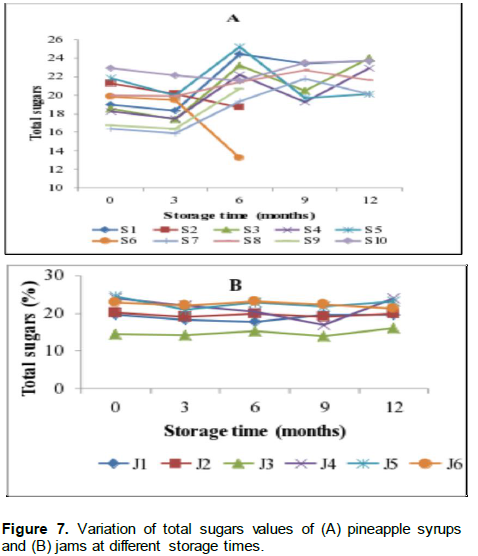
Results in Figure 7 showed that total sugars increased in most of the syrups up to 12 months of storage. The levels ranged from 16.41 to 19.30% in S7 and 22.95 to 23.70% in S10 at initial point of storage and at 12 months of storage, respectively. The increase in total sugars levels started from the third month of storage (Figure 7A). There were also no significant changes (p>0.05) in total sugar content of jams throughout the storage period and the levels ranged from 14.53% in jams J3 to 24.47% in J5 at the initial storage time (Figure 7B).
The levels of total sugars in nectars were very low ranging from 0.01% in N3 to 6.25% in N9 at the initial stage of storage. They did not change significantly up to the end of the storage period for the majority of nectars.
The increase in total sugars during the storage period in this study followed the same trend of increase in reducing sugars over the storage period reported by Chia et al. (2012). The non-significant changes in total sugars in nectars could also be justified by the non-significant changes observed in reducing sugars over the storage period. The total sugars in this study were higher than the total sugars reported by Camara et al. (1995). Sugar patterns can be used for detecting an inappropriate admixture of sugar solution or fruit juices (Fügel et al., 2005). Consequently, it is possible that more sugar was added in the studied products than the maximum permissible levels.
Ethanol
The majority of the samples did not have ethanol throughout the storage period. This is a positive aspect for these processed pineapple products as the Codex standards state that ethanol should not exceed 0.3% (CAC, 2005b). Most of the syrups did not have alcohol throughout the storage period. The levels of alcohol above the recommended level were however detected in four out of 10 syrup samples (S2, S3, S8 and S9). Alcohol levels ranged from 0.32 to 1.22% in these syrups. There was no detection of alcohol in all nectars up to the second month of storage. The majority of the jam samples had slightly higher levels of ethanol than the recommended amount at six months of storage. Those levels were in the range of 0.3 to 0.33%. There was no alcohol detected in jams coded J2 and J6 from the two successful, well trained and well equipped medium fruit processing enterprises. These observations show that there was fermentation going on due to low sugar content in some of the products, improper pasteurisation and contamination.