ABSTRACT
This study evaluated the rheological characteristics and baking qualities of flours from five different Nigerian grown wheat grains namely Atilla (ATL), Cettia (CET), Reyna 28 (REY), Seri MSH (SER) and Norman (NOR) along with a market brand of imported wheat flour which served as the control (CON). Rheological characteristics of the improved flour samples were studied using the Mixolab and a standard Chopin + protocol. The maximum torque during mixing (C1), the protein weakening due to mechanical work and temperature (C2), starch gelatinization (C3), stability of the starch gel formed (C4), starch retrogradation during the cooling stage (C5) were all determined. Results showed that water absorption of the improved flour samples ranged from 57.4 to 67.4% with the least value in CET and the highest in NOR. The lower water absorption of CET dough seemed to affect its stability and development. Dough development time (DDT) ranged from 0.63 to 2.17 min, with REY recording the highest value and CET the least. The physical characteristics of the bread in terms of loaf weight, volume and specific volume were also determined using standard analytical procedures.The specific volume, which is an important index of loaf quality ranged from 3.41 cm3/g in CON to 3.85 cm3/g in REY. The study revealed that though there were variations in the rheological characteristics of the Nigerian grown wheat varieties compared with the imported control, nonetheless, bread loaves of good and acceptable quality can be produced from the Nigerian local wheat flours.
Key words: Rheological characteristics, baking quality, Nigerian grown wheat, Mixolab, physical characteristics.
Flour from wheat (Triticum aestivum), of both hard and soft types, have been the major ingredient for leavened
bread for many years because of its functional proteins. In Nigeria, wheat bread is widely acceptable and
consumed both in the rural and urban areas as a consequence of changing taste, convenience and consumer subsidies. Wheat, however, is of temperate origin (Edema et al., 2005) and Nigeria has been unable to meet her requirement as a result of climatic incompatibilities, hence the country has had to rely on importation which has become rather heavy and unbearable.
The current annual value of wheat importation in Nigeria is about N635 billion whereas the total importation from 1999 till 2010 (a period of about ten years) is N1.087 trillion ($6,792,934,000) (FAOSTAT, 2015). This is a clear indication of our high dependence on foreign wheat and the need to curtail it by finding suitable local alternatives. The high demand for bread, noodles, pasta, crackers and biscuits (cookies) in Nigeria has contributed to the increased demand for flour from wheat as the basic raw material for these products and recent consumption market is estimated at close to $1 billion in U.S. exports for FY 2014 (USDA, GAIN Annual report, 2014).
In 2010, African countries spent more than $12.5 billion and Nigeria alone spent about $4.0 billion to import wheat. In Nigeria, wheat is produced commercially under irrigation, within latitudes 10° to 14° N between November to March, during the cold harmattan period of the year, which provides the much needed low temperature of 15 to 20°C for its optimum production. The improved varieties used in this study gave good grain yields of 5.0 to 8.0 t/ha with Norman giving the highest yield of 8.0 t/ha while Reyna-28 and Atilla Gan Atilla gave average grain yields of 6.1 and 5.0 t/ha, respectively. Seri MSH and Cettia have a potential yield of 5.0 t/ha. This is hoped to bring about the positive improvement capable of meeting domestic wheat requirement of 3.5 million metric tonnes, thereby reducing the huge import bill of the Nigeria Government.
Leavened bread is a baked product that is universally accepted as a convenient food and desirable to all population groups, irrespective of social or economic status. Its origin dates back to the Neolithic era and it is still one of the most consumed and acceptable staple in all parts of the world (Selomulyo and Zhou, 2007). It is basically made of strong wheat flour, a leavening agent, fat, sugar, salt and water (Badifu et al., 2005). In Nigeria, bread has become the second most widely consumed non-indigenous food product after rice (Shittu et.al., 2007) and is an important source of nourishment to Nigerians, taken extensively in many homes and eateries.
The most common type of bread produced in Nigeria is the white bread. About 6.2 billion loaves (or 5.2 million tons) of bread are supplied into the Nigerian market annually by domestic production from over 20,000 bakeries in the country and also through influx from neighboring countries (http://mumpreneur.ng/product/industrial-profile-cassava-bread-production). The estimated monetary value is about N1.05 trillion per annum (FAOSTAT, 2015). These statistics are a clear signal of the need to investigate the development and utilization of improved varieties of locally grown wheat, in order to reduce the nation’s expense on wheat importation and thereby conserve foreign reserve.
The behaviour of wheat flour when mixed with water and the corresponding rheological properties of the dough formed are very important indices for product development, with respect to product quality and process efficiency [Collar and Armero, 1996; Moreira et al., 2010]. During the bread making process, flour composites are subjected to mechanical work and heat treatment that promote changes in their rheological properties (Bollaín and Collar, 2004). The unique dough forming and bread making property of wheat is attributed to gluten, the protein network formed when wheat flour is hydrated and subjected to mechanical shear.
This study therefore investigated the quality characteristics of some improved wheat varieties grown in Nigeria, in terms of the rheology and baking characteristics, in order to determine their suitability for use in the baking industry. This is in line with the current Agricultural Transformation Agenda of the Federal Government of Nigeria.
Flour samples from improved wheat varieties, coded ATL, CET, REY, SER and NOR, supplied by the Lake Chad Research Institute, Nigeria were evaluated along with a market brand of imported wheat flour which served as the control (CON). The control flour and other baking materials such as fat, baker’s yeast, sugar and salt were purchased from a local market in Lagos, Nigeria.
Mixolab analysis and rheological properties of the flour samples
Rheological properties of dough are very important indices for product development in terms of product quality and process efficiency. During the baking process, wheat flour samples are subjected to mechanical work and heat treatment that promote changes in their rheological properties. The unique dough-forming and bread making properties of wheat is attributed to gluten protein, which is formed when wheat flour is hydrated and subjected to mechanical shear (Roselle et al., 2007). The Mixolab by Chopin Technologies is a test equipment for determining the rheological behaviour of dough, (accepted as ICC standard method No. 173), and is based on the water absorption, mixing, gluten, gelatinization, amylase activity and retrogradation properties of the flour. The preparation and characterization of the dough was according to Mixolab standard method (Chopin, 2009). The calculated quantity of wheat flour (from the equipment software) was placed into the Mixolab bowl and subjected to hydration, mixing and heating according to the standard Chopin+ protocol, with a setting of 80 rpm mixing rate, 75 g dough weight, 30°C tank temperature and a total analysis time of 45 min. Parameters obtained from the recorded curve include: water absorption (%) or water required to obtain a torque of 1.1 N ±0.05;C1, which is the first maximum point on the curve at 30°C; T1, which is dough development time or time to reach C1 (in min); stability (in min), which is time at which the torque produced is greater than C1; C2, which is the degree of softening or protein weakening (in Nm) and is the first minimum on the curve at 90°C; C3, which is the peak torque or the maximum torque (in Nm)after heating and during the holding stage and is the second maximum on the curve; C4, which is the second minimum indicating amylase activity and stability of the hot gel formed and C5, which is the last point on the curve and measures starch retrogradation during the cooling stage.
Evaluation of the baking quality of the flour samples
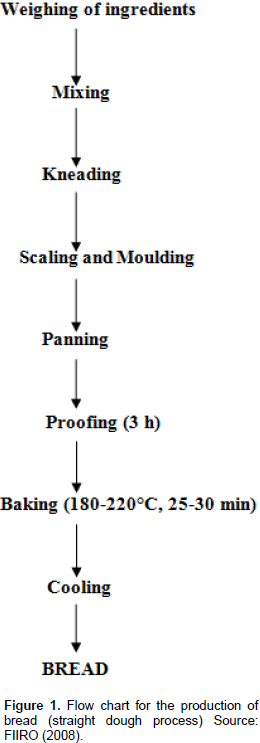
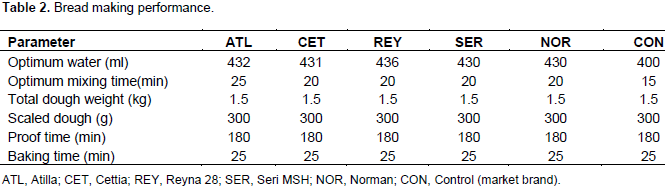
Baking performance was done using the straight dough bread making method (Figure 1), using parameters as recorded in Table 2 and the resulting bread loaves were evaluated in terms of volume, weight, crust and crumb characteristics. The loaf weight in grams was taken after baking and cooling, using the laboratory scales (CE 410I, Camry Emperors, China). The loaf volume in cm3 was determined using seed displacement method (AACC, 2000, Standard 10-05).
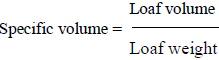
The specific loaf volume (volume to mass ratio) in cm3/g was calculated thereafter as:
Statistical analysis
The data obtained for physical characteristics of the test bread samples were expressed as mean of triplicate values ± standard deviations and subjected to analysis of variance (ANOVA) using Statistical Package for Social Sciences (SPSS) software. Duncan Multiple Range Test was used to determine significant differences between the samples (p<0.05).
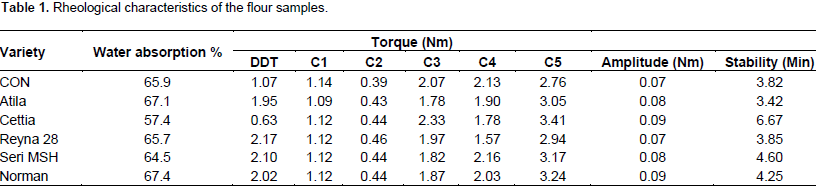
Table 1 shows the rheological parameters of the dough. Results show that water absorption ranged from 57.4 to 67.4% having the least value in CET and the highest value in NOR. Water absorption is the quantity of water required for adequate consistency, in order to obtain a torque of C1=1.1±0.05 Nm according to the standard Chopin + protocol used. It is an important dough property which affects bread quality and shelf life. The C1 figures taken at the start of the test, during the constant temperature period in which dough mixing characteristics are measured, were within the stipulated 1.10±0.05 Nm for all the samples. The values ranged from 1.09 to 1.14 Nm, with the least in ATL and the highest in CON.

Dough development time (DDT) is the time to reach C1. This ranged from 0.63 to 2.17 min and REY recorded the highest value while the least was recorded by CET. The stronger the flour, the longer it takes. Reports indicated that DDT is strongly influenced by flour protein, gluten properties and flour particle size (Catteral, 1995; Rasper and Walker, 2000). Amplitude is the curve width at C1 and indicates the protein quality or elasticity of the dough. The higher the figure, the more elastic is the dough. Values ranged from 0.07 to 0.09 Nm with the highest recorded by CET and NOR while REY and CON had the least.
Dough stability is the time (in minutes) when the torque exceeds C1 and is a measure of dough resistance to kneading. The higher the figure, the stronger is the dough. It ranged from 3.42 to 6.67 min with CET having the highest dough stability and ATL the least. The lower water absorption of CET dough seemed to influence its stability and development. This might be due to the competition between the starch granules and flour proteins for available water, which consequently affected the visco-elastic behaviour of the dough (Hatcher et al., 2009). The decrease in water absorption resulted in an increase in dough cohesiveness which explains the increased stability of the dough. Dough stability is affected mainly by gluten quality and its resistance to the kneading forces. Gluten properties are in turn determined by many factors including wheat variety, agro ecological conditions during planting, protease activity and milling conditions (Catteral, 1995; Rasper and Walker, 2000).
C2 is a measure of dough weakening due to protein reduction. As dough temperature increases during mixing, consistency decreases and the degree of decrease depends on protein quality. It is a function of mechanical work and temperature. It ranged from 0.39 to 0.46 Nm with the highest value in REY. C3 is an indication of starch gelatinization during the heating and cooking stage. It describes the starch behavior which is observed as an increase in consistency of the dough and the increase is dependent on the quality of the starch. The value ranged from 1.78 to 2.33 Nm, with CET having the highest. The amylase activity and the physical breakdown of the starch granules are associated with a reduction in viscosity in the fourth stage. The torque at C4 gives an indication about the rate of enzymatic hydrolysis and the stability of the hot gel formed. The lower the value, the less stable is the starch gel. SER had the highest value of 2.16 Nm, implying the most stable gel in the hot phase. The torque (C5), is an indication of retrogradation or re ordering of starch molecules during the cooling phase and implies how shelf stable the flour product will be. Of the local wheat test samples, REY had the least and closest value to the control.
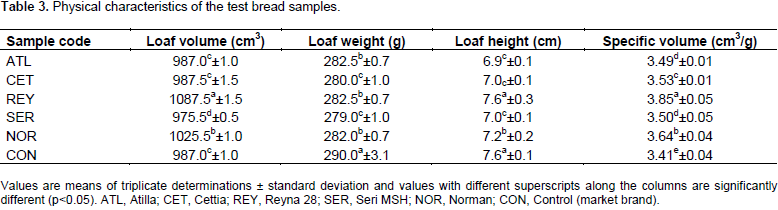
The result of the bread making performance is shown in Table 2. REY showed the highest optimum water uptake (436 ml) with a mixing time of 20 min, followed by ATL having 432 ml optimum water uptake but with a higher mixing time of 25 min. Water must be added to the optimal absorption level so that dough can reach a stage of maximum development. Reports have shown that optimal water uptake and mixing time are major factors for dough development and are mainly influenced by the type of wheat, protein content of flour, type of mixer as well as mixer speed (Sliwinski et al., 2004; Abang Zaidel et al., 2010). The physical characteristics of the bread; loaf weight, volume and specific loaf volume are shown in Table 3. Loaf weight ranged from 279.0 g in SER to 290.0 g in the control (CON) and the higher value in CON was found to be significant (p<0.05), compared with the other samples. Loaf volume ranged from 975.5 to 1087.5 cm3 with the highest value in REY and the least in SER. Specific volume ranged from 3.41 cm3//g in CON to 3.85 cm3//g in REY and the specific volume of REY was found to be significantly higher compared with the other bread samples.

The specific loaf volume is regarded as the most important bread characteristic as it provides a quantitative measure of baking performance (Tronsmo et al., 2003). Among the five flour samples tested, the study revealed that REY had the highest loaf volume and specific loaf volume. According to Lin et al. (2009), China Grain Product Research and Development Institute in 1983 documented that specific loaf volume for standard bread rangeD from 3.5 to 6.0 cm3/g in which variation in loaf volume could be attributed to different rates of gas evolution and the extent of starch gelatinization. The loaf height also gives an indication of the raising or swelling power of the dough, since same weight of the samples was placed in baking pans of same dimensions. CON and REY were the tallest loaves, with a height of 7.6 cm, and ATL the shortest, with 6.9 cm.
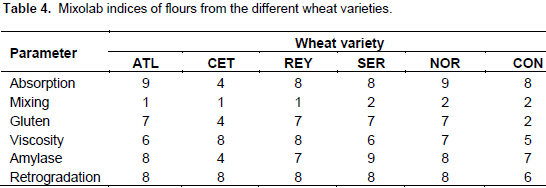
Table 4 presents the Mixolab indices of the wheat doughs. The absorption index is a function of the flour components (starch, protein, fibre and additives). It ranged from 4 to 9 with ATL and NOR having the highest and CET recorded the least. The higher the value, the more is the water required for dough formation. Mixing index shows the behavior of the dough during mixing, accounting for dough stability, development and weakening. A high value corresponds to high dough stability in mixing. All the samples could be considered to have low mixing index with values between 1 and 2. Gluten index represents the behavior of the gluten when heating the dough in which high value indicates a high gluten resistance to heating. All the test dough samples had high value of 7 except CET with a value of 4.

Viscosity index shows the maximum viscosity during heating and depends on both amylase and starch quality. High value corresponds to high dough viscosity during heating. CET and REY had the highest index whilel CON was least. Amylase activity index ranged from 4 to 9 with CET having the least and SER the highest. Amylase activity index is a function of the ability of the starch to withstand breakdown. A high value corresponds to low amylase activity and vice versa.Retrogradation index is a function of association and re-arrangement of starch granules and the value is 8 in all the test samples, showing similar retrogradation behaviour, compared with a value of 6 in the control. The higher the index, the shorter the product shelf-life. This is not surprising because the control sample is a market brand and is expected to have been enhanced for optimum performance while the local wheat flours were just crude samples.
Results from this study have shown that though there are variations between the Nigerian grown wheat varieties and the imported control, in terms of some measured parameters, bread samples having good rheological properties and baking qualities can be produced from the local wheat flours and this is a very promising and encouraging starting point. It should be realized that the control flour has been refined and produced to optimum specifications, with added enhancers to give best results, whereas the local wheat flours were crude samples just milled directly from the grain. There is need to involve flour millers to optimize the processing and milling of the locally grown wheat, in order to enhance flour performance. It is recommended that more locally grown wheat varieties be screened, in order to discover other promising ones. Better harvesting procedures and processing conditions are also needed to improve kernel yield and reduce contamination.a
The authors have not declared any conflict of interests.
The authors wish to appreciate the Lake Chad Research Institute Maiduguri, Nigeria for the gracious provision of the improved wheat flour samples used in this study.
REFERENCES
|
American Association of Cereal Chemists (AACC) (2000). Approved Methods of the American Association of Cereal Chemists (10th ed.) St Paul: American Association of Cereal Chemists Inc. Academy Press. pp. 362-421.
|
|
|
|
Abang Zaidel DN, Chin NL, Yusof YA (2010). A review on rheological properties and measurements of dough and gluten. J. Appl. Sci. 10:2478-2490.
Crossref
|
|
|
|
|
Badifu GIO, Chima CE, Ajayi YL, Ogbori AF (2005). Influence of mango mesocarp flour supplementation to micronutrient, physical and organoleptic qualities of wheat based bread. Niger. Food J. 23:59-68.
|
|
|
|
|
Bollaín C, Collar C (2004). Dough viscoelastic response of hydrocolloid /enzyme/surfactant blends assessed by uni- and bi-axial extension measurements. Food Hydrocoll. 18:499-507.
Crossref
|
|
|
|
|
Catteral P (1995). Flour milling. In: Technology of Bread making. Second Edition (SP Cauvain and LS Young eds), Aspen Publishers Inc. Gaithersburg. pp. 296-329.
|
|
|
|
|
Chopin (2009). Mixolab Applications Handbook. Chopin Technologies Publication, France. pp. 9-16.
|
|
|
|
|
Collar C, Armero E (1996). Physico-chemical mechanisms of bread staling during storage: Formulated doughs as a technological issue for improvement of bread functionality and keeping quality. Recent Res. Dev. Nutr. 1:115-143.
|
|
|
|
|
Edema MO, Sanni LO, Sanni AI (2005). Evaluation of Maize-soybean flour blends for sour maize bread production in Nigeria. Afr. J. Biotechnol. 4:911-917.
|
|
|
|
|
FIIRO (2008) Federal Institute of Industrial Research, Oshodi FIIRO Activities on Cassava Processing. pp. 2-43.
|
|
|
|
|
Food and Agricultural Organization Statistics FAOSTAT (2015). Consumption and Trade in Cassava Products. Food and Agricultural Organization Statistics FAO (2015) Trend of Cassava Production in Nigeria, from 1980- 2013.
View
|
|
|
|
|
Hatcher DW, Bellido GG, Anderson MJ (2009). Flour particle size, starch damage, and alkali reagent: impact on uni-axial stress relaxation parameters of yellow alkaline noodles. Cereal Chem. 86(3):361-368.
Crossref
|
|
|
|
|
Lin L, Liu H, Yu Y, Lin SD, Mau J (2009). Quality and antioxidant property of buckwheat enhanced wheat bread. J. Food Chem. 37:461-467.
Crossref
|
|
|
|
|
Moreira R, Chenlo F, Torres MD, Prieto DM (2010). Influence of the particle size on the rheological behavior of chestnut flour dough. J. Food Eng. 100:270-277.
Crossref
|
|
|
|
|
Rasper VF, Walker CE (2000). Quality evaluation of cereals and cereal products. In: Handbook of Cereal Science and Technology: Second Edition, Revised and Expanded (K Kulp, J G Ponte, eds), Marcel Dekker, New York. pp. 505-538.
|
|
|
|
|
Roselle CM, Collar C, Haros M (2007). Assessment of hydrocolloid on the thermo-mechanical properties of wheat using the mixolab. Food Hydrocoll. 21:452-462.
Crossref
|
|
|
|
|
Selomulyo VO, Zhou W (2007). Frozen bread dough: Effects of freezing storage and dough improvers. J. Cereal Sci. 45:1-17.
Crossref
|
|
|
|
|
Tronsmo KM, Faergestad EM, Schofield JD, Magnus S (2003). Wheat protein quality in relation to baking performance evaluated by the Chorleywood bread process and a hearth bread baking test. Cereal Sci. 38:205-215.
Crossref
|
|
|
|
|
Shittu TA, Raji AO, Sanni LO (2007). Bread from composite cassava-wheat flour: I. Effect of baking time and temperature on some physical properties of bread loaf. Food Res. Inter. 40(2):280-282.
Crossref
|
|
|
|
|
Sliwinski EL, Kolster P, Prins PA, Van Vliet T, (2004). On the relationship between gluten protein composition of wheat flours and large-deformation properties of their doughs. J. Cereal Sci. 39:247-264.
Crossref
|
|
|
|
|
United States Department of Agriculture (USDA), Global Agricultural Information Network (GAIN) (2014). Grain and Feed Annual Report, Washington, USA.
|
|