ABSTRACT
Vitamin A levels were analyzed in fortified vegetable cooking oil and maize flour through a commercial food supply chain, from the production line to selected retail outlets using standard procedures over different times of exposure to sunlight. Samples from the production line acted as controls. In all the cases, vitamin A levels decreased at various stages of the supply chain with the least retention in products sold by street vendors. Statistical analysis showed significant losses (p<0.05) in vitamin A after the samples were exposed to sunlight. These results indicate that although food fortification is crucial in making micronutrients available to poor households, especially in developing countries like Malawi, there is need to sensitize retailers on proper handling and storage of these products to minimize losses in the supply chain.
Key words: Fortification, vitamin A, supply chain, sunlight, vegetable cooking oil, maize flour.
Food fortification has recently been highlighted as one way of ensuring the supply of micronutrients to most of the population in the developing world (Heikens, 2007). For example, there have been mass fortification programmes in Zambia, Central America and Egypt (WHO, 2009) with the aim of decreasing micronutrient deficiencies among poor communities, especially children of 6-59 months and lactating women within 8 weeks of child birth (GoM, 2009). A national micronutrient survey conducted in Malawi in 2001 found that 60% of children under the age of five, 57% of women of child bearing age, and 38% of school children were suffering from sub-clinical vitamin A deficiency (VAD) (GoM, 2009). Such high levels of micronutrient malnutrition have been linked to ailments which include low immunity, impaired physical, mental and psychomotor development and severe cases, night blindness. Such effects may affect child’s mental development and in the long term national economic development may suffer. Vitamin A deficiency has been reported to cause childhood blindness to estimated 140 million children worldwide (Combs, 2012). Severe vitamin A deficiency has also been reported in several sub-Saharan countries including Nigeria, Egypt, South Africa, Kenya, Namibia and Tanzania (Klemm et al., 2010). In South Africa, a country with a relatively good economic standing in Africa, it was recently found that 49% of preschool aged children and up to 68% among women of reproductive age had VAD (Mostert et al., 2005). These data are worrisome and certainly suggest an urgent need for interventions.
Despite the severe consequences that result from vitamin A deficiency, the good news is that a diverse diet, which includes foods of animal origin that are rich in preformed vitamin A (esters of retinol), might be sufficient to satisfy the daily requirements of vitamin A. However, in most developing countries, diets are monotonous (Ruel, 2001) and mainly based on cereals and legumes that are poor sources of vitamin A (West et al., 2002; WHO, 1998). Vitamin A is virtually absent in whole-grain cereals and flours. Because vitamin A deficiency results mainly from chronic dietary insufficiency, food fortification has been identified as an effective approach to abate the problem (Klemm et al., 2010). For example, it is possible to fortify flour from cereal grains using a powdered form of vitamin A, retinyl palmitate which has been found to be more stable than retinyl acetate (Combs, 2012). The fortification of vitamin A, which is fat soluble, in cooking oil is even much simpler and cheaper and can be done either with retinyl acetate or retinyl palmitate in oil base (Johnson, 1997).
In a drive to promote the reduction in micronutrient deficiency, the government of Malawi has been advocating for micronutrient supplementation of foods. In addition to iron and iodine, one of the target micronutrient for this exercise is vitamin A and the food vehicles chosen are sugar, vegetable cooking oil and maize flour (Yeudall et al., 2005). Fortifying a widely consumed food product or additive makes it easy to deliver low doses of vitamin A daily to a large number of people (Dary and Mora, 2002). This was the rationale behind the choice of these foods that are consumed by the majority of Malawians most of who live on less than 1 US$ per day. Actually, the current Human Development Index for Malawi is 0.400 and not only ranks Malawi at 141 out of 187 countries with comparable data but also puts it below the average for sub-Saharan Africa which is at 0.463 (UNDP, 2012).
Regardless of whether the vitamin A occurs naturally or has been added to a food product through fortification or other means, the potential exists for losses by chemical or physical means. These losses may also occur due to exposure to light and heat exposure resulting into oxidation (Butt et al., 2007). Vitamin losses are to some extent inevitable in the manufacturing, distribution, storage and preparation of processed foods (SUSTAIN, 1999). Retention of vitamin A in fortified foods is important for determination of the efficacy of the fortification programs. It is therefore important to understand the degree of loss in the supply chain so that proper strategies can be put in place to ensure that the consumer is getting the intended dosage of the micronutrient (Butt et al., 2007). The Malawi Bureau of Standards (MBS) recommends a vitamin A content range of 30 to 60 mg/L for vegetable cooking oil and 10 to 40 mg/l for maize flour (SUSTAIN, 1999).
In Malawi, however, vitamin A losses in the food supply chain have not been evaluated. This study therefore assessed the extent of vitamin A losses in a supply chain of fortified food vehicles which comprised two brands of vegetable cooking oil and maize flour.
The study was done in Blantyre City, Malawi, targeting one major flour producing company ,and two major oil manufacturing factories in Malawi´s commercial capital. One of the oil factories produces vitamin A fortified soybean cooking oil while the other produces vitamin A fortified sunflower cooking oil.
Sample collection from production line
Triplicate samples (1 L each) of freshly produced fortified vegetable cooking oil (sunflower and soybean) were collected from the two sampling points. Triplicate (1 kg) samples of fortified maize flour were also collected from the production line of the flour company. The fortified cooking oil and fortified flour bought form the manufacturing companies acted as a control. Fresh samples from production line were analyzed immediately after sampling and the remaining portions were analyzed after exposure to sunlight at intervals of seven, fourteen and thirty five days.
Sample collection from retail markets
Sampling from the retail markets was done by gathering information on the cooking oil bottles (batch coding and manufacturing date) to determine the most recent batch for use in the study. This was done because it was difficult to trace the same batches that had been sampled from the production line to the targeted retail markets. The most recent batches of soybean cooking oil sampled from Usave supermarket were the ones that had been stored in the shop for fifteen days from the manufacturing date. Ndirande market soybean cooking oil samples were analyzed after being retained by the retailer for six days while Zingwangwa market soybean cooking oil samples were analyzed after being retained by the retailer for seven days. Recent batches for sunflower oil had been in the supermarket for thirteen days on the day of sampling and the sunflower oil from Ndirande and zingwangwa market were three and five days old on the day of sampling. Flour samples collected from Usave supermarket had been stored for ten days from the manufacturing date while Ndirande and Zingwangwa samples were five and six days old respectively on sampling day. Triplicate 1 L samples of the same brands of fortified vegetable cooking oil were bought from a supermarket (USave) and street vendors in two open markets (Ndirande and Zingwangwa) in Blantyre City. Samples of cooking oil and maize flour from the retail markets were analyzed immediately after collection. The percent loss in vitamin A was calculated using the following formula:
Loss (%) = [(initial vitamin A content - new vitamin A content) / initial vitamin A content] x 100
Vitamin A analysis
Vitamin A analysis in oil
Analytical procedures used in vitamin A analysis of the oil samples are those from the manual for internal monitoring of oil fortified with vitamin A (East, Central and Southern African Health Community, 2007). Approximately two grams of oil was weighed into a twenty 5 ml 25 ml volumetric amber flask and mass was recorded to four decimal places. Dichloromethane was added to the flask to dissolve the oil and mixed thoroughly. The same process was repeated using unfortified (blank) oil. Absorbance reading of samples and unfortified control was read on a spectrophotometer at 325 nm. Retinyl palmitate concentration of the oil sample was estimated using the following equation:
Where Abs corrected = Abs sample – Abs unfortified oil; Vf = final volume; CF=correction factor of the spectrophotometer, ideally; a= retinyl palmitate absorption coefficient in dichloromethane (mg-1 cm-1 L) 0.094; w= weight of sample.
Vitamin A analysis in flour
Vitamin A in flour was determined using spectrophotometric method (AOAC, 2002). About 0.05-1 g of flour and thick porridge samples were weighed using analytical scale (Model: ADAM PW 124) into 50 ml conical centrifuge tube. Six milliliters of dichloromethane was added to samples. The mixture was vortex for 2 min, and then 1.0 ml of methanol was added to the mixture and vortexed for 2 min. Ten milliliters of distilled water was added to the mixture, the vortex for 1 min. The mixtures were centrifuged for 2 min to separate the two phases. The dichloromethane phase went to the bottom. Using the Pasteur pipette, the flour pellet that were formed between the two liquid phase was set aside, and then the organic phase was transferred in to 10 ml measuring cylinder. The mixture was left to stand and the remaining water was removed with a Pasteur pipette, then the volume of the extract was recorded. The volume of extract was used to calculate the concentration. The extract was used for the determination of vitamin by directly recording the absorbance at 325 nm.
Preparation of standard vitamin A solution
One hundred milliliters amber was tare on an analytical balance. Using the pipette, 75.6 mg of standard retinyl palmitate (USP) was transferred into volumetric flask. Then dichloromethane was added to the flask to dissolve the vitamin A and make up the volume. Taking into account the actual concentration of the stock solution, appropriate aliquots was pippeted into a set of 50 ml amber volumetric flasks to give a set of standard solutions. A standard plot was prepared by reading the absorbance of the standard solutions of vitamin A. To 50 ml of volumetric flask, 0.1, 0.2, 0.3, 0.4 and 0.5 ml of standard solution was pippeted, then made up to the volume. The absorbance of these solutions was read at 325 nm and a standard plot was made. The absorbance of sample extract was measured and compared against the standard plot to determine the concentration. The following formula was used to calculate vitamin A concentration in samples. The concentration of vitamin A in extract of samples, treated in a similar manner to the standard solution was calculated using slope and constant of the standard plot.
Absorbance = Slope x concentration + constant
Therefore
Concentration of vitamin A = (Absorbance – Constant) / slope of plot
Concentration of vitamin A (mg retinol/Kg Flour ) would therefore be according the following:
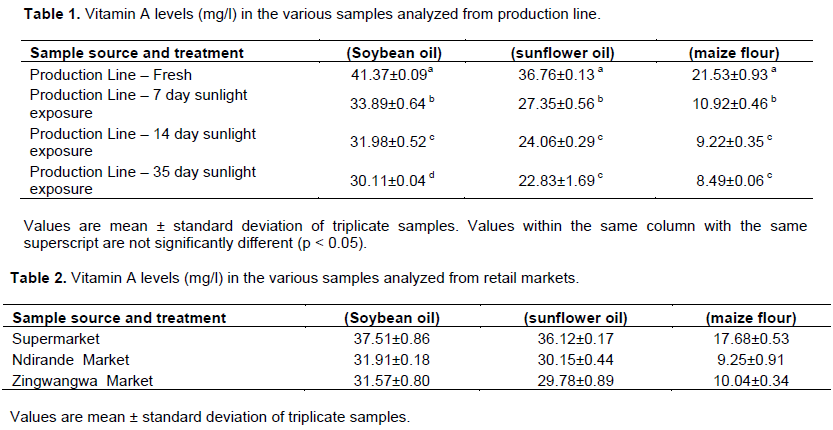
The Malawi Bureau of Standards recommends 30-60 mg/l (Malawi Standard 51, 1988), in vegetable cooking oil and 10-40 mg/l in maize flour. This study results generally indicated varied vitamin A losses in all samples along the supply chain and during exposure to sunlight but drastic changes were observed in maize flour which lost up to 61% after 35 days of exposure to sunlight and an average of 55% in samples from street markets (Table 1). Actually, after two weeks of exposure to sunlight, maize flour had already lost most of the vitamin A to levels below the Malawi Bureau of Standards minimum value of 10 mg/l. The vitamin A loss in maize flour could be attributed to storage conditions (left in open basins at the market) of the flour which led to direct exposure to light.
One way of analysis of variance ( ANOVA) showed that there was significant loss of vitamin A levels in fortified sunflower oil after 35 days of sunlight exposure as compared to fortified soybean oil; 40% versus 27% (p < 0.05) respectively. The results obtained in this study for vitamin A loss in fortified soybean oil are in agreement with the finding of Puysuwan et al. (2007) who noted that fortified soybeans oil in losed PET bottles exposed to sunlight for 4 weeks at room temperature reduced thr initial vitamin A concentration by 27.1 ± 12.1% without accounting for the oxygen exposure upon opening.The vitamin A losses in oils and maize flour from samples from street vendors (Table 2) could be attributed to prolonged exposure to sunlight and also the nature of the packaging material used (sachets for oils and basins for flour) by the vendors (Chakravarty,2000). This is so because packaging is also a contributing factor to the losses in Vitamin A (Oluwalana et al., 2015).
Loss of vitamin A in vegetable cooking oils was lower than in maze flour and this could be attributed to the fact that oil stabilizes retinol and delays oxidation of the vitamin (Dutra- de – Oliveira, 1994, Pignitter et al., 2012).Though the samples used were produced by large manufacturing industries in Malawi, the authors acknowledge the limitation that the sampling points were only in one location (Blantyre). Other retailers who also serve a large portion of the population were left out, making the findings suggestive of the likely trend to be observed nationwide rather than being conclusive. The study did not measure the peroxide values of the oils which are also influenced by exposure to sunlight. For this reason, it is recommended that further studies should include a measure of the peroxide values of the oils which would give an indication of the quality (Chabiri et al., 2009) and storage stability of the product.
This study shows loss of vitamin A in the commercial food supply chain of vegetable cooking oil and maize flour upon exposure to sunlight. Handling of vitamin A fortified foods should therefore be away from sunlight.The study also revealed higher vitamin A lose in maize flour than vegetable cooking oil when exposed to sunlight for the same duration. Sunflower cooking oil also exhibited higher vitamin A losses than soybeans oil.It is therefore recommended that more effort in future interventions of abating vitamin A deficiency should focus on soybean cooking oil as a vehicle. Retailers should also be sensitized on the importance of proper handling and storage of fortified cooking oil and maize flour to avoid loss of vitamin A.
The authors have not declared any conflict of interests.
The authors thank the University of Malawi through the Department of Physics and Biochemical Sciences for financially supporting this study.
REFERENCES
|
AOAC (2002). Official Methods of Analysis of Association of Official Analytical Chemist, 17th ed., Arlington Virginia: Association of Official analytical Chemist. Chapter 32, pp. 1, 2, 23 and 43.
|
|
|
|
Butt MS, Arshad MU, Alam MS, Nadeem MT (2007). Bioavailability and storage stability of vitamin A fortificant (retinyl acetate) in fortified cookies. Food Res. Int. 40:1212-1219.
Crossref
|
|
|
|
|
Chabiri, SA, Hati SS, Dimari GA,Oguguaja VO (2009). Comparative quality assessment of branded and unbranded edible vegetable oils in Nigeria. Pac. J. Sci. Technol. 1(2):927-934.
|
|
|
|
|
Chakravarty I (2000). Food-based strategies to control vitamin A deficiency. Food Nutr Bull 21:135-43.
Crossref
|
|
|
|
|
Combs GF (2012). Vitamin A. The Vitamins (Fourth Edition) 2012. pp. 93-138.
Crossref
|
|
|
|
|
Dary O, Mora JO (2002). International Vitamin A Consultative Group. Food fortification to reduce vitamin A deficiency: International Vitamin A Consultative Group recommendations. J. Nutr. 132:2927-2933.
|
|
|
|
|
Dutra-de-Oliveira JE (1994). Effect of heat treatment during cooking on the biological value of vitamin A fortified soybean oil in human. Int. J. Food Sci. Nutr. 45:2003-2017.
|
|
|
|
|
East, Central and Southern Health Community (2007). Manual for internal monitoring of oil fortified with vitamin A (Quality Assurance and Quality Control, QA/QC). Arusha, Tanzania.
|
|
|
|
|
GoM-Malawi Government (2009) National nutrition policy and strategic plan (2007-2011). Office of president and Cabinet, Department of Nutrition HIV and AIDS. Lilongwe, Malawi.
|
|
|
|
|
Heikens GT (2007). How can we improve the care of severely malnourished children in Africa? PLoS Med; 4(2):45. doi: 10.1371/journal.pmed.0040045.
Crossref
|
|
|
|
|
Johnson LE (1997). Oils, fats and margarine: overview of technology. Food Fortification to End Micronutrient Malnutrition. State of the Art :22-26 The Micronutrient Initiative, International Development Research Centre Ottawa, Canada.
|
|
|
|
|
Klemm RDW, Keith P, West Jr., Amanda CP, Johnson Q, Randall P,
|
|
|
|
|
Malawi Standard 51 (1988). Edible oil – General standard, Malawi Bureau of Standards, Blantyre, Malawi.
|
|
|
|
|
Mostert D, Steyn NP, Temple NJ, Olwagen R (2005). Dietary intake of pregnant women and their infants in a poor black South African community. Curationis 28:12-19.
Crossref
|
|
|
|
|
Oluwalana IB, Oluwamukomi MO, Toriola BO, Karim OR (2015). Influence of packaging materials and storage conditions on the Vitamins A and E storage stability of Palm Oil in Nigeria. Adv. Res. 4(3):191-202.
Crossref
|
|
|
|
|
Pignitter M, Somoza V (2012). Are Vegetable oils always a reliable source of vitamin A? A critical evaluation of analytical methods for the measurement of oxidative rancidity. Sight and Life, 26:18–27
|
|
|
|
|
Puysuwan L, Chavasit V, Sungpuag P, Hediger D, Punvichai T (2007). Feasibility and use of vitamin A fortified vegetable oilsamong consumers of different socioeconomic status in Thailand. Food Nutr. Bull. 28:181−188.
Crossref
|
|
|
|
|
Ruel MT (2001). Can Food-Based Strategies Help Reduce Vitamin A and Iron Deficiencies? A Review of Recent Evidence. International Food Policy Research Institute; Washington, DC, USA.
|
|
|
|
|
Solon FS, Sancex-Fermin LE, Wambangco LS, Solon MAM (1999). Final report-Iron and vitamin A stability in flour and products. Manila: Nutrition Center of the Philippines.
|
|
|
|
|
SUSTAIN (1999). The progress of wheat flour fortification with vitamin A in the Philippines. Final Report of the Micronutrient Assessment Project U.S. Agency for International Development, SUSTAIN Washington, DC.
|
|
|
|
|
UNDP-United Nations Development Programme (2012). Human Development Report 2011/2012-Country Fact Sheets –Malawi.
|
|
|
|
|
West CE, Eilander A, Van Lieshout M (2002). Consequences of revised estimates of carotenoid bioefficacy for dietary control of vitamin A deficiency in developing countries. J. Nutr. 132(9):2920S-2926S.
|
|
|
|
|
WHO-World Health Organization (1998). Safe vitamin A dosage during pregnancy and lactation. Document WHO/NUT/98 4 World Health Organization Geneva, Switzerland 2.
|
|
|
|
|
WHO-World Health Organization (2009). Global prevalence of vitamin A deficiency in populations at risk 1995–2005: WHO Global Database on Vitamin A Deficiency. WHO, Geneva.
|
|
|
|
|
Yeudall F, Gibson RS, Cullinan TR, Mtimuni B (2005).Efficacy of a community-based dietary intervention to enhance micronutrient adequacy of high-phytate maize-based diets of rural Malawian children. Public Health Nutr. 8:826-836.
Crossref
|
|