ABSTRACT
Robusta coffee is known to be high yielding than Arabica coffee, since it is more vigorous in growth. However, it is limited by the inferior cup quality. The aim of the study was to evaluate the performance of the Arabusta hybrids and its backcross derivatives for bean physical characteristics and organoleptic properties including their interrelationship. Nineteen coffee genotypes were evaluated at Siaya ATC and KALRO-Alupe, using randomized complete block design with three replications. Data on the bean grades and sensory traits was carried out on beans harvested in the year 2018. The results indicated that there was a significant variation on both the sensory and bean grade traits from the two locations. On average, Arabusta hybrids showed better performance on bean traits when compared to its backcrosses and Robusta. There was a highly significant positive correlation between the sensory traits which had highly significant positive association with aftertaste (r=0.96), aroma (r=0.84), balance (r=0.85), flavor (r=0.96) and overall standard (r=0.96). The positive significant correlation between the 100 bean weight and the AA bean size is an indication that weight of beans can be used in predicting the bean sizes. The interspecific hybridization enables the transfer of good cup quality attributes from Arabica coffee to Robusta coffee.
Key words: Flavor, Arabica, bean grade, quality, Arabica, Robusta, environment, variation.
The most common popular beverages that are consumed globally are coffee and tea, with over 148 million cups of coffee being consumed on an annual basis; since it is the most preferred drink (ICO, 2019a). Coffee is the second most traded commodity after oil and more research is being carried out on coffee due to its distinct characteristics in terms of flavor and aroma. This is in order to ensure that the consumers are supplied with coffee that meets the consumer preferences (Belay et al., 2016). The cup quality of Arabica coffee is superior to that of Robusta coffee; thus, Arabica coffee is usually blended with Robusta coffee on 50/50 basis to improve Robusta sensory traits and the crema formation most of the times (Folmer et al., 2017; Dias et al., 2018; Liu et al., 2019). Cup quality is termed as drinking quality or liquor quality, being one of the most important attributes of coffee (Muschler, 2001) and it is key in price determination in coffee market (Kathurima, 2013; Curzi et al., 2014; Barbosa et al., 2014). For coffee exporting countries such as Kenya, the production and supply of quality coffee is important since the prices they fetch are dependent on this factor. This is because the consumers discriminated the different coffees based on their origin, cup quality and the biochemical content (Fridell, 2014). Sunarharum et al. (2014) reported that the quality of coffee results from interaction between genotype and the environment (G x E) and consumers of high quality coffee may prefer labeling of the species and the country of origin (Cheng et al., 2016).
The mostly discussed factors influencing cup quality of coffee include temperature, altitude, soil, rainfall patterns, humidity, post-harvest practices, harvesting time (maturity) agronomic practises and genetics (Hameed et al., 2018; González et al., 2019). Assessment of coffee quality, in coffee breeding, is treated with equal importance as disease resistance and high yield. Robusta coffee is inferior in cup quality when compared to Arabica coffee; thus fetching low market prices. The interspecific hybrids between Robusta and Arabica are expected to have better cup quality than Robusta coffee. Robusta production outcompete Arabica coffee because of lower production costs; since they are tolerant to most pests and diseases and is more vigorous in growth than Arabica coffee (Mendes et al., 2001). Robusta coffee competes with Arabica in terms of sales, as it fetches lower prices (ICO, 2019b). Aroma and flavor derived from Arabica make it denser and richer, because of the infusions derived unlike Robusta (Nebesny and Budryn, 2006). A study by Michaela et al., 2013 showed that with increased quantities of Robusta in a mixture of Arabica and Robusta, there was increased fullness of extracts, yield extraction together with the astringent bitter tastes on the sensory performance; while with increase in Arabica there was an intense aroma felt in the brew.
Sensory analysis is the commonly used procedure in determining taste and flavor of coffee brews. However, being less objective than instrumental methods, it can be done in shorter times and can simultaneously be used to determine other traits (Nebesny and Budryn, 2006). The thousands of compounds emitted during roasting, determines the quality of the beverage since it affects the expression of different traits including the taste and aroma (Kathurima et al., 2009; Gichimu and Omondi, 2010). Determining the relationship to describe the effect of one of the compounds on sensory performance of coffee containing the volatile compounds is extremely difï¬cult (Sanz et al., 2002). Hence, sensory analysis has remained the most preferred technique in evaluating the performance of various cultivars on cup quality. The assessment of the sensory attributes of roasted coffee is carried out organoleptically, using a panel of tasters of coffee; since it is a reliable process for selection of genotypes during breeding. Acidity, fragrance, aroma, flavor, preference, body and balance are the organoleptic attributes that define the quality of coffee beans (González et al., 2019).
Bean size, which is defined as a grade in the market, is key in determining the final market price; since smaller bean sizes fetches lower prices than the larger coffee beans. The shape of the beans is critical in ensuring there is uniform roasting and the beans are sorted using color, to help identify the defective beans and this is done frequently (Batista and Chalfoun, 2014). When roasting is carried out on beans without uniform size, the smaller beans tend to roast faster than big sized beans; thus affecting the overall quality of the cup. During roasting, there is increase in weight loss and volume of beans, thus decrease in the bean density; and the non-defective beans tend to have higher volumes when compared to the defective beans (Noor-Aliah et al., 2015; Ameyu, 2016). The coffee beans may vary based on size, shape and colour depending on the coffee genotypes, availability of water during berry expansion and also the geographical origin (Yuwana et al., 2015). Formal sensory evaluation is more efficient when using a panel of judges than using the opinion of an individual, since it generates more data which is reliable during selection for quality improvement (Hampson et al., 2000). This study was to evaluate different coffee genotypes including Arabusta hybrids by subjecting them to cup quality and bean grade assessment in order to characterize their performance and to assess their relationship.
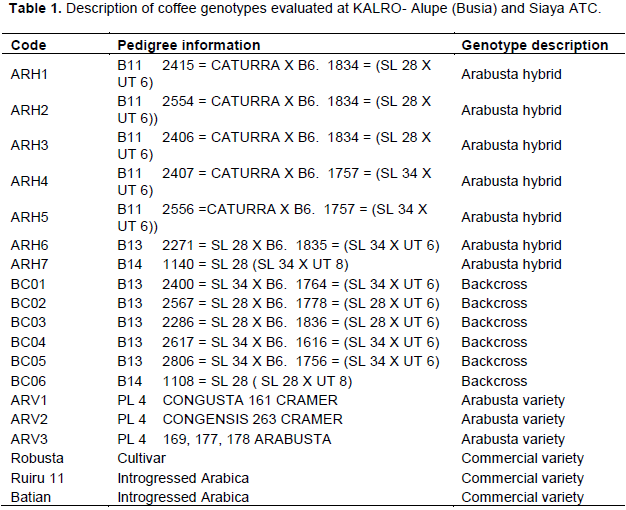
Experimental materials
Nineteen genotypes including seven Arabusta hybrids, six different backcross derivatives of Arabica to Arabusta hybrids were evaluated alongside three Arabusta varieties, Robusta, C arabica (Batian, Ruiru 11 and SL28) (Table 1).
Description of the experimental site and experimental design
The trials were established at Siaya ATC (Siaya County) and KALRO Alupe (Busia County). Siaya lies between 0° 30 N' and 0° 45' E with an altitude that varies from 1,135 to 1,500 m above sea level. The mean annual rainfall is 1,500 mm with most parts of the county receiving between 890 and 1,900 mm; while the annual mean temperatures range from 20.9 and 22.7°C. The soils are well drained, deep to very deep (chromic/orthic acrisols and ferrasols) (Jaetzold et al., 2009). Busia county is also located in western part of Kenya between 0° 30 N' and 34° 30' SE, with an altitude that varies from 1241 to 1343 m above sea level. The mean annual rainfall is 1400 mm, with most parts receiving between 925 to 1900 mm and the annual maximum temperatures range from 26 and 29°C. The soils are developed on basic and intermediate rocks (dolerites and andesites) (Rachilo and Michieka, 1991). The experiment was laid out in a Randomized Complete Block Design (RCBD) with three replications at KALRO-Alupe and Siaya ATC. Five coffee trees were planted per genotype, with a spacing of 3 m by 3 m per plot measuring 855 m2.

Bean processing and grading
Cherry was harvested from each of the genotypes in the year 2018 and was processed independently using the wet method. The cherry was pulped, followed by fermentation, washing and sun drying to attain f 10.5 to 11% moisture content (Mburu, 2004). The coffee husks were de-hulled and 1 kilogram of coffee beans from each coffee genotype were sampled for grading into 7 grades, (AA, AB, PB, C, E, TT, T), using a hand operated hulling machine based on size, shape and density as described by Gichimu et al. (2013). The proportions (%) of each bean grade in one-kilogram sample of the hulled beans were recorded. The beans were separated based on size as determined by the size of the screens of the bean grading machine; while a pneumatic separator was used to separate light beans from grades AA and AB to obtain grade TT beans.
Sensory evaluation of coffee
The proportion (%) of each bean in grade AA and AB for each genotype were recorded and these grades were used to assess cup quality attributes by roasting. A probate laboratory roaster was used in the roasting process and the roasted beans were left to rest for at least 8 h before cupping. Green coffee beans were weighed before and after roasting to determine the roasting degree. After the 8 h rest, the roasted beans were ground into individual cups, ensuring that whole sample was deposited into each cup. Each sample representing a specific genotype was placed into five cups (Kathurima et al., 2009). Samples were weighed to get 8.25g and 150 ml of hot water was added to each cup. The evaluation of the sensory attributes, sensory evaluation, was conducted with five trained judges forming a panel; using the procedures described by described by Lingle (2001). The descriptors measured included acidity, body, balance, fragrance/aroma, flavour, aftertaste, and overall standard as described by SCAA.
Statistical analysis
The bean grade and sensory data were subjected to Analysis of Variance (ANOVA) using GENSTAT statistical software version 18 and effects declared significant at 5% level. The General Linear Model (GLM) was used (Jansen, 1993). Least Significance Difference was used to separate means (Martin et al., 1978). Separate as well as combined analysis of variance was performed on data from the two sites. The sensory data was subjected to cluster analysis using the XLSTAT version 2019; using the unweight pair-group method with arithmetic average (UPGMA) to create a dendrogram based on the Euclidean distances (Hue et al., 2000). The Pearson’s chi-square was used to test the similarities amongst clusters. GENSTAT statistical software was used to compute correlation and to show relationship between bean grades and sensory traits, using the Pearson Correlation Coefficient. The Principle Component Analysis of the sensory characteristics were plotted based on the important principle components (Lattin et al., 2002), using XLSTAT statistical software, version 2012.
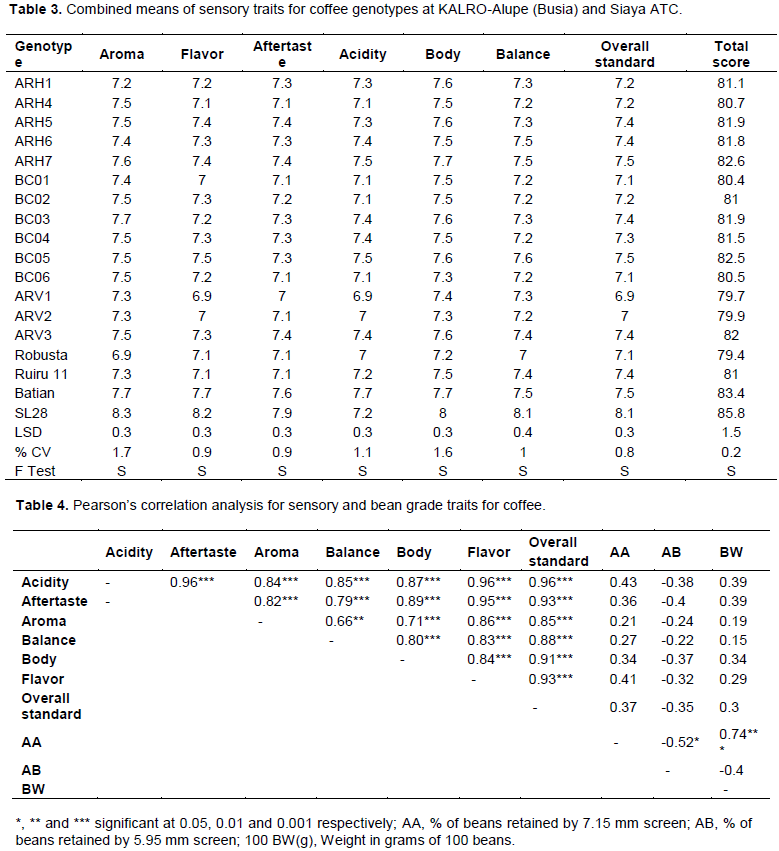
Bean grading
There was a significant variation among the coffee genotypes for bean grade across the two sites. The percentage of E bean grade varied among the genotypes; ranging from 0.2 to 7.2%, where genotype ARH3 recorded significantly (P≤ 0.05) high percentage compared to genotypes BC03 and ARV1 both of which recorded the lowest (Table 2). There was a significant (P≤ 0.05) difference on the percentage of AA bean grade for the coffee genotypes; where ARH3 recorded 38.4%, while ARV2 recorded the lowest percentage of 2.0%. The coffee genotypes recorded significant (P≤ 0.05) differences on the percentage of PB bean grade which ranged from 0.6 to 6.4%, where genotype ARH3 recorded the highest percentage while genotype ARV3 recorded the lowest. The percentage of C bean grade was also significantly (P≤ 0.05) different, where genotype ARV3 was highest with 23.1% and Robusta recorded the lowest with 1.1%. The variation on the 100 bean weight was significant; where genotype ARV3 scored significant (P≤ 0.05) heavier beans of 21 g followed closely by genotype BC04 with 20.7 g, while genotype ARV2 scored 13.7 g (Table 2).
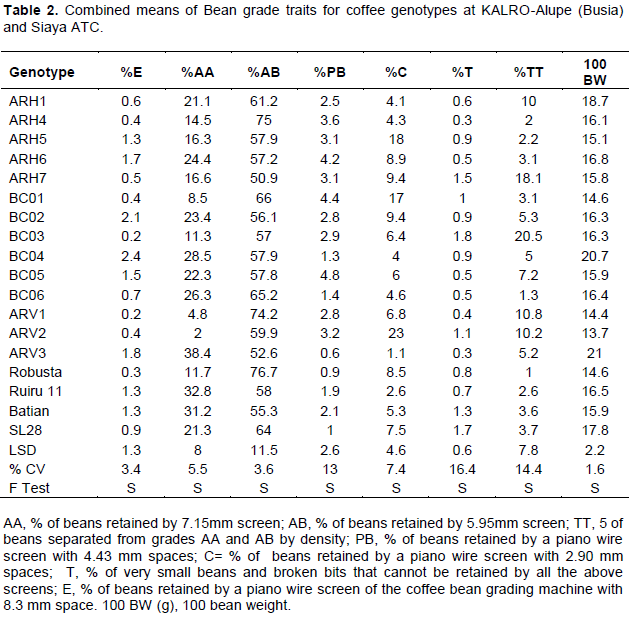
Sensory performance
From the combined mean analysis, there was a significant (P≤ 0.05) difference within the sensory traits among the coffee genotypes for both sites. Genotype SL 28 recorded significantly (P≤ 0.05) high values for all the traits except acidity, when compared to other genotypes (Table 3). Robusta recorded significant (P≤ 0.05) lower values for aroma and body of 6.9 and 7.2 respectively. Genotype ARV1 recorded significant (P≤ 0.05) low values for flavor Aftertaste and acidity when compared with other genotypes of 6.9 and 7.0 respectively; while cultivar Batian recorded high value for acidity. The genotypes that recorded significantly (P≤ 0.05) low values for balance included, ARH4, BC01, BC04 and BCO6 of 7.2 (Table 3).
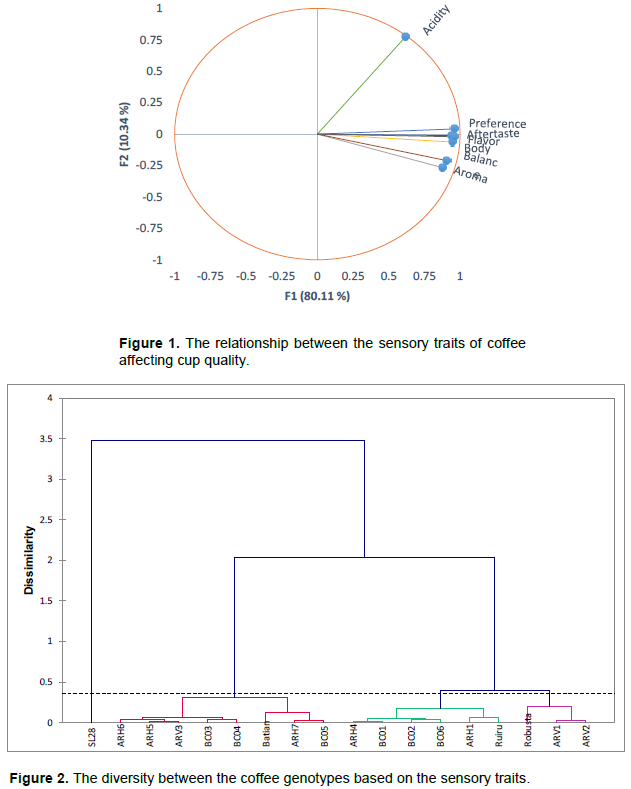
PCA and cluster analysis
The Principal Component Analysis was able to discriminate the scores of the different variables measured. PC1 was 10.34% and PC2 was 80.11%, which was sufficient to discriminate the sensory attributes. Acidity recorded low scores; while flavor and aftertaste recorded high scores respectively (Figure 1). The genotypes grouped together are similar in the sensory attributes. Sl28 which was the best performer in quality on overall score is located on the lower right side of the quadrant on its own and it’s much affected by the balance, aroma, body and flavor (Figure 1). The variation of the sensory traits is further shown using the cluster dendrogram, by means of the seven sensory traits. The continuous broken line in the figure truncates the diagram into four classes which were generated during clustering, using the similarity index (Figure 2). Diversity of the coffee genotypes within classes was 20.53%, while between class diversity was 79.47%.
Correlation between the sensory and bean grade traits
Table 4 shows the correlation coefficients for the sensory traits of coffee genotypes for KALRO-Alupe and Siaya ATC. There were positive significant associations between all the sensory traits amongst the coffee genotypes. Acidity was positively and significantly associated with aftertaste (r=0.96), aroma (r=0.84), balance (r=0.85), body (r=0.87), flavor (r=0.95). Aroma had positive significant associations with balance (r=0.66), flavor (r=0.86). AA bean grade also had positive significant relationship with 100 berry weight (r= 0.74). AB bean grade negatively correlated with all the sensory traits. Bean weight (BW) grade had a positive significant association with acidity (r=0.39), aftertaste (r=0.39), aroma (r= 0.19), body (r=0.34), flavor (r=0.29) and overall standard (r=0.3) (Table 4). The AB bean grade was negatively correlated to all the sensory traits, while the AA bean grade was positively associated with the sensory traits.
The results of the study confirmed that there was significant variation within the coffee genotypes for bean grade traits and the sensory attributes across the two environments. Genotypes ARH2 and ARH3 were not evaluated for these two traits since most of the cherry were floats and this could be as a result of poor fertility. F1 hybrids have shown lower fertility rate and it has been reported that the number of seeds per fruit depends on ovule fertility (Leroy et al., 2006). Therefore, determination of fertility is based on the percentage of floats from the harvested cherry. Various studies have reported significant variations for the bean physical characteristics, including bean grade and the sensory attributes (Gichimu et al., 2012; Abrar et al., 2014; Gimase et al., 2014b; Tefera, 2018). Both the genotypic and environmental factors determine the size, shape and structures of beans produced.
The differences in percentage of grades across the two environments could be attributed to the different rainfall patterns since good rainfall is required during the cherry expansion stage. The plant physiological processes that occur during fruit development, affect the bean development as suggested by Adugnaw et al. (2015). The expansion of the cherry is determined by the rapid fruit expansion after pin head development, where turgor pressure developed by beans during expansion combined with high moisture availability leads to development of big sized beans (Sureshkumar et al., 2013). Photosynthesis also affects bean development with decreased leaf potential; photosynthesis is reduced leading to poor filling of the bean thus affecting the bean grades (Agwanda et al., 2003).
Cup quality is an attribute that depend on several factors for its expression, which include the genotype, environmental factors, the post-harvest processes, agronomic practices, storage, roasting, beverage preparation and also consumer preference (Kathurima, 2013; Hameed et al., 2018). The coffee markets vary and are more specific based on preference of the beverage based on performance of genotypes on sensory traits affecting the brew quality (Kahiu and Aluka, 2016). There was significant variation amongst the coffee genotypes for all the cup quality sensory characteristics.
González et al. (2019) reported the variation in sensory chacteristics among the three Catimor genotypes cultivated in Mexico. The variations of the sensory traits could be attributed to both the genetics of the plant and environmental factors which include rainfall intensity and distribution, soil characteristic, fluctuation of temperatures, humidity, and altitude (Decasy et al., 2003). These environmental factors have effect on maturity and ripening of cherry, which adversely affect the cup quality. The variation within genotypes indicates that it is possible to select genotypes that have good cup quality.
The Arabica coffee genotypes (SL28 and Batian), which are commercial varieties, showed good performance in cup quality together with the Arabusta hybrids and the backcrosses when compared to Robusta. SL28 coffee variety has always been used as a measure of standard for cup quality and therefore the results gave a good indication on the potential of the tested hybrids since on average, the Arabusta hybrids outperformed the Robusta coffee with an average score of 82%. This confirmed that through introgression, there was not only transfer of disease resistance but also other attributes including quality (Leroy et al., 2006). Based on organoleptic evaluation, introgression lines of Arabica have been found to produce good beverage quality (BQ) (Leroy et al., 2006). The sensory data has confirmed that the interspecific hybrids which were bred for improved cup quality can pass for the specialty market as defined by Lingle (2001). A score of more than 80% is regarded as specialty coffee.
Based on the Euclidean distances, four different groups were generated from the cluster analysis and the PCA plots; further confirming the variation amongst the coffee genotypes for the sensory traits (Figures 1 and 2). SL28 which has always been used as a standard measure for cup quality was grouped differently from the other genotypes. The Arabusta hybrids ARH6, ARH5, and ARH5 together with genotypes BC03, BC04 and BC05 grouped together with Batian implies that their relationship in terms of quality is very close and can be selected for good sensory traits when compared to Robusta, which clustered differently and distant from group two. These genotypes were easily differentiated using acidity, aftertaste and preference.
Correlation is key in designing an effective breeding program; thus selecting the traits that positively and significantly correlates to each other. All sensory variables which include acidity, aftertaste, aroma, balance, body, flavor and overall standard positively and significantly correlated with each other. Acidity had a highly significant positive association with aftertaste (r=0.96), aroma (r=0.84), balance (r=0.85), flavor (r=0.96) and overall (r=0.96). With the significant association, traits with a higher correlation such as preference, aroma and aftertaste can be used to select cup quality and this is in agreement with PCA plot results (Figure 1). The negative associations between the AB bean grade characteristics and quality indicates that bean sizes could be dependent more on the environmental factors since the berry expansion and ripening depended on the rainfall and sunlight availability for photosynthesis as reported by Agwanda et al., (2003). Tessema et al., (2011) reported the significant positive associations within the sensory variables. The negative associations between the bean sizes and the sensory traits were reported by Kathurima et al. (2009). Dessalegn et al., (2008) found that there is a positive association between the bean grades and sensory traits. Reyes et al. (2016) and González et al. (2019) did not find any significant correlations between the beans sizes and sensory attributes which is consistent with the findings of this study.
Coffee is a beverage, where flavour is the most important quality parameter and a major motivation for consumer preference; since it is a combination of aroma, acidity and body that creates an overall impression of cup performance (Marin et al., 2008). Flavor has a strong significant association with all sensory traits, easy to determine organoleptically and has relatively high sensitivity in discriminating various genotypes; and this can be used as a single trait in the determination of coffee quality during selection (Agwanda et al., 2003 and Yigzaw, 2005).
The study confirmed that there was genetic variation within the coffee genotypes in both sensory and bean grade traits, since they were grouped into four clusters based on the sensory attributes. Flavor and over all standard were the most important traits in determining the organoleptic characteristics of the genotypes. All the interspecific hybrids analyzed for cup quality recorded more than 80% total score and outperformed Robusta in terms of bean size and therefore can be recommended for commercialization.
The authors have not declared any conflict of interests.
The author appreciates the Director general – Kenya Agricultural and Livestock Research Organization (KALRO), Institute Director- Coffee Research Institute (CRI) and National Research Fund (NRF) for sponsorship. The author also appreciates the coffee breeding unit staff for their support.
REFERENCES
|
Abrar S, Ali M, Solomon E (2014). Processing method, variety and roasting duration effect on physical quality attributes of roasted Arabica coffee beans. Sky Journal of Agricultural Research 3(5): 082- 088.
|
|
|
|
Adugnaw M, Nigussie D, Ali M (2015). Bean quality attributes of Arabica coffees grown in Ethiopia and the potential for discovering new specialty coffees. East African Journal of Sciences 9 (2):121-130.
|
|
|
|
|
Agwanda CO, Baradat P, Eskes A, Cilas C, Charrier A (2003). Selection for bean and liquor qualities within related hybrids of Arabica coffee in multilocal field trials. Euphytica 131(1): 1-14.
Crossref
|
|
|
|
|
Ameyu MA (2016). Physical quality analysis of roasted Arabica coffee beans subjected to different harvesting and postharvest processing methods in eastern Ethiopia. Food Science and Quality Management Vol. 57.
|
|
|
|
|
Barbosa RM, Batista BL, Varrique RM, Coelho VA, Campiglia AD, Barbosa JF (2014). The use of advanced chemometric techniques and trace element levels for controlling the authenticity of organic coffee. Food Research International 61:246-251.
Crossref
|
|
|
|
|
Batista L, Chalfoun S (2014). Quality of coffee beans In: Schwan RF, Fleet GH (Eds.), Cocoa and Coffee Fermentation, CRC Taylor & Francis, Boca Raton, FL (2014), p. 633.
|
|
|
|
|
Belay S, Mideksa D, Gebrezgiabher S, Seifu W (2016). Factors affecting coffee (Coffea arabica) quality in Ethiopia: A review. Journal of Multidisciplinary Scientific Research 4(1):27-33.
|
|
|
|
|
Cheng B, Furtado A, Smyth HE, Henry RJ (2016). Influence of genotype and environment on coffee quality. Trends Food Science Technology 57: 20-30.
Crossref
|
|
|
|
|
Curzi D, Raimondi V, Olper A (2014). Quality upgrading, competition and trade policy: Evidence from the Agri-food sector. European Review of Agricultural Economics 42(2):239-267.
Crossref
|
|
|
|
|
Decasy F, Avelino J, Guyot B, Perriot JI, Pineda C, Cilas C (2003). Quality of different Honduran coffees in relation to several environments. Journal of Food Science 68:2356-2361.
Crossref
|
|
|
|
|
Dessalegn Y, Labuschagne MT, Osthoff G, Herselman L. (2008). Genetic diversity and correlation of bean caffeine content with cup quality and green bean physical characteristics in coffee (Coffea arabica L.). Journal of Science of Food and Agriculture 88:1726-1730.
Crossref
|
|
|
|
|
Dias RCE, Valderrama P, Marco PH, Scholz, dos Santos Scholz MB, Edelman M, Yeretzian C (2018). Quantitative assessment of specific defects in roasted ground coffee via infrared-photoacoustic spectroscopy. Food Chemistry 255:132-138.
Crossref
|
|
|
|
|
Folmer B, Blank I, Hofmann T (2017). Crema-Formation, stabilization, and sensation. In: F. Britta (Ed.). The craft and science of coffee. Ch. 17. London: Academic Press. pp. 399-417.
Crossref
|
|
|
|
|
Fridell G (2014). Fair trade slippages and Vietnam gaps: the ideological fantasies of fair trade coffee. Third World Quarterly 35(7):1179-1194.
Crossref
|
|
|
|
|
Gichimu BM, Gichuru EK, Mamati GE, Nyende AB (2012). Selection within Coffea arabica cv. Ruiru 11 for high cup quality. African Journal of Food Science 6(18):456-464.
|
|
|
|
|
Gichimu BM, Gichuru EK, Mamati GE, Nyende AB (2013). Yield selection within Coffea arabica cv. Ruiru 11. American Journal of Experimental Agriculture 3(1):76-88.
Crossref
|
|
|
|
|
Gichimu BM, Omondi CO (2010). Morphological characterization of five newly developed lines of arabica coffee as compared to commercial cultivars in Kenya. International Journal of Plant Breeding and Genetics 4(4):238-246.
Crossref
|
|
|
|
|
Gimase JM, Thagana WT, Kirubi DT, Gichuru EK, Kathurima CW (2014b). Beverage quality and biochemical attributes of Arabusta Coffee (C. arabica L. x C. Canephora Pierre) and their parental genotypes. African Journal of Food Science 8(9):456-464.
Crossref
|
|
|
|
|
González AK, Lopez AM, Gaytán ORT, Ramos VM (2019). Cup quality attributes of Catimors as affected by size and shape of coffee bean (Coffea arabica L.). International Journal of Food Properties 22(1):758-767.
Crossref
|
|
|
|
|
Hameed A, Hussain SA, Ijaz HU, Ullah S, Pasha I, Suleria HAR (2018). Farm to consumer: Factors affecting the organoleptic characteristics of coffee. II: Postharvest processing factors. Comprehensive Reviews in Food Science and Food Safety 17(5):1184-1237.
Crossref
|
|
|
|
|
Hampson CR, Quamme HA, Hall JW, MacDonald RA, King MC, Cliff A (2000). Sensory evaluation as a selection tool in apple breeding. Euphytica 111(2):79-90.
Crossref
|
|
|
|
|
Hue J, Zhu J, Xu HM (2000). Methods of constructing core collections by stepwise clustering with three sampling strategies based on the genotypic values of crops. Theoretical and Applied Genetics 101:264-268.
Crossref
|
|
|
|
|
ICO (2019a). International Coffee Organization International coffee Council, 124th Session, country coffee profile, Kenya.
|
|
|
|
|
ICO (2019b). International Coffee Organization Coffee market report August. Country coffee profile, Kenya.
|
|
|
|
|
Jaetzold R, Schmidt H, Hornetz B, Shisanya D (2009). Farm management handbook of Kenya, Natural conditions and farm management information, West Kenya. Ministry of Agriculture, Kenya.
|
|
|
|
|
Jansen J (1993). Generalized linear mixed models & their application in plant breeding research Eindhoven: Technische Universiteit Eindhoven.
|
|
|
|
|
Kahiu N, Aluka P (2016). Sensory & organoleptic cup attributes of Robusta coffee (Coffea canephora Pierre ex A. Froehner). Journal of Agricultural Studies 4(1):101.
Crossref
|
|
|
|
|
Kathurima CW (2013). Characterization of coffee genotypes in Kenya by genetic, biochemical and beverage quality profiles. PhD. Thesis, Jomo Kenyatta University of Agriculture and Technology, Kenya.
|
|
|
|
|
Kathurima CW, Gichimu BM, Kenji GM, Muhoho SM, Boulanger R (2009). Evaluation of beverage quality and green bean physical characteristics of selected Arabica coffee genotypes in Kenya. Africa. Journal Food Science 3(11): 365-371.
|
|
|
|
|
Lattin J, Carroll D, Green P (2002). Analyzing Multivariate Data. 1st ed. Duxbury Press.
|
|
|
|
|
Leroy T, Ribeyre F, Bertrand B, Charmetant P, Dufour M, Montagnon C, Marraccini P, Pot D (2006). Genetics of coffee quality. Brazilian Journal of Plant Physiology 18(1):229-242.
Crossref
|
|
|
|
|
Lingle TR (2001). The Cuppers Handbook. Systematic Guide to the Sensory Evaluation of Coffees flavor. Third edition, p. 71.
|
|
|
|
|
Liu C, Yang Q, Linforth R, Fisk ID, Yang N (2019). Modifying Robusta coffee aroma by green bean chemical pre-treatment. Food Chemistry 272:251-257.
Crossref
|
|
|
|
|
Marin K, Pozrl T, Zlatic E, Plestenjak A (2008). A new aroma index to determine the aroma quality of roasted and ground coffee during storage. Food Technology and Biotechnology 46 (4):442- 447.
|
|
|
|
|
Martin RP, Donald FB, Stanley W, Vincent AU (1978). A comparison of mean separation techniques. Journal of Statistical Computation and Simulation 7(1):33-54.
Crossref
|
|
|
|
|
Mburu JK. (2004). The current recommendations for the processing of high quality and safe coffee in Kenya. 20th International Conference on Coffee Science Bangalore, India.
|
|
|
|
|
Mendes LC, Menezes HZ, Silva MAAP (2001). Optimization of the roasting of Robusta coffee (C. canephora conillon) using acceptability tests and RSM. Food Quality and Preference 12:153-162.
Crossref
|
|
|
|
|
Michaela TL, Kreuml DM, Bettina P, Juergen K (2013). Changes in sensory quality characteristics of coffee during storage. Food Science and Nutrition 1(4):267- 272.
Crossref
|
|
|
|
|
Muschler RG (2001). Shade improves quality in suboptimal coffee zone of Costa Rica. Agroforestry Systems 51:131-139.
Crossref
|
|
|
|
|
Nebesny E, Budryn G (2006). Evaluation of sensory attributes of coffee brews from Robusta coffee roasted under different conditions. European Food Resource Technology 224:159-165.
Crossref
|
|
|
|
|
Noor-Aliah AM, Fareez-Edzuan AM, Noor-Diana AM (2015). A review of quality coffee roasting degree evaluation. Journal of Applied Science and Agriculture 10(7):18-23.
|
|
|
|
|
Rachilo JR, Michieka DO (1991). Reconnaissance soil survey of the Busia area. Reconnaissance Soil Survey Report. No. R8. KARI/NARL. Kenya Soil Survey. Nairobi. Kenya.
|
|
|
|
|
Reyes GF, Escamilla PE, Pérez PE, Almaguer VG, Curiel RA, Hernández GJA (2016). Evaluación de Productividad, Calidad Física y Sensorial Del Grano Del Café (Coffea arabica L.), En Cafetos Injertados En El CRUO, Huatusco, Veracruz. Revista Geographic Agrícola 56:45-53.
Crossref
|
|
|
|
|
Sanz C, Czerny M, Cid C, Schieberle P (2002). Comparison of potent odorants in a filtered coffee brew and in an instant coffee beverage by aroma dilution analysis (AEDA). European Food Research and Technology, Berlin 214:299-302.
Crossref
|
|
|
|
|
Sureshkumar VB, George D, Prakash NS, Prakasan CB, Mohanan KV (2013). Study on the pattern of fruit development in Robusta coffee (Coffea canephora var. Robusta). International Journal of Plant, Animal and Environmental Sciences 3(2):248-257.
Crossref
|
|
|
|
|
Sunarharum W, Williams JD, Smyth H (2014). Complexity of coffee flavor: A compositional and sensory perspective. Food Research International 62: 315-325.
Crossref
|
|
|
|
|
Tefera F (2018). Variability and genotype by environment interaction for quantitative and qualitative traits of coffee (Coffea arabica l.) hybrids in south western Ethiopia. PhD dissertation. Jimma University, Ethiopia.
|
|
|
|
|
Tessema A, Sentayehu A, Taye K, Weyessa G (2011). Variability and association of quality and biochemical attributes in some promising Coffea arabica germplasm collection in Southwestern Ethiopia. International Journal of Plant Breeding and Genetics 5(4):302-316.
Crossref
|
|
|
|
|
Yigzaw D (2005). Assessment of cup quality, morphological, biochemical and molecular diversity of C. arabica L. genotypes of Ethiopia. PhD. Thesis, University Free State, Ethiopia.
|
|
|
|
|
Yuwana Y, Silvia E, Sidebang B (2015). Engineering properties of coffee beans from various colors of coffee cherries. Agriculture and Agriculture Science Procedia 3:274-277.
Crossref
|
|