African Journal of
Food Science

  • Abbreviation: Afr. J. Food Sci.
  • Language: English
  • ISSN: 1996-0794
  • DOI: 10.5897/AJFS
  • Start Year: 2007
  • Published Articles: 979

Review

Acceptance and integration of biofortified vitamin A maize into common diets

Kelvin Mulungu
  • Kelvin Mulungu
  • The University of Zambia, Institute of Economic and Social Research (INESOR), Zambia.
  • Google Scholar


  •  Received: 25 April 2016
  •  Accepted: 03 August 2016
  •  Published: 30 November 2016

 ABSTRACT

Micronutrient deficiency ranks high as one of the public health challenges facing developing countries. Muti-faceted approaches have been put in place to reduce the impact of this problem, and among them is the promotion and dissemination of staple crops bred to deliberately have higher levels of selected micronutrients like vitamin A. In the Northen part of Zambia, HarvestPlus, working with other partners has been promoting orange maize rich in vitamin A among poor members of the community organized into Livelihoods Enhancement Groups (LEGs). A survey was conducted among households that belong to LEG sand took part in the cultivation of orange Vitamin A Maize (VAM). After the first year in which the community was introduced to biofortified VAM, LEGs grew it in group plots, shared the produce after the harvest and had their first home use. These households were followed up with a survey that asked a range of questions and interviews were conducted with a sample of 96 households which were randomly selected from the list of those that cultivated and shared the produce. The author descriptively assess how well VAM has been integrated into common diets. Findings show that almost all households like VAM as compared to both cassava and white maize meal, the two other staples in Northern Zambia. In all the forms in which it was cooked, households liked it. There are, however, fewer households who reported mixing VAM flour and cassava flour- something which is common with white maize flour. There are no differences in the likability of VAM across districts and gender. The reasons advanced for preference of VAM include; its nutritional content, its taste and the ability of households to prepare nshima (thick porridge) using less VAM flour as compared to cassava and white maize flour. Farmers also like VAM agronomically because it is an early maturing variety and for its double cobbing characteristic. These results provide a mix of agronomic and consumption attributes that can be used in the promotion of VAM and have implications for further research: need to scientifically test some of the perceived benefits households reported like using less VAM maize flour than white maize flour for cooking same amount of nshima and it being more filling. 
 
Key words: Biofortification, integration of food, common diets.


 INTRODUCTION

Biofortification is a promising strategy to reduce micronutrient malnutrition especially in rural areas. In most of these areas, the poor grow their own food. According to IAPRI (2016), the percentage of rural households who manage to feed themselves and actually sell some of the maize is at 61% with the remaining being able to feed from their produce for a less long period from their produce. In these settings, the strategy involves breeding staple food crops to be a rich source of one or  more  key micronutrients,  such  as  iron, zinc, vitamin  A, and iodine, and disseminating these crops in areas where the rate of micronutrient deficiency is high and where poor households consume a large share of calories from staple foods. On average, an adult Zambian consumes about 74 kg of maize per year and it remains the dietary mainstay in central, southern and eastern Zambia accounting for about 60% of the national calorie consumptions (Dorosh et al, 2009). Apart from maize, the other staple is cassava, accounting for roughly 15% of national calorie consumption. In the Northern and Western parts of Zambia, cassava takes a much more prominent role and usually this area is referred to as a dual staple zone (Dorosh et al., 2009; Haggblade et al., 2012).           
 
Poverty levels in rural areas have remained high (76%) as compared to urban areas (27%) even though they have been reducing at a lower rate. Malnutrition related problems have barely changed over the last decades. Stunting, for children below 5 years of age has increased to 48% from about 45% in 2010, according to the Living Conditions Monitoring Survey (LCMS) "Central Statistical Office, 2015".Vitamin A deficiency is equally high, at about 54% of the children below 5 years of age (WHO, 2009). Zambia, despite recording bumper harvests year after, has also been ranked poorly on the Global Hunger Index which measures nutritional outcomes. In the 2015 report, Zambia is among the 3 worst countries in Africa. All this underscores the need for newer approaches to responding to nutrition challenges the country is facing.HarvestPlus Zambia working with Self Help Africa in the Integrated Research in Development Programme with the financial help of Irish Aid has been promoting and researching on vitamin A maize (VAM) in the Northern parts of Zambia. Havert Plus is a global leader in fighting micronutrient deficiency (hidden hunger) working in Asia, Africa and South America. The programme is co-hosted by the International Food Policy Research Institute and the International Center for Tropical Agriculture. Self Help Africa is an international Non-Governmental Organisation that is working on sustainable agriculture and nutrition programmes. In this project, HarvetPlus partnered with World Fish Center and Center for International Forestry Research, also members of the Consultative Group on International Agricultural Research to manage the research in development programme while Self Help manages the development aspect of the programme. The research programme is a 3-pronged approach focusing on nutrition, fisheries and forestry with each component managed by Harvet Plus, World Fish and CIFOR, respectively. Harvest Plus concentrates its efforts on promoting biofortied crops and researching on adoption and utilization. The goal of the project is to reach some of the most poor in the communities and to do this, quite homogenous grouping of the poor had to be established.     
 
These were arranged at village level. Groups consisting of 45 members of the community who are chosen on a vulnerability (poverty) criterion were organized- these were named Livelihoods Enhancement Groups (LEGs) and numbered numerically. 
 
In the first season of promotion of VAM, seeds of about 60 g were distributed to members of the Livelihood Enhancement Groups (LEGs) to host demonstration plots for two varieties, GV 665 A and HP 1002. The demonstration plots were at zone level- usually comprising of about 4 LEGs. The demonstration plots were a point of learning for both the farmers and the researchers. For the farmers, they got first-hand experience on how to grow VAM after receiving trainings on the agronomic and nutritional value of VAM. After harvest, the groups shared the produce among themselves for household use, while others stored and used them at group (LEG) level. Depending on the number of members who were active and the production level, quantities shared differed but all those interviewed got at least 10 kg. Depending on the family size, frequency of preparation and quantity received, households were able to eat VAM for a period of between a month and 3 months. A follow-up utilization survey was then conducted to investigate farmers’ perceptions on the growing of VAM and how well it was being integrated into common diets. Results of the survey constitute this article.
 
Cropping patterns and nutrition
 
The economy of Northern Province is predominantly agricultural based. More than 80% of Northern Province’s population depends on agriculture and natural resources. Though there are variations across the districts in terms of the specific activity portfolios, the main activities include crop farming, fishing, livestock and forest extraction. The main crops grown in the province are cassava, maize, groundnuts, beans, millet and sweet potatoes. The two districts, Mbala and Luwingu have some differences also within them. According to Ngoleka (2013) who did some livelihoods zoning in the two districts, four zones were identified (3 in Luwingu, 1 in Mbala). According to the report, Mbala district comprises one livelihood zone: the ‘Maize, Cassava and Bean Zone’. The three zones in Luwingu are:


1. Fish pond fishing, cassava and agricultural trade zone, 
2. West and east cassava, groundnuts and rice zone, and
 
3. Lake fishing, cassava and irrigated vegetable zone.
 
While Mbala is a maize belt, Luwingu is a cassava belt and it is only recently that farmers have started growing maize mainly because of the inputs they receive through the Farmer Input Support Programme (FISP). By giving heavily subsidized inputs (fertilizer and maize seed) mostly meant for maize, even farmers who traditionally grew cassava are switching to maize so as to access these inputs and because of the certain market they are assured for maize through the government grain marketing board, the Food Reserve Agency. For promotion of VAM, this is a good opportunity because VAM will be part of ‘maize’ that is being adopted than bringing it later on after they have known other white maize varieties for years. Knowledge of growing maize is also noticeably different among farmers in these two districts. Cassava is grown in both districts, but more so in Luwingu. The province accounts for about 39% of the total cassava production (quantity); this is compared to just about 17% for maize nationally (CSO/MAL, 2014). The other main starch is millet, though it is mostly used for brewing of both alcoholic and non-alcoholic local beverages. In times of shortage of both maize and cassava, people resolve to cooking nshima from millet (finger) flour. The main legumes are bean and groundnuts. This is traditionally a bean producing region, with 71% of the national produce coming from the province. Most of the bean is traded and sees its way to major consumption hubs like Copperbelt and Lusaka and little is kept for home consumption. The major farming systems in the province include shifting cultivation [chitemene], semi-permanent hoe system, semi-permanent hoe system and ox plough system, semi-commercial cultivation, and commercial systems. The majority of the smallholder farmers in the districts of Mbala and Luwingu use simple technologies [hand hoe and oxen] and there is minimal purchases of inputs such as fertilizers.
 
However, crop diversification is still limited and it has been further hampered by FISP which has continued to promote maize at the expense of other crops. The province has continued to experience chronic food and nutrition security problems, with stunting as the most common nutritional disorder affecting children under five years. Nationally, vitamin A deficiency and lack of iron are some of the serious micro-nutrient deficiencies affecting children and women. In Mbala, Vitamin A Deficiency (VAD) is above the national levels with about half of the children estimated to be affected. Halimatou et al. (2014) estimates that about 90% of the women in Luapula and Northern provinces of Zambia do not get 
enough vitamin A from the commonly consumed foods. Though, there are other efforts to reduce VAD, such as the national vitamin A supplementation program which distributes high dose vitamin A capsules twice annually to children 6 to 59 months of age, and vitamin A fortification of   sugar   (WHO,   2009),   they   face   challenges    like sustainability, coverage and efficiency. Supplementation is targeted at young children despite having a good coverage of 89% of the country geographically between 2007 and 2011 (Kafwembe, 2009; Fiedler et al., 2013) while sugar fortification is reaching mainly the wealthy part of the population who afford other foods that provide vitamin A and has potential for hypervitaminosis (Clewes and Kankasa, 2003; Gannon et al., 2014). Biofortification aims to complement the government efforts like supplementation and commercial fortification by allowing farmers to grow micro-nutrient rich crops and access the nutrients when consumed. 
 
To be a member of the LEG, there is a vulnerability criterion which must be passed. The criteria includes; a) female headed households and/or b) elderly headed households and/or c) households with orphans and vulnerable children and/or d) people with health conditions and impairments. 
 
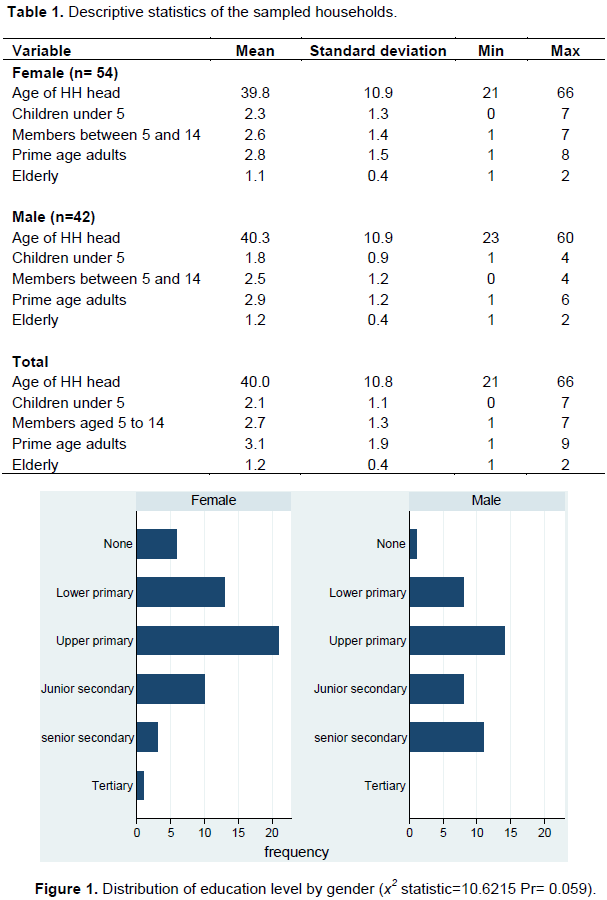
Given these criteria, members of the LEGs are expected to have below average levels of micronutrient deficiencies. Around 26% of the rural households are female headed while those headed by the elderly (60 years and older) make up 5.5% of the total rural population (IAPRI, 2016). Within households, males tend to have significantly more education than females. Women play multiple roles in both agricultural production and nutrition, and interventions that consider trade-offs between their respective roles and their time and labor constraints are more likely to lead to positive outcomes (Sitko et al., 2011). Gender is very important in nutrition related programs because women’s status and decision-making power directly affects the nutritional status of their children. Women are also the most nutritionally vulnerable when pregnant and lactating, as their bodies must cope with the additional nutritional stresses and demands of pregnancy and lactation (Sitko et al., 2011). A correlation is also present between years of schooling and income (Kuteya et al., 2011). In most studies determining causes of child malnutrition, literacy level of the mother/guardian to the child has been found to be one of the major factors (Maleta et al., 2003; Bantamen et al., 2014; Boulos et al., 2016). This means that apart from being poor, these groups’ nutritional status is exacerbated by low literacy levels. Therefore, some of the factors that are related to the acceptance of VAM among members of the LEGs given the likely nutritional status were investigated. 
 
Because consumers are followed after they have prepared different foods at home, this approach uses a kind of home-use testing instead of the central location testing where consumers are in a central place to taste the VAM and be asked questions about it. This allows the consumers to cook the product in various ways they want for a longer period of time and give their sensory scores, perceptions, observations and any problems they encounter and in this case compare it with other products that they usually eat at home. One drawback, however, is that the researcher has no control over how the product is prepared, and any answers about taste, aroma and appearance could not dully depend on the intrinsic value of the product but maybe also on the way each household prepared it. 
 
Data source
 
The data was collected from LEGs in Mbala and Luwingu. A structured questionnaire was administered to 96 farmers who are members of the LEGs and mostly took part in the growing of VAM the previous season. Fifty Two from Mbala, while 44 were drawn from Luwingu. At the time of the study, the number of LEGs in Mbala was about 102 with each LEG having 45 members selected using the above stated criteria while Luwingu had about 99 LEGs. However, the number of LEGs that took part in the VAM demonstration plots in the previous season is less as some zones did not have demonstration plots. In both Luwingu and Mbala, there were 4 zones with demonstration plots. No VAM seed was commercially available and farmers could not grow it at home but only through the HarvestPlus managed demonstration plots. VAM seed only became commercially available in the 2014/2015 agricultural season as ZAMSEED seed company marketed the first variety while in the 2015/2016 agricultural season, two more seed companies started marketing their varieties commercially as well. The sample is drawn from members of the LEGs and among members that took part in the growing of VAM because the study was also interested in the farmers experience with the crop agronomically. Because of resources, only about 30% of the number of farmers that took part was sampled. The sampling was done randomly from the participation lists during field activities at the plots. The questionnaire included questions on demographics. Focus group discussions were held with selected members of different LEGs; one in each district. This was a means of triangulating the data as well as getting some detailed information on the why and how questions that could not easily be solicited by the questionnaire. The FGD guide followed mainly in the same line as the questionnaire but with more focus on understanding the basic framework within which the decisions are made and the reasons for some perceptions that were advanced. 


 RESULTS

In this section, results are presented mostly in the descriptive sense. Though inferential and descriptive in nature, the results offer helpful insights into the household level utilization dynamics and acceptability of   entered in SPSS and exported to Stata for analysis.
 
Descriptive statistics
 
In Table 1, the sampled households are described. The description is gendered to capture any differences between the two sexes. About 56% of the sampled households were female. This above-average percentage for women reflects the membership of the LEGs where about 60% of the members per LEG are female. This is a direct endeavor by the program to empower female headed households. The average age of the female heads of households was 40 years, like that of males. Both female and male headed households have almost the same number of children under five at about 2 children per household. There is equally the same number of members between 5 and 14 and prime age adults which are about 3 on average.
 
Figure 1 shows the association between gender and education level. Majority of both male and female heads of households have only reached up to upper primary. Lower primary for females is the second most achieved level of education at about 12%, while for males, senior secondary school comes in second at about 11%. The Chi-square statistic, testing the hypothesis, that is, an association between gender and level of education attained, indicates that there is a relationship between gender and level of education at 90% confidence level. A good proportion of males have achieved higher level of education as compared to females. The females’ level of education seems to be heavy at the tail, majority have attained lower levels of education.
 
Agronomic attributes
 
After participating in the growing of VAM for one season, the farmers were able to give the characteristics of VAM that they like from observation and information they received during the training. Table 3 shows that the most important VAM attribute among farmers in northern region is the early to medium maturity attribute. Traditionally, late maturing varieties have been promoted in this region and have been adopted by farmers. This is based on the classification of the region as a high rainfall region with over 1,200 mm of rainfall per annum. However, with a changing climate, less and less rainfall is being received in the region (Thurlow et al., 2012) and the late maturing varieties which include the local open pollinated varieties (OPVs) are being impacted negatively. It is therefore, not surprising to find that the early maturing attribute is mentioned by 47% of the farmers as the reason they like VAM. The VAM varieties that were planted in the demonstration plots require between 100 and 125 days maturing with very good drought resistance.
 
 
Farmers also prefer the double-cobbing attribute of VAM.This is an attribute that is currently present in all the three released varieties. However, among the attributes, there are also farmers’ misconceptions  about  VAM.
 
 
For example, the fact that a good proportion of them ‘think’ VAM does not require fertilizer is indication of both better yields that farmers experienced with VAM even without applying fertilizer and the misconception that could have been generated by the conservation agriculture training they received in the same year from Self Help Africa. Only 6% liked VAM because of better yield. This is not surprising as the demonstration plots were hosted at zone level - which involves multiple LEGs- and group dynamics affected the management negatively


For instance, in  some cases, planting was done late as the different LEGs kept debating on site selection and in some cases, the administering of cultural practices  like planting, weeding, fertilizer application e.t.c. was done later than should be. For example one zonal demonstration plot in Luwingu was only planted in January when it should have been planted by November the previous calendar year.
 
Utilization of VAM
 
The reception for VAM has been good. Farmers who had shared the maize, prepared at home and ate them were asked to compare VAM nshima (a thick porridge made from maize flour) to white maize nshima and cassava meal nshima. Unlike sensory tasting (for example as used by Meenakshi et al., 2011), consumer testing which was used in this study seeks to measure the personal response (liking, preference or acceptance) of consumers (current or potential) of a product, a product idea or specific product characteristics (Meilgaard et al., 2006; Tomlins et al., 2007). Also, different from most studies (Meenakashi et al., 2011; Laurie and Heerden, 2014; Oparinde et al., 2015), this study, firstly combines agronomic and consumption attributes of VAM, secondly by allowing the households to prepare and consume the product in the home under normal conditions, using household-recipes and without the presence of the researcher, it offers an opportunity to assess if preferences remain stable over time, once the novelty value of the product has worn off. The author did not concentrate on asking about the attributes as these may differ and vary across these three sources of starch and hence make it difficult to compare. Also, the sum of the attributes may not be equal to the whole (Hanley et al., 1998). Generally, VAM nshima is preferred to both cassava and white maize nshima. There are more people (97%) who prefer it over cassava meal nshima. Compared with white maize nshima, 84% say VAM is better and about 16% say it is just the same. White maize nshima, based on the ratings in Table 2, is therefore  the closest substitute for VAM nshima. This presents an opportunity to have many households that are currently consuming cassava turn to VAM as it is much more preferred.
 
 
Reasons for preference of VAM over white maize and cassava nshima differ. According to table 4 having a good taste coupled with being nutritious by way of Vitamin A rank as the most popular reasons why VAM is preferred as compared to white maize nshima while having vitamin A is the most popular reason why VAM is preferred as compared to cassava nshima. After an experience with VAM, studies like Steven and Winter-Nelson (2008) have also shown that there is a preference for VAM as compared to white even without a price discount especially among families with younger children and those without significant access to meat products. In Zambia, the general population has a high level of knowledge about vitamin A deficiency, but mostly in urban areas. This preference for VAM could be based on the newly received information about the importance of vitamin A in helping to fight VAD for these rural households.
 
As Meenakshi et al. (2011) found, providing nutritional information to the consumers increases their acceptability of VAM. In this study, most households who have had an experience in the home setting mention the presence of vitamin A as the reason for the preference of VAM over both white and cassava. Other reasons that people advanced include the softer texture of VAM and that they were able to use less flour as compared to white and cassava. The smell of VAM also came out as a reason, though few thought this is what made it better than cassava. The characteristic smell of β-carotene is in some cases what makes people associate VAM with the yellow maize that was distributed in late 90s as relief food and hence became associated with famine and low social-economic status (Meenakshi et al., 2011). For those who perceive VAM to be just the same as white and cassava, they concentrated more on the energy it gives and because both give strength (VAM and white and VAM and cassava), they found no reason to rate one better than the other.
 
 
The Chi-square statistic indicates that the ratings do not differ significantly across gender. There is no association between the preference of VAM as compared to white or preference of VAM to cassava and gender of the respondent.
 
In Table 5, the forms in which VAM was prepared are presented. At a trial stage, and given that this is the first home use these households had with a limited quantity (because it could not last all year round), these forms in which it was eaten can be taken as the priority or main forms. Households in some cases got too little a quantity to have the luxury of cooking it in a variety of ways repeatedly for a long period of time. Close to 87% of the households mentioned nshima as one of the ways they prepared VAM, followed by plain VAM porridge. Fresh maize and munkoyo (a local non-alcoholic brew made from any maize flour) came in as the third and fourth most common ways in which the households used VAM.
 
 
There were few farmers who mixed VAM with cassava meal, though this is very common with white maize flour. However, the two who mixed it with cassava, both female headed households in Mbala, mentioned that they enjoyed it and it was nice. In the focus group discussion, some members expressed skepticism about mixing as they thought the colour of the mixture would not look good. But after the ones who had tried shared the experience, other members were more willing to try it as well. If a lot of people do not  mix  with  cassava,  it  could have implications on the continued consumption of VAM as most households mix cassava and white maize (both for palatability and also for taste), as they approach the lean season, when maize stocks decline and the remaining quantities are used with cassava.


 CONCLUSION

Orange maize presents itself with a dual message for promoting it: the agronomic characteristics and the nutrition qualities. However, to the rural consuming farmers, the VAD problem is not a felt one, but rather an expressed one and the invisible nature of the nutrition traits presents a challenge communicating it to the community. However, making the community first understand and appreciate the problem creates a need in them and VAM comes in as a means to the end. As VAM does not require a change in habits, it is easy for people to fit it into their lives (van den Kommer, 2010). But they also trust the promise, even when traits are invisible and nutritional impact may not be noticeable directly. This is the reason why people mention the presence of vitamin A and why they prefer VAM to other sources of starch even though it is invisible and the impact not directly felt. Among mothers especially, there is also a good deal of information being received about the importance of vitamin A through various government initiatives like the child health week (Fiedler and Lividini, 2014).
 
The acceptance and easy integration as shown by various ways households have prepared VAM can also be explained by the provision of nutrition information by HarvestPlus. There is no reason to suspect that these households are avoiding to ‘look at a gift horse in the mouth’ as the only gift they got was seed and they had to do their own cultivation. Secondly, having been prepared and eaten at home and not in a central location under the observation of the researcher, they are less likely to associate the home experience with the initial gift.  Muzhingi et al. (2008) have shown that nutrition information plays a major role in influencing consumer acceptance of a product and is the single most  important factor in determining a household’s decision to consume maize that otherwise is non-white. This coupled with the agronomic likability of VAM, makes it easy for farmers to adopt it. The fact that this maize can also be marketed on agronomic attributes alone entreats the question as to what to weigh more in the promotion, especially that marketing it on agronomic attributes would still deliver the health benefits. However, in the spirit of disclosing to the consumers the full product, akin to “product labeling”, both agronomic and nutritional information needs to be given out there.
 
This study was limited in that the likability measured here is stated rather than revealed as no actual market data was collected on quantities produced as replacement for white maize or purchased from the market. Farmers at this point have not actually adopted VAM, suffice to mention that a good number of them had kept even a handful for planting the following season. Longer home use is likely to result in even better ratings for VAM (Meenakshi et al., 2012). If this likability and easy integration into common diets is stable overtime and translates into adoption, government has an opportunity to sustainably promote VAM as another viable option to reducing the vitamin A deficiency in rural areas. These promotions, in the traditional government extension system can still be based on the agronomic attributes with some nutritional information.


 CONFLICT OF INTERESTS

The authors have not declared any conflict of interests.


 REFERENCES

Bantamen G, Belaynew W, Dube J (2014). Assessment of factors associated with malnutrition among under five years age children at Machakel Woreda, Northwest Ethiopia: a case control study. J. Nutr. Food Sci. 2014.


Boulos C, Salameh P, Barberger-Gateau P (2016). Malnutrition and frailty in community dwelling older adults living in a rural setting. Clin. Nutr. 35(1):138-143.
Crossref


Clewes C, Kankasa C, Welsh J, Campbell J (2003). Report of the national survey to evaluate the impact of vitamin A interventions in Zambia in July and November 2003. Atlanta: United States Agency for International Development and CDC.


Dorosh PA, Dradri S, Haggblade S (2009). Regional trade, government policy and food security: Recent evidence from Zambia. Food Policy 34(4):350-366.
Crossref


Fiedler JL, Lividini K (2014). Managing the vitamin A program portfolio: A case study of Zambia, 2013–2042. Food Nutr. Bull. 35(1):105-125.
Crossref


Fiedler JL, Lividini K, Zulu R, Kabaghe G, Tehinse J, Bermudez OI (2013). Identifying Zambia's Industrial Fortification Options: Toward Overcoming the Food and Nutrition Information Gap-Induced Impasse. Food Nutr. Bull. 34(4):480-500.
Crossref


Gannon B, Kaliwile C, Arscott SA, Schmaelzle S, Chileshe J, Kalungwana N, Mosonda M, Pixley K, Masi C, Tanumihardjo SA (2014). Biofortified orange maize is as efficacious as a vitamin A supplement in Zambian children even in the presence of high liver reserves of vitamin A: a community-based, randomized placebo-controlled trial. Am. J. Clin. Nutr. 100(6):1541-1550.
Crossref


Haggblade S, Andersson Djurfeldt A, Banda Nyirenda, D., Bergman


Lodin, J., Brimer L, Chiona M, Chitundu M, Chiwona-Karltun L, Cuambe C, Dolislager M, Donovan C (2012). Cassava commercialization in Southeastern Africa. J. Agribusiness Dev. Emerg. Econ. 2(1):4-40.
Crossref


Halimatou A, Kohler L, Taren D, Mofu M, Chileshe J, Kalungwana N (2014). Zambia food consumption and micronutrient status survey report. Lusaka: National Food and Nutrition Commission. DRAFT


Hanley, N., Wright, R. E., & Adamowicz, V. (1998). Using choice experiments to value the environment. Environ. Res. Econ. 11(3-4):413-428.
Crossref


Indaba Agricultural Policy Research Institute. (2016). Rural Agricultural Livelihoods Report. Lusaka, Zambia.


Kafwembe EM, Chipipa J, Njunju E, Chilengi R (2009). The vitamin A status of Zambian children in a community of vitamin A supplementation and sugar fortification strategies as measured by the modified relative dose response (MRDR) test. Int. J. Vitam. Nutr. Res. 79(1):40-47.
Crossref


Kuteya A, Kabwe S, Beaver M, Chapoto A, Burke WJ, Mason NM, Weber MT (2011). Statistical report on categorization of rural cropping households in Zambia. Food Security Research Project Working Paper (51).


Laurie SM, Van Heerden SM (2012). Consumer acceptability of four products made from beta-carotene-rich sweet potato. Afr. J. Food Sci. 6(4):96-103.
Crossref


Maleta K, Virtanen SM, Espo M, Kulmala T, Ashorn P (2003). Childhood malnutrition and its predictors in rural Malawi. Paediatr. Perinatal Epidemiol. 17(4):384-390.
Crossref


Meenakshi JV, Banerji A, Manyong V, Tomlins K, Mittal N, Hamukwala, P. (2012). Using a discrete choice experiment to elicit the demand for a nutritious food: Willingness-to-pay for orange maize in rural Zambia. J. Health Econ. 31(1):62-71.
Crossref


Meilgaard MC, Civile GV, Carr BT (2006). Sensory evaluation techniques (4th ed.). Florida: CRC Press.
Crossref


Muzhingi T, Langyintuo A, Malaba L, Banzinger M. 2008. Consumer acceptability of yellow maize products in Zimbabwe. Food Policy 33:352-361.
Crossref


Ngoleka S (2013). Livelihoods and Rural Wealth Ranking among Farm Household in Mbala and Luwimgu districts, Northern Province, Zambia, Irish Aid Local Development Programme (IALDP) Baseline Report to Self Help Africa, Produced by Evidence for Development


Oparinde A, Birol E, Murekezi A, Katsvairo L, Tedla Diressie M, Nkundimana JD, Butare L (2015). Consumer Acceptance of Biofortified Iron Beans in Rural Rwanda: Experimental Evidence. HarvestPlus Working Paper 18.


Sitko NJ, Chapoto A, Kabwe S, Tembo S, Hichaambwa M, Lubinda R,


Thurlow J, Zhu T, Diao X (2012). Current climate variability and future climate change: estimated growth and poverty impacts for Zambia. Rev. Dev. Econ. 16(3):394-411.
Crossref


Tomlins K, Ndunguru G, Stambul K, Joshua N, Ngendello T, Rwiza E, Amour R, Ramadhani B, Kapande A, Westby A (2007). Sensory evaluation and consumer acceptability of palefleshed and orange-fleshed sweetpotato by school children and mothers with preschool children. J. Sci. Food Agriculture 87:2436-2446.
Crossref


Von Grebmer K, Bernstein J, de Waal A, Prasai N, Yin S, Yohannes Y. (2015). 2015 Global hunger index: Armed conflict and the challenge of hunger. Intl. Food Policy Res Inst. P 46.


World Health Organization (2009). Global prevalence of vitamin A deficiency in populations at risk 1995–2005. Available at: View


          */?>