ABSTRACT
If different breeds or muscles of animal have same composition is a food for thought. Do muscles from animals eaten as food, have different chemical composition? This study evaluates composition of thigh muscles from three breeds of cattle and the different muscles in the thigh. Nine 1-year male cattle, comprising of 3 Sokoto Gudali (SG), 3 White Fulani (WF) and 3 Red Bororo (RB) breeds were reared semi-intensively, fed with concentrate and allowed to grazed for 10 weeks. Each breed thigh and their muscles {semi-membranous (SM), semi-tendinosis (ST), Gracilis (GR), Sartorius (S), Vastus Lateralis (VL), Tensor Fascia tatae (TL) and Biceps Femoris (BF)} were evaluated for proximate, minerals and palatability status, in a completely randomized design. Results of breeds, show that SG had highest significant (P<0.05) protein, magnesium, iron and phosphorus contents and lowest ether extract content. Out of all the muscles, SM had best proximate composition while VL had best mineral composition than other muscles significantly evaluated. Physico-chemical analysis showed that cooking loss was lowest (P<0.05) for SG (32.68%) than WF (39.61%) and RB (35.15%). For muscles, ST, BF, SM and GR had highest significant (P<0.05) water holding capacity values of 62.72, 55.46, 57.65 and 52.34%, respectively than 39.76 (VL), 42.19 (S) and 42.90% (TL). With regards to palatability scores for breeds, panelists scored SG highest (P<0.05) than WF and RB. For muscle, SM was scored best (P<0.05) with highest significant values for flavor, tenderness, texture and overall acceptability. SG appeared best in all the breeds evaluated, while SM did well in proximate, VL and ST in minerals, SM in physico-chemical and palatability status.
Key words: Breeds of cattle, Red Bororo, Sokoto Gudali, thigh muscles, White Fulani.
Consumers purchase beef or meat and produce them into desirable products or are cooked into recipes or soup without having full knowledge on the breeds, type of muscles or nutritional value they might get from the product bought. Recent findings have shown that muscles from same cattle have different nutritive values and organoleptic qualities. Sanuelo et al. (2004) noted that animal breeds can influence the nutritive qualities of meat in some ways, which could affect the muscles structure and meat physiology.
Researchers have shown that some important aspect vary significantly between muscles and within the same muscle from animal irrespective of their diets (Biesalski, 2005). Muscles in animal body consist of 3 types, skeletal, smooth and cardiac muscles tissues which vary with function and location in the body. Skeletal muscles are muscles of the muscular system, having over 600 in an animal body, the amount used to produce human food represents 35 - 60% of their body weight and vary widely in shape, size, anatomical locations, physiological functions, action and nutritional composition. Listrat et al. (2016) reported that muscle mass of livestock used to produce human food represents 35 – 60% of their body weight. The Meat We Eat.Com (2017) observed that the most abundant chemical in meat is water, followed by protein then fat. Carbohydrates, minerals and vitamins occur in much smaller amounts but nevertheless are very important metabolically and nutritionally.
There are different muscles in skeletal system like the thigh, the shoulder, the loins, etc. Major muscles found in animal thigh include semi–membranous, semi–tendinosis, Gracilis, Sartorius, Vastus Lateralis, tensor fascia latae, and biceps femoris muscles according to Tomaszewska-Gras and Piotr (2012). The differences in this thigh muscles will dictate differences in sensory and nutritive value of the meat produced and one thigh muscle may be different from another thigh muscle of the same animal type. Therefore, the aim of this study is to assess the thigh muscles from three breeds of cattle and the differences in the muscles of thigh of an animal.
Experimental animals
Nine male live animals of a year old, comprising of 3 White Fulani, 3 Sokoto Gudali and 3 Red Bororo were purchased from Osun State University Teaching and Research Farm. Thereafter, the cattle were quarantined, dewormed, given anti-stress and antibiotics. The animals were raised under a semi-intensive housing system for ten weeks and tagged for easy identification (White Fulani– WF, Sokoto Gudali– SG, Red Bororo– RB). Immediately after exsanguination, skinning methods were applied (removal of the skin) in order to identify the thigh muscles for the experiment.
Identification of muscles in the thigh
Each muscle obtained was identified in the meat laboratory as semi–membranous (SM), semi–tendinosis (ST), Gracilis (Gr), Sartorius (S), Vastus lateralis (VL), tensor fascia latae (TL) and biceps femoris (BF).
Proximate and mineral composition
Proximate composition
Proximate (protein, ether extract, ash and moisture contents) samples and minerals (magnesium, calcium and phosphorus) samples were analyzed chemically according to the Official Analytical Chemist (AOAC, 18TH EDITION, 2005).
Physico-chemical evaluations
Water holding capacity
The WHC of meat samples was determined by the press method as slightly modified by Suzuki et al. (1991). Approximately 1 g of meat sample was placed between two (9 cm Whatman No1) filter papers (Model C, Caver Inc, Wabash, USA). The meat sample was then pressed between two 10.2 x 10.2 cm2 Plexi glasses at about 35.2 kg/cm3 absolute pressure for 1 min using a vice. The meat samples were removed and oven dried at 80°C for 24 h to determine the moisture content. The amount of water released from the meat samples was measured indirectly by measuring the area of filter paper wetted relative to the area of pressed meat samples. This procedure was repeated for all the seven muscles in each cattle. Therefore, the WHC was calculated thus:
Where, Aw = Area of water released from meat samples (cm2); Am = area of meat samples (cm2); Wm = weight of meat samples (g); Mo = moisture content of meat samples (%); 9.47 = a constant factor.
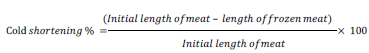
Cold shortening
Meat samples of known weight and length were stored in refrigerator for 24 h at 4°C (Fakolade et al., 2016). After refrigeration, the final length were taken and calculated thus:
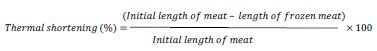
Thermal shortening
Meat samples of known length and known weight were taken and broiled in an oven at 175°C for 20 min (Fakolade et al., 2016). Afterwards, the final length was taken and calculated thus:
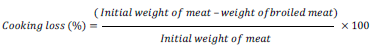
Cooking Loss
Meat samples of known length and weight were taken and broiled at 175°C for 20 min (Fakolade et al., 2016). Afterwards, the final weight was taken and calculated thus:
Thaw rigor
Meat samples of known weight and length were stored in refrigerator for 24 h at 4°C. After refrigeration, the final weight were taken and calculated thus:
Palatability status
A total number of forty trained panelists aged 27 to 45 years were selected based on their past performance in consuming meat, and were randomly allocated to the samples. Each panelist was presented the blind coded samples and asked to score each sample for flavour, tenderness, juiciness, colour and overall acceptability (Fakolade et al., 2016).
Statistical analysis
The experimental design adopted was complete randomized design (CRD). All data were subjected to analysis of variance (ANOVA) and means were separated with Tukey HSD using the same analytical software.
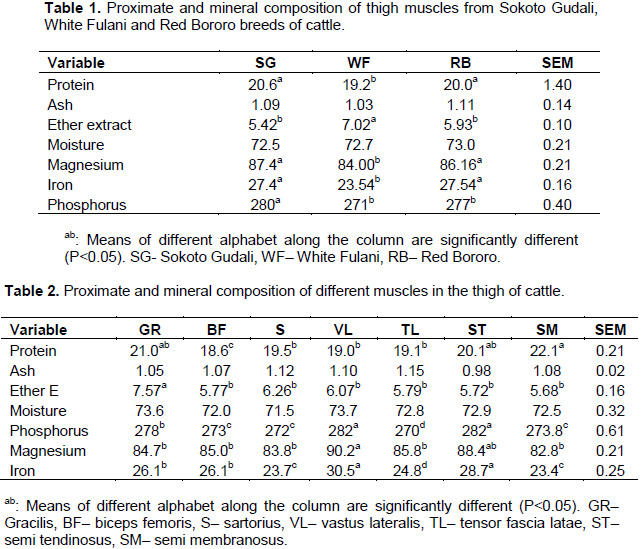
SG had the highest significant protein value of 20.6% than RB (20.0%) and WF (19.2%). It also had the highest mineral composition value (P<0.05) than the others for magnesium, iron and phosphorus. The values obtained for proximate composition agrees with the report of Adeniyi et al. (2011) that beef protein ranges from 18 to 22%, moisture 68 to 75% and fat 2 to 15%. The values obtained for ash in this study were below 1.19% as observed by Dixon et al. (2015) for beef. SG had the highest mineral composition measured followed by RB and then WF. SG had been observed by most consumers to have better quality value for processing into products, which could be well explained by Table 1.
SM appeared best significantly in values for proximate analysis, while VL and ST took the lead in mineral composition (P<0.05) values. The values obtained were in the ranges of 21.17 to 23.21%, as reported by USDA (2012) for SM muscle of beef. SM and ST are chucks of muscle that have laboratory values, easy to manage and process (Table 2).
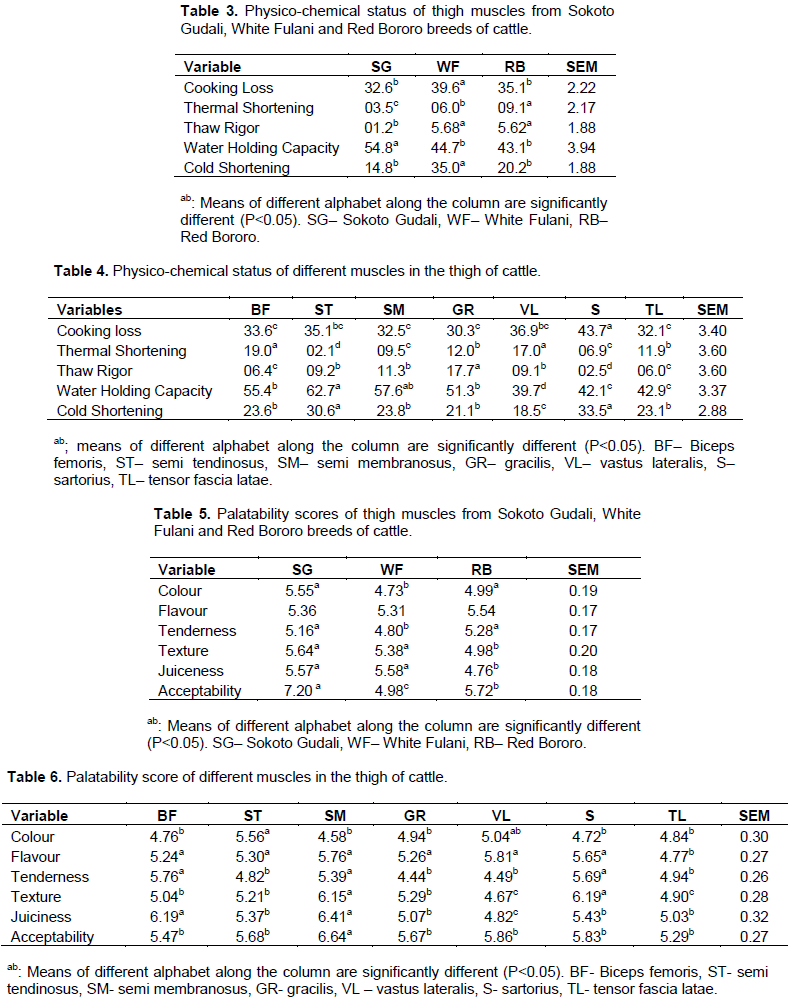
SG had the highest WHC but lowest values for other parameters measured. This indicates that SG meat is of good quality, having retained more of it nutritional quality. Drummond et al. (2005) observed that higher cold shortening value in meat could make the meat tougher and Kauffman (1992) reported that higher thaw rigor reduces the juiciness, texture and nutrient in meat (Tables 3 to 6).
SM was proven to be the best muscle evaluated from the seven muscles. It had the highest WHC, and the lowest values for other parameter measured. This shows how quality such muscles could be. Hoffman et al. (2012) reported that cooking loss of meat cold reduce the quality of meat, and obtained 34.22 to 45.64% of cooking loss for beef animal. Other parameters like thermal, cold shortening and thaw rigor do reduce the quality of any meat if it is of higher value.
The panelists scored SG better than WF and RB (P<0.05). This may be due to the fact that SG had the highest significant value in proximate and minerals composition, with lower physico-chemical parameters with good WHC which could influence other organoleptic characteristics like texture, juiciness and tenderness of the meat.
SM had the best taste organoleptically, as scored by the panelists. This could also be due to the fact that, it appeared best for proximate analysis done, having good physico-chemical qualities. Fakolade et al. (2011) indicated that meat with higher flavor, texture and juiciness will motivate the panelists to score higher overall acceptability.
SG proved to be the best quality breed of cattle from those evaluated, while SM muscle gave the best nutritional qualities than the other muscles analyzed.
The authors have not declared any conflict of interests.
REFERENCES
|
Adeniyi OR, Ademosun AA, Alabi OM (2011). Proximate composition and economic values of four common sources of animal protein in South-western Nigeria. Zootecnia Tropical 29(2):231-234.
|
|
|
|
Association of Analyst chemist (AOAC) (2005). Official Methods of Analysis 2005 Association of Analyst chemist, 19th Edition, AOAC International, Inc. Washington, DC. 2005;1219. Available at:
View
|
|
|
|
|
Biesalski HK (2005). Meat as a component of a healthy diet–are there any risks or benefits if meat is avoided in the diet?. Meat Science 70(3):509-524.
Crossref
|
|
|
|
|
Dixon CL, Woerner DR, Tokach RJ, Chapman PL, Engle TE, Tatum JD, Belk KE (2015). Quantifying the aging response and nutrient composition for muscles of the beef round. Journal of Animal Science 90(3):996-1007.
Crossref
|
|
|
|
|
Drummond LS, Sun DW (2005). Feasibility of water immersion cooking of beef joints: Effects on product quality and yield. Journal of Food Engineering 77(2):289-294.
Crossref
|
|
|
|
|
Fakolade PO (2011). Physical and sensory characteristics of organic traditional smoked meat for beef and camel meat. Published by Faculty of Agricultural Science, Department of Crop and Environmental Protection Ladoke Akintola University of Technology. Ogbomoso, Nigeria. Unpublished. pp. 40-49.
|
|
|
|
|
Fakolade PO, Akinduro VO, Ogungbade KO (2016). Physico-Chemical and Palatability analysis of grilled and boiled meat from broilers fed varying levels of honey in their diet during dry season. Journal of Biology, Agriculture and Healthcare 6(9):88-93.
|
|
|
|
|
Hoffman LC, Vermade A, Melleir N (2012). Physical and chemical properties of selected beef muscle infused with a phosphate and lactate blend. South African. Journal of Animal Science 42(2):1-24.
Crossref
|
|
|
|
|
Listrat A, Lebret B, Louveau I, Astruc T, Bonnet M, Lefaucheur L, Picard B, Bugeon J (2016). How structure and composition Muscle influences meat and flesh quantity. The Scientific World Journal 2016:1-14.
Crossref
|
|
|
|
|
Sanuelo C, Panea B, Oleta Monson JL, Sinerra I, Aberti P, Erbjerg P, Chistiansen M, Gigh S, Falia S, Gaddin A, Hocquette JF, Jailer NR, Nute GR, Williams JL (2004). Carcass quality of several European cattle breeds: preliminary results. In 50. international congress of Meat Science and Technology.
|
|
|
|
|
Suzuki A, Kaima N, Ikeuchi Y (1991). Carcass composition and meat quality of Chinese purebred and European X Chinese crossbred pigs. Meat Science 29:31-41.
Crossref
|
|
|
|
|
The Meat We Eat.com (2017). Composition of meat; water, carbohydrate, minerals and vitamins; A project of the American Meat Science Association, June 08, 2017. Available at:
View
|
|
|
|
|
Tomaszewska-Gras J, Piotr K (2012). Effect of Marination on the Thermodynamic Properties of Chicken Muscle Proteins Studied by DSC. Czech Journal of Food Science 30(4):302-308.
Crossref
|
|
|
|
|
United States Department of Agriculture (USDA) (2002). USDA Nutrient Database for Standard Reference, Release 15. •3 oz. beef, composite of trimmed retail cuts, separable lean only, trimmed to 1/4" fat, all grades, cooked. (NDB No: 13012). Available at:
View
|
|