ABSTRACT
Soy flour from soybean was processed to produce fresh tofu using three coagulants namely lime, Epson salt and tamarind. The results obtained showed that the pH of the samples were 7.20 for Epson salt, 5.00 for lime and 5.50 for tamarind. There were significant differences (p< 0.05) in the weight increase of all the samples with Epson salt (46.62 kg) as the highest. Epson salt had the least coagulation time of 6 min. The result of the proximate analysis shows that there were significant differences (p< 0.05) in protein, carbohydrate and moisture content in the three samples with the value of protein in Epson salt (12.40) as the highest. Further analysis revealed that there were significant differences (p<0.05) in emulsifying capacity, oil absorption capacity and swelling index in all the samples. The value of the water absorption capacity of Epson salt (4.70 g/ml) was significantly different (p< 0.05) from lime (3.80 g/ml) and tamarind (3.70 g/ml). In the mineral composition there were significant differences (p< 0.05) in Ca, Mg, K, P, Na and Fe in all the samples though K had the lowest value. There were significant differences (p<0.05) in the total fungal and viable counts. The total fungal count was least in Epson salt (2.00 x 10³ CFU/g) while the total viable count was also least in Epson salt (2.6 x 10³ CFU/g) after 6 days of ambient storage; however, it was highest in tamarind coagulated tofu. Epson salt coagulated fresh tofu was highly appreciated for ranking highest in protein, Ca, Mg and lowest in total fungal and viable count.
Key words: Tofu, coagulants, physical characteristics, functional properties, proximate and mineral composition, microbial.
Tofu is a meat analogue derived from soybean. The term meat analogue means substitute for animal proteins. Soybean (Glycine max) is an important oil seed belonging to the family of leguminosae .It is usually grown as a food crop in Nigeria. There are three species of soybean. They include G ussuriensis, G max and G gracilis. G max is commonly grown throughout the world (Salunkhe et al., 1992). Soybean protein molecule possesses a three dimensional structure which makes it possible to be used as a textured protein product. One of those textured protein product is “Tofu”, a meat analogue. Tofu is a fermented product which serves several functions such as enrichment of food substrate with proteins, essential amino acids, essential fatty acids and vitamins; this improves the digestibility and acceptability of foods, detoxification of toxic substances in foods, preservation of food through production of anti-bacterial compounds such as lactic and acetic acid, and enrichment of the diet through the development of flavours aroma, taste, palatability and texture of the foods (Steinkraus,1995).
Other benefits include decrease in risk of cancer, used as antioxidant, and increase in availability of nutrients such as folate, vitamin K, calcium, magnesium, iron and fibre. A lot of phytonutrients such as flavonoids and isoflavonoids, phenolic acids, protein and peptides are also obtained from Tofu. Tofu is also used in the prevention and treatment of obesity, type 2 diabetes, and other chronic obstructive pulmonary diseases. Therefore, tofu as a meat analogue possesses all the essential characteristics of a complete protein which contains all the indispensible amino acids in the approximate amount needed by humans (Iwe, 2003).
A report comparing the cost of soybean with other protein sources shows that 1.25 kg of soybean and 0.25 kg of beef could be purchased at the same price (Dashiell, 1993). Moreover, the report from FAO shows that animal protein contributed 6.5 g of an estimated 53.4 g daily per capita protein intake. This figure is far below the 34 g / person/day or 40% of an average 85.9 /day of total protein in developed countries of the world. In Nigeria, the animal-protein intake is grossly inadequate. In Nigeria, tofu consumption is increasing due to an increase in Asia immigrants, greater acceptance of soy foods by the general population and increased recognition of health benefits of soy foods, especially by those who wish to reduce their consumption of animal products. Secondly, many who are now vegetarians and transitioning from fresh meat to meat of plant protein (tofu) need this analogue to feel as if animal meat is been consumed. Coagulation of protein and oil (emulsion) suspended in the boiled soy milk is the most important step in the production of tofu. This process is accomplished with the aid of coagulants. Two types of coagulants (salts and acids) are used commercially (Berk, 1992). The use of different coagulants in the preparation of tofu determines the nutritional composition of tofu (Oboh and Omotosho, 2005). Tofu is coagulated with different coagulants contain different minerals, textures as well as yield (Prabhakaran et al., 2006). Hence, there is need for vegetarians to be knowledgeable with the best preparation method of tofu, a plant protein which will give rise to better storage time and an improved taste. The objective of the study is to determine the nutritional and functional properties of soy flour, to compare the physicochemical properties and the microbial population of fresh tofu coagulated with Epson salt, lime and tamarind .
Sources of raw materials
The soybean and the coagulants (Epson salt, lime and tamarind) were purchased from Aba Market Ahia Ohuru in Abia State in Nigeria.
Sample preparation
The soybean sample was dehulled and milled with an attrition mill to obtain flour. The milled soybean was then allowed to cool before storing in an air tight container. The lime was carefully washed and the liquid squeezed out into an airtight container. The tamarind seed was made into 20% concentrated solution and also stored in airtight container.
Tofu production
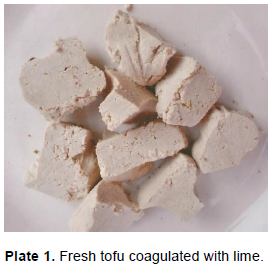
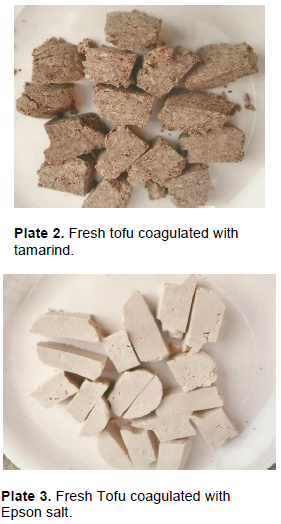
The processes involved in tofu production are: grinding to flour, soaking, boiling, coagulating, pressing and cutting into shapes. Four hundred and fifty grams (450 g) of soybean flour was weighed and soaked in 4500 ml of sterilized water for 5 h in a sterile container, according to the method described by Sack et al. (2006). Thereafter, the soaked soybean was sieved with muslin cloth and soy milk collected. The total soy milk collected was 9000 ml. The 9000 ml soymilk realized was divided into three to get a 3000 ml soy milk sample. Each 3000 ml soymilk was given different treatment from different coagulants.
The first 3000 ml soymilk was allowed to boil for 15 min. On reaching the boiling point, lime solution of 0.314 mol/dm-3 was added and allowed to coagulate the soymilk. After coagulation, the coagulated milk was poured in cloth bag to drain water. In the same manner, the other 3000 ml soymilk was allowed to boil for 15 min. A weighed quantity (10 g) of Epson salt was added until coagulation took place. The coagulated milk was collected in a cloth bag to drain water. Lastly, the other 3000 ml sample was treated with a 0.42 mol/dm-3 tamarind solution.
The three samples were tied in the cloth bag and the whey was pressed out using a presser and allowed for 12 h to drain.
The following tofu was obtained: tofu coagulated with lime, tofu coagulated with Epson salt and Tofu coagulated with tamarind (Plates1 to 3).
Physical/ chemical properties
The coagulated samples from the 3000 ml of soy milk obtained from different coagulants were weighed using electronic weighing balance. Stop clock was used to determine the coagulation time. pH was determined with the use of pH meter placed in the supernatant of the different coagulated sample (Njoku et al., 1990).
Proximate analysis
Proximate analyses of the fresh tofu made from the three coagulants were determined. The moisture content, crude protein, fat, crude fibre and carbohydrate were determined.
Moisture content determination
The moisture content of the fresh tofu was determined by the conventional method (AACC, 2000). Moisture cans were dried in the oven and put in the desiccators to cool. The cans were weighed after cooling and 2 g of the samples was put in each moisture can and placed in the oven and heated at 105°C for 3 h. The samples were weighed after each hour until a constant weight was obtained and thereafter the cans were cooled in the desiccators before weighing. The difference was determined and expressed as a percentage of the original sample weight.
Ash content determination
In determining the ash content of the samples, the method recommended by AACC (2000) was used. Porcelain crucibles were thoroughly dried by heating at 600°C and then cooled in the desiccators before weighing quickly to prevent moisture absorption. The crucibles containing the sample were covered and placed into the muffle furnace whose temperature was set at 550°C. This temperature was maintained for about two hours until a whitish ash was obtained. After two hours, the muffle furnace was switched off and the crucibles containing the sample weighed and percentage ash content determined
Crude fiber determination
The crude fiber determination was determined by the method described in Onwuka (2005). Two grams (2 g) of sample was treated with 150 ml of 1.25% H2SO4 solution for 30 min. It was washed with several portion of hot distilled water using a two-fold muslin cloth to retain the sample particles. When drained dried, the washed sample was carefully transferred back to the flask and 150 ml of 1.25% NaOH solution was added to it. It was again boiled for 30 min, washed as before with hot water and allowed to drain dry. It was then very carefully transferred quantitatively to be weighed in porcelain crucible. The sample in the crucible was dried for one hour, at 105°C in the oven, cooled in a desiccators and re-weighed. It was then finally burnt to ashes in a muffle furnace, cooled and weighed crude fiber content was determined.
Fat determination
Fat content was determined by the continuous solvent extraction in Soxhlet reflux apparatus (AOAC). Two grams (2 g) of each sample was wrapped in a porous filter paper and placed in a Soxhlet reflux filter. An oil extraction flask was weighed and filled with 200 ml petroleum ether. The reflux flask was mounted on the extraction flask and connected to a condenser. The solvent was brought to boil on an electro thermal heater. The vaporized solvent (petroleum ether) was condensed into the reflux flask to completely submerge the wrapped sample and extract the fat therein. When the reflux flask was filled, it refluxed carrying the extracted oil back into the extraction flask while the boiling continued. The cycle of boiling, vaporization, condensation extraction and reflux was allowed to go on for four hours before the solvent was recovered leaving the extracted oil in the flask. The flask (with oil) was further dried in the oven at 60°C for 30 min to remove any remaining solvent. It was cooled in the desiccators and weighed.
Protein content determination
The protein content was carried out by the Kjeldahl methods (AOAC, 1975) modified by Onwuka (2005). Half a gram (0.5 g) of the sample was digested by boiling in 10 ml of conc. H2SO4 in the presence of one selenium catalyst tablet. Digestion was done under a fume cupboard until a clear solution (digest) was obtained. The digest was diluted with distilled water and transferred to a 100 ml volume flask where it was made up to mark with the distilled water. An aliquot (10 ml) of the digest was mixed with equal volume of 45% NaOH solution in a Kjeldahl apparatus and distilled. The distillate was collected in 10m/s of 4% boric acid solution into which three drop of mixed indicator (methyl red/bromocresol green) was added. A total of 50 ml distillate was collected and titrated against 0.02N H2SO4 from green to a deep red endpoint. A reagent blank without sample was also digested, distilled and titrated as described above. The total N2 was calculated and the protein content was obtained.
Determination of carbohydrate
This was calculated by difference as the Nitrogen free extraction (NFE) (Onwuka, 2005). The formula below was used.
Percentage CHO (NFE) = 100% - (Protein + Fat + Fiber + Ash + Mc)
Functional properties of fresh Tofu
Bulk density
The bulk density was determined using the methods described in Onwuka (2005). A 10 ml capacity graduated measuring cylinder was weighed. The sample (10 g) was weighed into 10 ml measuring cylinder and the volume was recorded as the bulk volume (v). The bottom of the cylinder was raised about 10 cm above the slab and made to fall in the platform continuously until a constant volume was observed. The packed volume was recorded. The loose density (LBD) and packed bulk densities (PBD) were calculated as the ratio of the sample weight to the volume occupied by the sample before and after tapping.
Swelling index
The swelling index was determined using the methods described in Onwuka (2005). The sample (3 g) was weighed into a clean dry and graduated cylinder (50 ml). The flour samples were gently leveled and the volume was noted before addition of 30 ml distilled water (27°C). The cylinder was swirled manually and allowed to stand for 60 min and 24 h while change in volume (swelling) was recorded. The swelling index was calculated as the ratio of the initial volume of sample in cylinder to the final sample.
Water / oil absorption capacity
The water/oil absorption capacity was determined by the methods of Onwuka (2005). One gram of sample was weighed into a chemical graduated centrifuge tube. Using a warring whole mixer, 10 ml distilled water/oil was added and mixed thoroughly. The sample was allowed to stand for 30 min at room temperature (28°C) and this centrifuged at 5,000 x g for 30 min. The volume of free water/ oil was read from the graduated centrifuge tube. The water/ oil absorption capacity was calculated by multiplying the amount of water /oil absorbed (total minus free) by the density of water / oil (1 g/ml).
Emulsification capacity (EC)
The emulsification capacity of the flour was determined by the method of Onwuka (2005) by blending 2 g flour sample with 25 ml distilled water at room temperature for 30 s in a warring blender at 1600 rpm. After complete dispersion, 25 ml of vegetable oil (soy oil) was added and blended together for 30 s. The mixture was transferred into a centrifuge tube and centrifuged at 1,600 rpm for 5 min. The volume of oil separated from the sample after centrifuge was read directly from the tube. Emulsion capacity is expressed as the amount of oil emulsified and held per gram of sample (Padmashree et al 1987)
Gelatinization temperature
The gelatinization temperature was determined by the methods of Onwuka (2005), by preparing a 10% suspension of the flour sample in a test tube. The suspension was heated in a boiling water bath with continuous stirring. The temperature was recorded 30 s after gelatinization as the gelatinization temperature.
Determination of minerals
The mineral composition of the samples was determined by the methods described by Onwuka (2005). The minerals determined were Ca, K, Na, P, Mg and Fe using Atomic Absorption Spectophotometer. One gram of the dried sample weighed out for each of the minerals to be determined. Then 20 ml of the acid mixture (650 ml Conc HNO3, 80 ml PCA, 20 ml Conc H2SO4) was added in the digestion flask with 1 g weighed dried sample. The flask was heated until a clear digest was obtained. The dilute was digested with distilled water made up to the 500 ml mark. Appropriate dilutions were made for each element.
Microbiological analysis
Tryptone Soy Agar (TSA) and Sabourand Dextrose Agar (SDA) were used for determination of bacterial and fungal population of the samples. The two media were weighed according to the manufacturers’ specifications. They were sterilized at 121°C for 15 min at 15 psi using the autoclave. After sterilization, they were allowed to cool and poured into sterile petri dishes for solidification.
Microbial population determination
A dilution was obtained from the three samples of tofu by dissolving 25 g each in 225 ml of 0.1% (w/v) peptone water (pH 7.2±0.2), to get a 1:10 dilution (Ezeama, 2007) under strict aseptic conditions. From these, subsequent dilutions were made by introducing 1.0 ml each of the samples into liquefied Tryptone Soy Agar (TSA) and Sabourand Dextrose Agar (SDA) and mixed by rotating the plates. These were allowed to solidify on a level surface. The TSA plates were incubated at 35- 37°C for 18-24 h for bacteria and aerobically at 28 ±2°C for 4-5 d for fungi. This process was done in duplicate for each sample. The samples include: two samples from tofu coagulated with lime, two samples coagulated with Epsom salt and two samples coagulated with tamarind. These processes were repeated on SDA media to determine fungal count. On establishment of growth, discrete colonies were counted (Ezeama, 2007), and recorded as colony forming unit per gram (CFU/g).
Statistical analysis
Treatment mean were compared using Duncan’s Multiple Range Tests (DMRT) at 5% significant level.
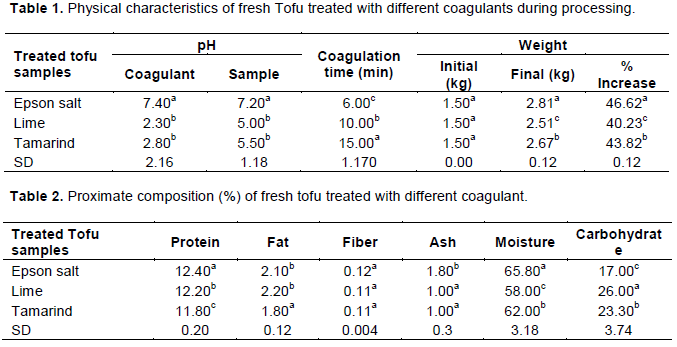
The result of Table 1 shows the physical characteristics of fresh tofu treated with different coagulants, The pH value of Epson salt used as coagulant was significantly different (P<0.05) from that of lime and tamarind. There was no significant difference (P>0.05) between the pH value of tamarind and lime. The pH value ranged from 2.30 to 7.40. Epson salt had the highest value followed by lime and tamarind. The components of these coagulants affected their pH values. The addition of lime and tamarind used as coagulants in soymilk samples reduced the acidity of lime treated tofu and tamarind treated tofu respectively. The isoelectric pH of soybean ranges from 4.2 to 5.6, but the lowest solubility occurs at the protein isoelectric point of 4.6 where molecule net charge is zero. The addition of acid coagulant (lime and tamarind) which contains citric and tartaric acid respectively lowered the pH of the mixture to isoelectric point where the solubility is at minimum. This led to the precipitation of protein. This agrees with that of Shurtleff and Aoyagi (2000), that the addition of lime lowered the pH of the samples. The pH of lime lowered the sample to 5.00 while the pH of tamarind lowered the pH of the sample to 5.50 (Table 1). This falls within the isoelectric range of soybean but not at the isoelectric point of 4.6 where the pH net charge is zero.
In the case of the Epson salt treated tofu the addition of the coagulant slightly increased the acidity. The Epson salt coagulated the soymilk by metallic cation (Mg++) which reacted with the various proteins in the soymilk and precipitated it to form curds. According to Shurtleff and Aoyagi (2000), the protein precipitated by magnesium salt is 80% of the soymilk protein.
The coagulation time (min) of the sample was greatest in tamarind, followed by lime then Epson salt. The coagulation time ranged from 6.00 to 15.00 min (Table 1). There was a significant different (p<0.05) in the coagulation time of tofu coagulated with Epson salt and tofu coagulated with lime. There was also a significant difference (p<0.05) in tofu coagulated with tamarind and lime. The difference in the coagulation time could be as a result of the difference in the ionic strength. The ionic strength is very high in Epson salt; therefore the addition of salt increased the ionic strength of the protein which promoted quick aggregation by the divalent cations. The ionic strength also enhanced gel formation and gel strength lowering coagulation time (Iwe, 2003). But the use of lime and tamarind lowered the pH of the protein which first weakens the gel strength. The high acidity precipitated the protein without forming gel. The weakening of the gel led to a longer time in precipitating protein by insolubility. At extreme pH, soy protein has been observed to become insoluble according to Iwe (2003).
The final weight ranged from 2.51 to 2.81 kg (Table 1). There was significant difference (p<0.05) between the fresh tofu sample treated with Epson salt and lime. There was also a significant difference (p<0.05) between the sample treated with lime and tamarind in weight gain. The weight gain was higher in Epson salt treated tofu followed by tamarind treated tofu than lime treated tofu. This weight gain of Epson salt treated tofu could be attributed to the water binding capacity which varies with protein source, composition and presence of carbohydrate, lipid, pH and salt. According to Iwe (2003), the water binding is dependent on pH. At the pH of 7, the water binding capacity of soy protein was much higher than in pH of 5 and 6. Therefore at high pH protein tend to bind more water. This explains why the weight of the Epson salt treated tofu with pH of 7 was higher than tamarind treated tofu and lime treated tofu.
The higher weight in Epson salt treated tofu could also be as a result of the salt being capable of coagulating protein concentration of below 3%, (Iwe, 2003). Therefore enough protein was precipitated soymilk due to the ionic attraction. In the case of lime and tamarind coagulation, some proteins such as globulins were still soluble at that pH during the time of coagulation. This gave rise to lowered weight (Liu, 2000).
The proximate composition of fresh tofu as presented in Table 2 shows that the protein content in the three samples ranged from 11.80 – 12.40% with the protein of Epson salt treated tofu ranking highest followed by lime treated tofu. There were significant differences (p<0.05) in protein, moisture and carbohydrate in all the three samples. The high protein content in Epson salt treated tofu (12.40%) could be as a result of the solubility of the protein brought about by the pH of Epson salt (Iwe, 2003) which at extreme pH of the soy protein became insoluble. It could also be attributed to the capability of Epson salt to coagulate as much little as 3% protein concentrate in solution, due to the ionic strength of Epson salt (Iwe, 2003). Hence with the pH value of Epson salt (7.4) all the protein were soluble and precipitated out compared to pH of 2.3 and 2.8 for lime and tamarind treated tofu respectively (Table 1).

The fat contents were 1.80, 2.10 and 2.20% for tamarind, Epson salt and lime treated tofu respectively. There were significant differences (p<0.05) between tamarind treated tofu and other samples. The decrease in fat content of tamarind coagulated tofu could be as a result of the high amount of anti-oxidant contained in tamarind (Friedman et al., 2000). The high amount of isoflavone contained in tamarind could also help in the reduction of low density lipo-protein and triglyceride in tofu coagulated with tamarind(Iwe,2003).The fat content of Epson salt coagulated tofu could also be low due to the higher protein content of this Epson salt coagulated tofu (Brim, 1973).
Epson salt treated tofu had the highest ash content. There was significant difference in the ash content of tofu fermented with Epson salt and other treatments. This could be due to the addition of magnesium Sulphate (Epson salt) used as coagulant. This agrees with the type of coagulant used, which determines the mineral composition of the tofu (Oboh and Omotosho, 2005). The crude fiber contents of the tofu were low with values of 0.12, 0.11 and 0.11% for Epson, lime and Tamarind treated tofu respectively. There was no significant (p>0.05) difference between the treatments. The crude fibre reduced during filtration as the filtrate (soymilk) through the filter which eliminated some of the fibre in the filter cake. The crude fiber is important in the diet, since it increases the faecal output and prevents gastrointestinal diseases in man (Amajor et al., 2014).
The moisture level (58.0 – 65.8%) attained in this study showed that of tofu coagulated with Epson salt was the highest followed by tofu coagulated with tamarind and the lowest with tofu coagulated with lime. The variation in moisture content of tofu prepared with different coagulants is probably due to the tofu particles influenced by different anions and its ionic strengths towards the water holding capacity of soy protein gels. It may also be due to the unique coagulating properties of the coagulants used. This could be as a result of the high protein content in Epson salt coagulated tofu binding water to the protein according to Iwe (2003).
The carbohydrate content ranged from 12.00 to 23.3% with the lime treated tofu ranking highest followed by tamarind coagulated tofu then Epson salt coagulated tofu. There were significant differences (p<0.05) in the three samples. These differences may be as a result of an increase in protein leading to significant decrease in the non-protein constituents such as oil and sugar (Salunkhe et al., 1992).
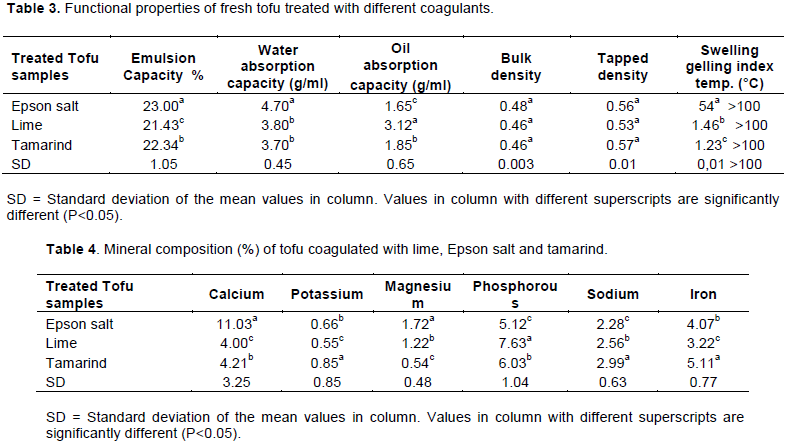
Table 3 shows the function properties of fresh tofu treated with different coagulant. Functional properties determine the behavior of nutrients in food during processing, storage and preparation because they affect the overall quality of foods and acceptability (Amajor et al., 2014). The water absorption capacity of the Epson salt, lime and tamarind treated tofu were 4.70, 3.80 and 3.70 g/ml respectively. The functional properties of fresh tofu treated with Epson salt, lime and tamarind were significant difference (p<0.05) in water absorption capacity of tofu treated with Epson salt, lime and tamarind. The Epson salt treated tofu has the highest value at 4.70 g/ml. Water absorption capacity is usually defined as weight increase in relation to the original dry weight of the sample. Water absorption is reported on the basis of protein weight according to Apotiola and Fashakin ((2013).
From Table 2, the protein content was highest on Epson salt treated tofu because the solubility of protein depends on pH. At a lower pH of 2, the solubility is lost while at pH 6.5 to 7.5, there is higher solubility of protein according to Iwe (2003). The increase in solubility of protein in Epson salt treated tofu could be as a result of its higher pH at 7.2. It could also be as a result of its ionic strength. The use of magnesium salt promotes aggregate of protein even at low concentration of 3% as reported by Iwe (2003). This helped to increase the protein concentration as well as the water binding capacity according to McWaters et al. (2003). On the other hand, McWater et al. (2003) reported that lower water absorption is due to less availability of polar amino acids in flour. Water absorption capacity is important in bulking and consistency of product as well as in baking application (Apotiola and Fashakin, 2013).
The oil capacity ranged from 1.65 g/ml to 3.12 g/ml oil absorption capacity while Epson salt treated tofu had the lowest. There was significant difference (p<0.05) between Epson salt treated tofu and lime treated tofu. There was also a significant difference between lime treated tofu and tamarind treated tofu. The oil absorption capacity is the measure of the amount of oil that can be absorbed by the physical matrix of the food. It indicates the degree of hydrophobicity of the system (Hayta et al., 2002). The oil absorption capacity ranked highest in lime treated as a result of low NSI (Nitrogen solubility index). According to Iwe (2003) and Liu et al. (2002), soy proteins having low NSI value have a high fat absorption capacity. The oil absorption capacity is also affected by the water holding capacity. Because the water holding capacity was lower in lime treated tofu therefore the oil capacity became higher.
The emulsifying capacity of fresh tofu treated with Epsom salt, lime and tamarind ranged from 23.00 - 22.34. There were significant differences (p<0.05) in Epson salt treated tofu, lime and tamarind. Epson salt treated tofu had the highest emulsifying capacity due to the high protein content. Proteins are effective in promoting emulsion formation because they possess both hydrophilic and hydrophobic regions (Liu et al., 2002). Soy protein performs two main emulsifying functions which include encapsulating fat droplets through the hydrophobic groups and forming a continuous protein gel network through the aqueous phase (hydrophilic group) (Iwe, 2003); therefore, the higher the solubility of protein, the higher the emulsion capacity. Emulsifying capacity is the formation of a stable emulsion by the intimate mixing of two or more immiscible liquids so that one dispersed phase is formed into very small droplets within the second the continuous phase (Fellows, 1988).
The bulk density loose of the tofu ranged from 0.46 to 0.47 and the bulk density tapped ranged from 0.53-0.57 (Table 3). There were no significant differences (P>0.05) in the bulk density of fresh tofu treated with lime, tofu treated with tamarind and tofu treated with Epson salt. Bulk density gives an indication of the relative volume of packaging material required and high bulk density is a good physical attribute when determining the mixing quality of a particular matter. The bulk density is a reflection of the load the flour sample can carry if allowed to rest on one matter. Therefore, tofu as a product of soy flour can be packaged without breakage from the different coagulants. The density of processed product dictates the characteristics of the container or package product. Density influences the amount and strength of packaging material, texture or month feel. Lower bulk density would be an advantage in the formulation of complementary foods while higher bulk density is desirable for greater ease of dispensability (Apotiola and Fashakin, 2013).
The swelling index ranged from 1.23 – 1.54 or the fresh tofu treated with lime, Epson salt and tamarind (Table 3). There was significant difference (p<0.05) between tofu treated with Epson salt and tofu treated with lime and tamarind. The swelling index of tofu treated with Epson salt had the highest value followed by the tofu treated with lime then tofu treated with tamarind. This implies that the Epson salt treated tofu can increase in volume when immersed in water. Swelling capacity is the measure of the ability of starch to immobile water and swell. High swelling capacity has been reported as part of the criteria for a good quality product (Apotiola and Fashakin, 2013).
The gelation temperature was above 100°C for the fresh tofu samples treated with the three coagulants (lime, tamarind and Epson salt). This could be as a result of the interaction between lipid and proteins which could affect the gelling as well as the time, strength of pressing and the particle size of the solid (Iwe, 2003).
Table 4 shows the mineral composition of tofu coagulated with lime, Epson salt and tamarind. The calcium content of all the tofu ranged from 4.00 to 11.03%. The tofu coagulated with Epson salt ranked highest (11.03%) and the tofu coagulated with lime was the lowest. The high calcium content of tofu coagulated with Epson salt could be as a result of the low acidity of the sample (Reddy et al., 1982).
There potassium found in the soybean flour used for production was negligtble. This indicated that the presence of potassium in the coagulated tofu could come from the coagulants. The potassium content ranged from 0.55 to 0.85% (Table 4). The highest was from tofu coagulated with tamarind followed by tofu coagulated with Epson salt than with tofu coagulated with lime. This could be as a result of high potassium content contained in tamarind. Epson salt could also contain a little potassium salt which contributed to the potassium content of tofu coagulated with Epson salt.
Magnesium content ranged from 0.54 to 1.72% (Table 4). The highest was found in Tofu coagulated with Epson salt followed by lime coagulated tofu than tamarind coagulated tofu. The magnesium content may be attributed to the addition of the Epson salt and also phytic acid affects magnesium content according to Shimi and Hasnah (2013). Since the Epson salt was used in coagulation, there was also a reduction in acidity which increased the value of magnesium in Epson salt coagulated tofu compared to tamarind and lime coagulated tofu with high acidity value (Sareen et al., 2005).
The phosphorus content ranged from 5.12 to 7.63% (Table 4). The highest was found in lime (7.63%) coagulated tofu followed by lime coagulated tofu then Epson salt coagulated tofu. There were significant differences (p<0.05) in all the samples. The lowest rank in Epson salt coagulated tofu could be as a result of the magnesium content of the sample. The presence of calcium and magnesium binds dietary phosphorus (Sareen et al., 2005). Phytate helps to liberate phosphorus, therefore the presence of high acidity helped in liberating phosphorus as found in lime and tamarind coagulated tofu. According to Salunkhe et al. (1992), the amount of phosphorus is highest in tofu compared to all other soy product. This could be as a result of heating of the curd which liberated the phosphorus from the phytate.
The sodium content ranged from 2.28 to 2.99% (Table 4). There were significant difference (p<0.05) among the three samples. The sodium contents of all the samples were low.
There was significant difference (p<0.05) in the iron content between tofu coagulated with Epson salt and tofu coagulated with lime and as also a significant difference (p<0.05) between the tofu coagulated with lime and tofu coagulated with tamarind. The iron ranged from 3.22 – 5.11%. The tofu coagulated with tamarind ranked the highest due to the high content in iron. This may be as a result of the iron contained in tamarind. The value of iron content agrees with Salunkhe et al. (1992) which states that the iron content in soycurd ranges from 2 - 17%.
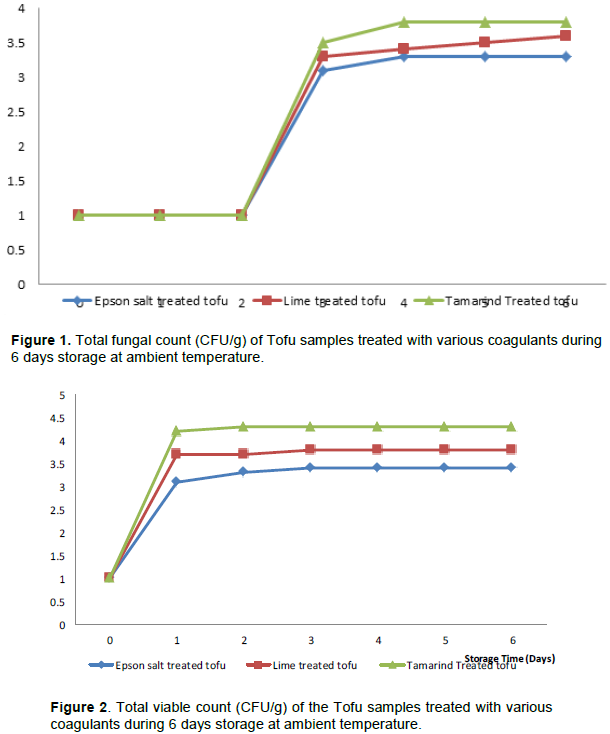
The result in Figures 1 and 2 show the total fungal and total viable count of ambient stored tofu treated in Epson salt, lime and tamarind respectively. The total fungal count was least in Epson salt treated tofu gave(2.00x10 3CFU/g) while tamarind gave the highest after 6 days of ambient storage as shown in Figures 1 and 2. This makes the tofu treated in Epson salt safe and acceptable for formulation food. The difference among the treatments could be as a result of lower water activities in tofu treated with Epson salt. The lower water activity was due to the presence of salt. Water activity (aw) is an index of the availability of water for the growth of micro-organism (Frazier and Westhoff, 2011). The salt slowed down or prevented the growth of micro-organism by causing high osmotic pressure and hence plasmolysis of cells which may harm the cell of micro-organism. It led to dehydration of food by drawing out and tying up moisture as it dehydrates microbial cells. Epson salt reduced the solubility of oxygen in the moisture, which interfered with the action of proteolytic organisms (Frazier and Westhoff, 2011).

Acid precipitable proteins such as precipitated by lime and tamarind are called storage protein. These storage proteins do not possess biologically active proteins which compose of trypsin inhibitors, hemaglutinine, lipoxygenases, β amylases etc. But these biologically active proteins are contained in the supernatant or whey proteins. The presence of these biologically active protein caused quick decomposition of tofu and soymilk since all the whey protein were not completely pressed out (Salunkhe et al., 1992). Therefore the existence of all these enzymes reduced the storage time of the acid coagulated tofu.
Microorganisms especially Lactobacillus spp. has the inability to synthesis most of the vitamins they require, making them unable to grow well in foods poor in vitamins but useful in assays for the vitamin content of food (Frazier and Weshoff, 2011). Tamarind has a lot of vitamins. This affected the tofu coagulated with tamarind.
The presence of the vitamins and other rich nutrient aided in the fast decomposition of tofu treated with tamarind (Table 3).
Based on the result of the findings, the following conclusions were drawn. Soy flour coagulated with Epson salt produced Tofu with the highest protein, Calcium, Magnesium and functional properties such as emulsion capacity, water absorption capacity and swelling index compared to Lime and Tamarind coagulated Tofu. Furthermore, Epson salt coagulated Tofu gave the least microbial attack indicating lower susceptibility to spoilage.
The authors have not declared any conflict of interests.
The authors wish to acknowledge the assistance of the laboratory staff of the Department of Food Science And Technology MOUAU for their contribution to the study.
REFERENCES
|
AACC (2000). Approved Methods of the American Association of Cereal Chemist 10th Edition, AACC Press, St Paul MN.
|
|
|
|
AOAC (1975). Official Methods of Analysis Association of Official Analytical Chemist 12th Edition, Washington DC.
|
|
|
|
|
Amajor JU, Oti E, Ekeledo N, Omodamiro R, Amajor EE, Aniedu C (2014) . Studies on the characteristic properties of fermented sun-dried orange Fleshed Sweet potato Flour Nigeria Food Journal 32:45- 53.
Crossref
|
|
|
|
|
Apotiola ZO, Fashakin JF (2013). Evaluation of cookies from wheat, yam and soybean blend, Department of Hospitality Management Lagos State Polytechnic Ikorodu Lagos, Nigeria.
|
|
|
|
|
Berk Z (1992). Technology of production of edible flours and protein products from soybeans, FAO agricultural services bulletin 97, Rome: Food and Agriculture Organization of the United Nations.
|
|
|
|
|
Brim CA (1973). Quantitative genetics and breeding. In: Soybean; improvement, production and uses, ed. B.F. Caldwell, Madison: American Society of Agronomy.
|
|
|
|
|
Ezeama CF (2007). Food Microbiology: Fundamentals and Applications. Natural Prints Lagos. Nigeria, pp. 64-66.
|
|
|
|
|
Dashiell KE (1993). Soybean Production and Utilization in Nigeria. Paper presented at the National Workshop on small scale and industrial level processing of Soybean held at IITA, Ibadan, 27th-29th July.
|
|
|
|
|
Fellows PJ (1988). Food processing technology principles and practice. Woodhead publishing limited Cambridge England, P. 110.
|
|
|
|
|
Frazier WC, Westhoff DC (2011). Food Microbiology. The McGraw Hill Companies, pp. 341-348.
|
|
|
|
|
Friedman M, Fitch TE, Levi CE, Yokoyama WH (2000). Feeding Tomatoes to Hamsters Reduces their Plasma LDL Cholesterol and Triglycerides. Journal of Food Science 65:897-900.
Crossref
|
|
|
|
|
Hayta M, Alphaslan M, Baysar A (2002). Effect of Drying Method Functional Properties of Tarhana. A Wheat Flour-yougurt Mixture. Journal of Food Science 67(2):740-744.
Crossref
|
|
|
|
|
Iwe MO (2003). The Science and Technology of Soybean. Published by Rojoint Communication Services Ltd, Enugu Nigeria pp. 66-100.
|
|
|
|
|
Liu K (2000). Expanding Soybean Food Utilization. Food Technology 54(7):46-47.
|
|
|
|
|
McWaters HG, Hall A, Bastow RM, Davis SJ, Hanano S, Hibberd V, Doyle MR, Sung S, Halliday KJ, Amasino RM, Miller AJ (2003).The Time for Coffee Gene Maintains the Amplitude and Timing of Arabidopsis Carcadias Clocks. Journal of Plant Cell 15(11):2719-2729.
Crossref
|
|
|
|
|
Njoku HO, Ogbulie JN, Nnubia C (1990). Biochemical changes during natural fermentation of African oil bean for the production of ugba. Journal of the Science of Food and Agriculture 49(4):457-465.
Crossref
|
|
|
|
|
Oboh G, Omotosho OE (2005). Effect of types of Coagulant on the Nutritive Value in vitro Multienzyme Protein Digestibility of Tofu. Journal of Food Science and Technology 3(2):182-187.
|
|
|
|
|
Prabhakaran MP, Perera CO, Valiyaveettil S (2006). Effect of different coagulants on the isoflavone levels and physical properties of prepared firm tofu. Food Chemistry 99(3):492-499.
Crossref
|
|
|
|
|
Padmashree TS, Kshmi LV, Puttaragi S (1987). Effect of Traditional Processing on the Functional Properties of Cowpea (vigna catjang) flour. Journal of Food Science and Technology 24:221-225.
|
|
|
|
|
Reddy NR, Pierson MD, Sathe SK, Salunkhe DK (1982). Legume-based Fermented Foods: Their Preparation and Nutritional Quality. Critical Reviews in Food Science and Nutrition 17:335.
Crossref
|
|
|
|
|
Sacks FM, Lichtenstein AH, Linda HW, Kris-Etherton P, Winston M (2006). American Heart Association Nutrition Committee Soy Protein, Isoflavones, and Cardiovascular Health. An American Heart Association Science Advisory for Professionals from the Nutrition Committee. Circulation 113(7):1034-1044.
Crossref
|
|
|
|
|
Salunkhe DK, Chavan RN, Adsule KN, Kadam SS (1992). World Oilseeds, Chemistry, Technology and Utilization. An AVI Book Published by Van Nostrand Reinhold. New York.
|
|
|
|
|
Sareen SG, Jack LS, James LG (2005). Advanced nutrition and human metabolism. Thompson Wadsworth Belmont CA., USA.
|
|
|
|
|
Shimi G, Hasnah H (2013). Does cooking affect the phytate content in local soy based dishes? International Food Research Journal 20(5):2873-2880.
|
|
|
|
|
Shurtleff W, Aoyagi A (2000). Tofu and soymilk production: a craft and technical manual (3rd ed.), Lafayette, California: Soyfoods Center.
|
|
|
|
|
Onwuka GI (2005). Food Analysis and Instrumentation Theory and Practice. Naphtali Prints. Lagos, pp. 90-139.
|
|
|
|
|
Steinkraus KH (1995). Handbook of Indigenous Fermented Foods. New York, Marcel Dekker, Inc.
|
|