ABSTRACT
This study was conducted to assess raw milk bacterial loads and micro-organisms associated with milk handling practices and raw milk chain in the North-western region of Rwanda. A multistage sampling method was used to collect sixty-seven raw milk samples that were analyzed for milk quality at four stages of the raw milk chain: dairy farmers, milk hawkers, milk collection centres (MCC) and milk kiosks. Total bacterial counts (TBC) at different stages of the chain were determined and microorganisms were isolated. A questionnaire was distributed to gather information on factors and milk handling practices that influence milk quality at farm level. The study revealed a TBC mean values of 1.2 × 10⁶ CFU/ml (dairy farmers), 2.6 × 10⁷ CFU/ml (milk hawkers), 1.5 × 10⁶ CFU/ml (MCC) and 6.9 × 10⁶ CFU/ml (kiosks/restaurants). The prevalent micro-organisms were: Escherichia coli (E. coli), 26.9%; Salmonella spp., 16.4%; Streptococcus spp., 16.4%; coagulase- negative staphylococci (CNS), 14.9%. Bacterial load was highly associated with containers used for milk transport, cleaning time of milk containers and source of water used to clean containers. It is, therefore, highly recommended that all concerned parties in the raw milk value chain improve their milk handling and storage practices.
Key words: Bacterial contamination, milk handling, milk quality, north-western Rwanda, raw milk.
Human health is greatly threatened by the pathogenic microorganisms commonly isolated from milk and milk products. Raw milk quality is determined by various factors including composition (butterfat, protein, lactose, milk solids, etc.), udder health (mastitis infection, somatic cell count (SCC)) and hygiene (total bacterial count, thermoduric bacteria, psychotropic bacteria) (O’Brien et al., 2009). Microbial contamination in milk may result in milk spoilage and milk-borne diseases spreading to humans (Ngasala et al., 2015). Microbial contamination
of milk may be primary, secondary, or tertiary (Parekh and Subhash, 2008). Primary infection is usually from infected lactating cows. Secondary infection can be from milkers during milking, milk handlers during transportation and storage, milk handling procedures, water used in cleaning, unclean utensils and/or milking equipment. Tertiary infection is mainly due to re-contamination of milk after processing due to unhygienic conditions, improper handling and poor storage of milk before serving.
Raw milk is a means of transmission of milk-borne pathogens to humans (Addo et al., 2011). However, Harding (1995) demonstrated that in milk stored at a standard temperature of 4°C for up to 15 h bacteria do not multiply appreciably. He also demonstrated that it is possible to store milk for 7 days at 1.5-2°C without spoilage provided the initial quality is good (Harding, 1995). Total plate count of microorganisms in milk provides useful general information on the microbiological quality and indirectly the conditions under which it was produced (Jay, 2000).
According to Boor et al. (1998) TBC for raw milk must be less than or equal to 105/ml; for retailed milk, it must be less than or equal to 2×10⁴/ml or gram; while for frozen desserts it must be 5×10⁴/gram or less. The USA has a standard of 105 bacterial cells per milliliter; however, other countries take 2×10⁵ colony forming units/milliliter as the acceptable bacterial limit (Lore et al., 2005). The microbial limit of total plate counts is used to grade milk as follows: Grade I or A (< 2×10⁵ bacterial cells/ml), II or B (>2×10⁵– < 106 bacterial cells/ml) and III or C (>106– < 2×10⁶bacterial cells/ml) in Rwanda (COMESA, 2006). In Kigali, Rwanda, Doyle et al. (2015)reported unacceptably high TBC in milk from three major segments of the dairy value chain, milk transporters, MCCs and milk kiosks.
There are pathogens which cause milk contamination. These include Escherichia coli, Staphylococcus aureus, Salmonella spp., Listeria monocytogenes, Brucella abortus, Mycobacterium spp., Campylobacter spp., Leptospira spp., Clostridium spp., Pseudomonas aeruginosa and Proteus spp. (Farah et al., 2007; FAO, 2010). The microorganisms that are principally involved in milk spoilage are psychrotrophic organisms, most of which are destroyed by pasteurization temperatures (Goff et al., 1989). However, some, such as Pseudomonas fluorescens and Pseudomonas fragi, can produce proteolytic and lipolytic extracellular enzymes which are heat stable and capable of causing spoilage (Goff et al., 1989). In addition, some species and strains of Clostridium, Microbacterium, Micrococcus, Bacillus, Corynebacterium, Arthrobacter, Lactobacillus, and Streptococcus can withstand pasteurization temperatures and grow at refrigeration temperatures leading to spoilage of treated milk (Banwart, 1989).
Ideally, milk meant for human consumption must be free from any pathogenic organisms (Bertu et al., 2010). Considering that milk is normally sterile when it comes from a normal cow’s udder, contamination occurrs during milking, transportation, cooling, storage and processing (Farah et al., 2007). There is need for good management of raw milk and milk products in order to minimize the contamination. This will subsequently enable the dairy sector serve as a contributing tool for alleviation of poverty and creation of wealth in developing countries (FAO, 2010).
Food safety is an area of great concern in relation to public health management and particularly from an economic perspective (Kaiza, 2011). Microbial contamination of milk is a risk to the public health through transmission of food borne diseases (Pires et al., 2009). Raw milk is and continues to be a major distress in the epidemiological data of campylobacteriosis, salmonellosis, tuberculosis, brucellosis, hemorrhagic colitis, Brainerd diarrhoea, Q fever, listeriosis, among others (Alvarez, 2009). It is known that, microbial contamination of milk could be reduced by adhering to effective hygienic practices at the farm level. Many developing countries are ignorant about the existence of milk-borne infections and consuming raw milk predisposes small-scale livestock farmers, consumers and the general public at risk of contracting these infections (Mosalagae et al., 2011). Therefore, this study was conducted to establish microbial contamination and assess factors and management practices associated with bacterial contamination along raw milk value chain in three districts (Musanze, Nyabihu and Rubavu) of Rwanda.
Study area
This study was carried out in the North-western region of Rwanda, specifically in Musanze, Nyabihu and Rubavu districts. Musanze District is located in Northern Province (1°30′6.94″S; 29°37′59.75″E at 1850 m above sea level) whereas Rubavu (1°40'52.54"S; 29°19'45.55"E and 1,830 m above sea level) and Nyabihu (1°39'9.90"S; 29°30'24.62"E and 2,437 m above sea level) districts are located in Western Province.
The average temperatures for Musanze, Rubavu and Nyabihu districts are 19.4, 18.1 and 15°C, respectively. The average annual rainfall is 1 100, 1 377 and 1 400 mm for Musanze, Rubavu and Nyabihu districts, respectively. Soil types in the region consist of volcanic, lateritic and humus-bearing and clayey soils (MINALOC, 2011). There are two wet seasons in the North-western region of Rwanda, the first being from February to May and the second from September to November. This region has 14 MCCs and has over 70% of the cheese processors in Rwanda. More than 91% of the human population in the North-western region of Rwanda is engaged in agriculture.
Sample size and sampling procedure
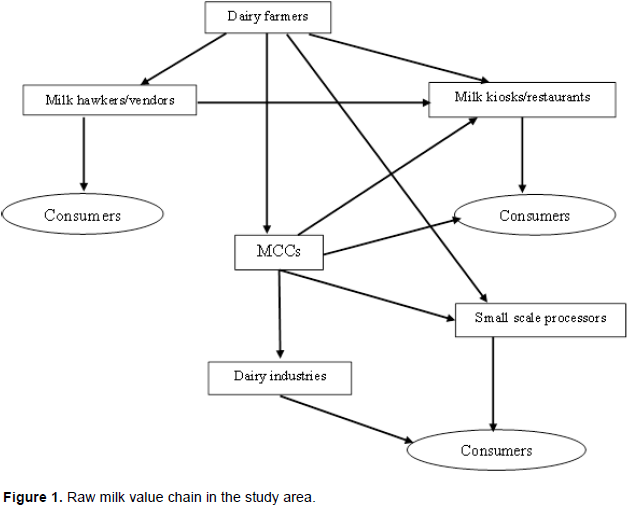
A multistage sampling method was used involving all entities of the milk value chain as applied in Rwanda. The sampling procedure was based on the schematic presentation of raw milk commodity in the value chain (Figure 1). A total of sixty-seven samples were collected from September 2016 to March 2017 at four different levels of the value chain. These were 36 dairy farmers (26 in Nyabihu, 10 in Musanze and ten in Rubavu district), 15 milk hawkers, 12 milk kiosks (four in Nyabihu, five in Musanze town and three in Rubavu town) and four MCCs (CEMO and CEZONYI in Nyabihu, CODERU in Rubavu and IWACU ZIRAKAMWA in Musanze).
A milk collection centre was defined as a place with milk quality testing equipment (alcoholmeter; lacto densimeter; thermometer; antibiotic residue test kit and mastitis test kit) and cooling facilities, where milk from different dairy farmers and milk transporters within the same location was gathered and cooled before sale. Milk kiosk/restaurant was defined as a safe/certified commercial place where milk was sold either as fresh-raw, skimmed or mixed with tea (African tea) (MINAGRI, 2016).
Milk sample collection and transportation
At the dairy farmer’s level, milk was sampled from the bulked milk containers prior to carrying it to the MCC. Additionally, designed questionnaires were sdministered to individual farmers to get more information regarding factors and milk handling practices that influenced milk quality at their farms. At the MCC level, milk was sampled from the bulk tank. At the hawker’s level, milk was sampled from milk containers at the selling point (public road, market, etc.) whereas at the kiosks/restaurants milk samples were collected from previously boiled and cooled milk, ready to be served. At each stage, 15 ml of milk was aseptically collected into sterile labelled tubes, kept on ice in cooler box (4°C) and then taken to the University of Rwanda, Busogo campus Microbiology Laboratory within 1-2 h, for further analysis. The analysis was performed immediately after reaching the laboratory.
Total bacterial count and bacteriological analysis
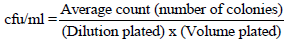
Total bacterial count was performed as described previously (Campbell et al., 2015). The standard plate count (SPC) agar (Oxoid-CM0325, UK) was cooled to 50°C before 15-20 ml was poured onto sterile Petri dishes and left to solidify. Then ten-fold dilutions of the milk samples were prepared, up to a dilution of 10-7, using sterile peptone water (Oxoid-CM0509, UK) and sterile test tubes; and mixing was done using an electronic vortex. A standard volume (1 ml) of milk sample was spread in duplicate onto the solid agar, prepared earlier; this was then incubated at 37°C for 48 h. Colony count was made using an electronic colony counter (Galaxy 230 Colony Counter, ROCKER SCIENTIFIC CO., LTD, New Taipei,Taiwan), focusing mainly on plates containing 30-300 colony forming units (Campbell et al., 2015). The bacterial concentration (colony forming units) in the respective original milk sample was then calculated using the formula given by Campbell et al. (2015).
For bacteriological analysis, milk samples were inoculated separately onto MacConkey agar and blood agar plates by streaking method. Inoculated plates were then incubated aerobically at 37°C for 24-48 h. After 24 h, primary bacteriological identification was made based on colony morphology, colour and haemolytic characteristics; after which pure cultures were prepared through subculturing and incubation. The purified isolates were then subjected to Gram staining and further biochemical testing as previously describe by Quinn et al. (2011). Staphylococci were identified based on catalase and tube coagulase tests. Streptococci were identified based on catalase production and the Christie, Atkins, and Munch-Peterson (CAMP) test as previously described by Quinn et al. (2011). Gram negative isolates were identified based on growth characteristics on MacConkey agar and reactions to oxidase test, catalase test, Triple sugar Iron (TSI) agar and the “IMViC” tests (Indole, Methyl-Red, Vogas Proskaur and Citrate utilization) (Quinn et al., 2011).
Statistical analysis
All data collected throughout the survey were encoded into Microsoft Excel, 2013 and analyzed using Statistical Package for Social Sciences (SPSS). Bacterial counts at different levels of the value chain were determined by comparing respective means using ANOVA. Total bacterial counts were subjected to Least Significance Difference (LSD), Levene’s test (Page et al., 2003), Welch test (Welch, 1951), and Games-Howell post-hoc test (Games and Howell, 1976)to determine homogeneity of variance and overall statistical significance. Association between farming/milk handling practices with milk grades was determined using Chi-square, while strength of association was determined using Cramer’s “V” test (Cramér, 1946). Distribution of microorganisms invading milk at different levels of the raw milk chain was performed using descriptive statistics.
Total bacterial counts
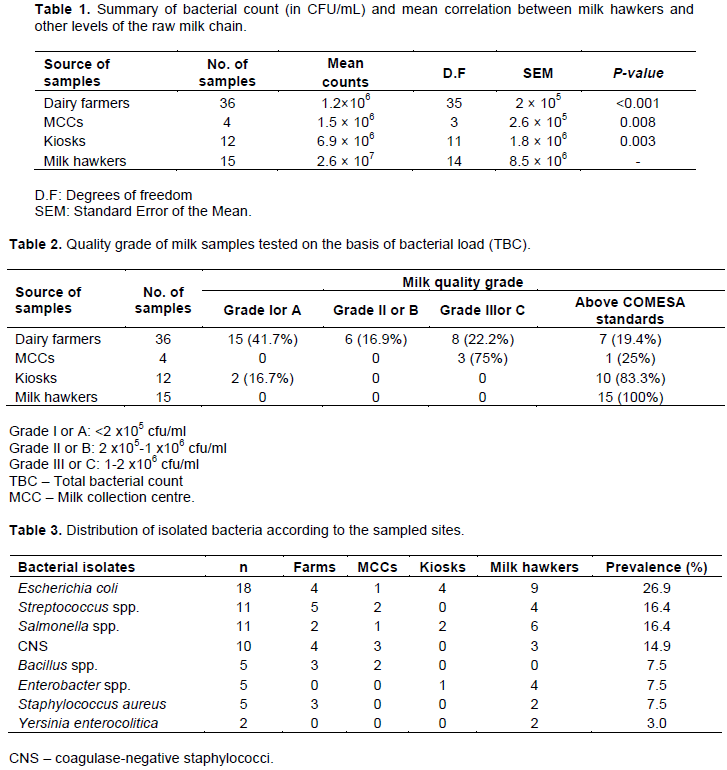
Total bacterial count (TBC) was interpreted according to COMESA milk grading standards. The mean TBC at dairy farmers’ level was 1.2 × 10⁶ CFU/ml (SE± 2 × 10⁵); at milk hawkers’ level, it was 2.6 × 10⁷ CFU/ml (SE± 8.5 × 10⁶); while at MCC’s and kiosks/restaurants’ levels, it was 1.5 × 10⁶ CFU/ml (SE± 2.6 × 10⁵) and 6.9 × 10⁶ CFU/ml (SE± 1.8 × 10⁶), respectively (Table 1). ANOVA tests showed that there was a significant difference (p <0.001) in the mean values among the four levels of the value chain considered. There was also significant difference in TBC mean values between milk hawkers, dairy farmers (p <0.001), MCC (p =0.008) and kiosks (p =0.003) (Table 1). Additional statistical analysis showed a significant difference between dairy farmers and kiosks (p =0.044). However, there was no significant difference observed between dairy farmers and MCC (p =0.975) and between MCC and kiosks (p =0.551).
Based on COMESA milk grades, it was found that all tested hawker’s milk (15/15; 100%) and 10/12 (83.3%) of the milk samples collected from kiosks were above the lowest COMESA grade (>2,000,000 CFU/ml) (Table 2). This study also showed that 3/4 (75%) of the milk samples collected from MCC were within COMESA Grade III/C (1 000 000-2 000 000 CFU/ml) whereas (15/36; 41.7%) of the milk samples from dairy farmers were within COMESA Grade I/A (<200 000 CFU/ml).
Isolated bacteria
Of the microorganisms which contaminated milk at different levels of the raw milk chain coliforms were the most predominant, at 34.4%. With respect to individual bacteria, E. coli was the most predominant isolate, followed by Salmonella spp., Streptococcus spp, coagulase-negative staphylococci, Enterobacter spp., Bacillus spp., S. aureus and Yersinia enterocolitica (Table 3).
Bacterial isolates were distributed across the market chain in such a way that high prevalence rates were recorded at milk hawkers for gram negative bacteria (Table 3). This predominance can be partially explained by the fact that milk hawkers store their milk at ambient temperatures for a long time before they reach their customers.
Factors associated with bacterial contamination along market chain
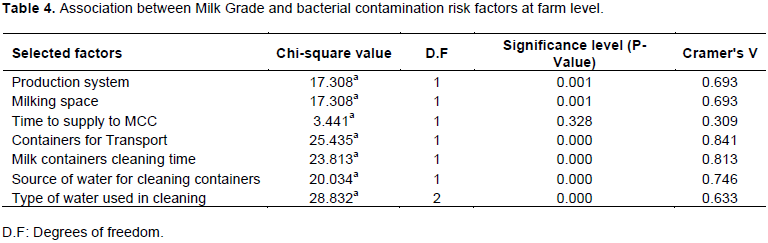
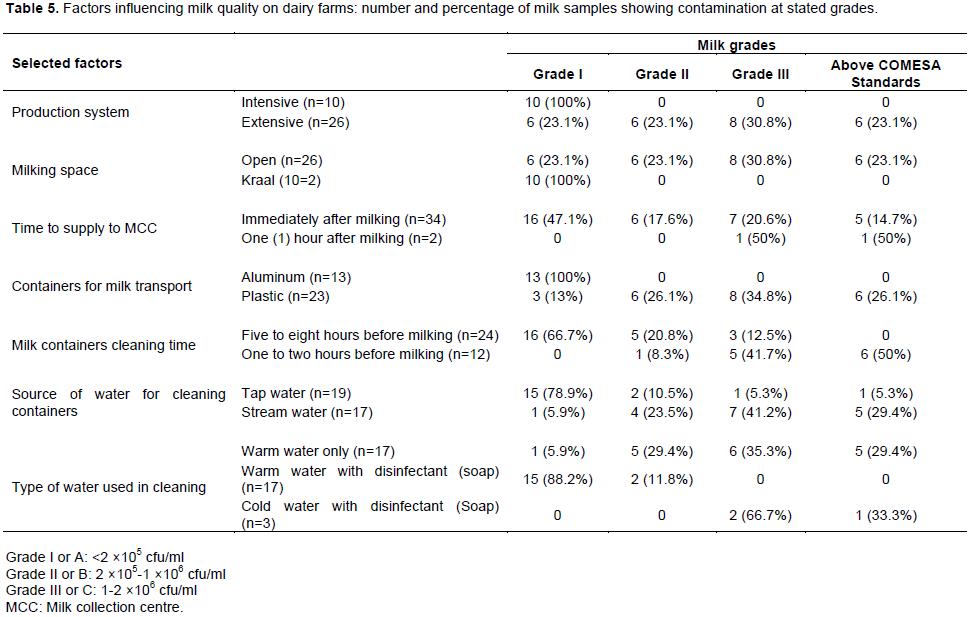
When statistically evaluated, it was revealed that bacterial contamination of milk was significantly and strongly associated with containers used for milk transport (p <0.0001), milk containers cleaning time (p <0.0001) and source of water used to clean containers (p <0.0001) (Table 4). Milk which was transported from farms to MCC in aluminum containers had lower TBC mean values than milk transported in plastic Jeri cans/containers; farmers who cleaned their utensils (milking and milk transport equipment) five to eight hours before milking delivered milk that had lower bacterial counts than those who cleaned one to two hours before milking, and farmers who used tap water to clean utensils had reduced bacterial contamination of their milk than those who used stream water; farmers who used warm water with disinfectant (soap) to clean utensils had milk with lower bacterial contamination (TBC mean values) than those who used cold water with disinfectant (soap). There was a correlation and moderate strength of association between bacterial contamination of milk and production system (p <0.001), milking space (p <0.001) and type of water used to clean utensils (p <0.001). Results indicated that there were lower TBC values in milk from cows kept under intensive system than from those kept in extensive system, milk from cows milked from Kraal showed lower TBC values than from those milked in open space. Although milk supplied to MCC immediately after milking had lower bacterial counts than that which was kept for more than one hour after milking; there was no statistical association between raw milk bacterial contamination and time taken to supply milk to the MCC (p >0.328) (Table 5).
The mean TBC values for the hawkers’ milk samples (15/15; 100%) and kiosks/restaurant’s samples (10/12; 83.3%) were above COMESA’s acceptable levels. This contamination at hawkers’ level is influenced by different factors, including: storage and transport in unclean milk containers, prolonged time for milk storage and uncontrolled temperature along transportation. In the study area, some farmers milked their cows in the morning hours and stored milk (for about 5 h) at ambient temperature. They then waited for milk hawkers who came to collect it for distribution to different customers like individual consumers, milk kiosks/restaurants. The hawkers also had tendency of selling milk in the afternoon hours on public roads or milk “markets”. Indeed, 80% of Rwanda’s milk market is designated as “informal” due to the fact that the milk coming from a majority of small-holder farmers does not enter the regulatory food chain (MINAGRI, 2013).
According to bacterial multiplication and growth curve, at ambient temperature, for example E. coli divides into two after every twenty minutes (Harding, 1995); this seems to be the most likely scenario at hawker’s level, where milk undergoes prolonged storage time at ambient temperature and E. coli isolates were found to be many. Furthermore, bacterial contamination was exacerbated when the milk was stored in unhygienic plastic containers, and when it was subjected to poor handling practises during distribution to different customers. This observation is in agreement with the results of Grimaud et al. (2007), when they analysed raw milk marketed through the informal subsector in Uganda. They reported that unhygienic conditions from the production source to the consumer combined with an improper milk storage were associated with increased bacterial contamination.
The findings of the current study corroborate with those obtained by Doyle et al. (2015), who recorded TBC mean values at kiosks of 9.8 × 10⁶ CFU/ml; they were slightly higher than 6.9 × 10⁶ CFU/ml obtained in the current study but also above COMESA’s acceptable level). Normally, in the study area, milk sold in kiosks/restaurants is obtained either directly from dairy farmers, or from MCC and/or milk hawkers. It is normally boiled before consumption; served either hot or cold, however it needs to be noted that, even though boiled before consumption, the milk still carry pathogenic bacteria which it can transmit to respective consumer(s); that is, contamination can occur after boiling. This possibility of contamination after boiling of the milk is also highlighted by other scientists (Kilango et al., 2012); this is influenced by contamination level of storage utensils, storing temperature and hygienic status of milk handlers. Kiosks/restaurants in the study area also served raw milk which was found to be of very poor quality. This could have been due to milk contamination at source, poor hygienic milk handling conditions after boiling, inadequate refrigeration and recontamination during milk storage and serving (consumption). Though the current study did not evaluate the impact /safety hazards of poor milk quality on human health on consumption, in the United States, Oliver et al. (2009)did so and showed that several documented milk-borne disease outbreaks which occurred within the years 2000-2008 were traced back to consumption of raw unpasteurized milk.
The TBC mean values of MCC’s and dairy farmer’s milk (1.5 x 10⁶ CFU/ml and 1.2 × 10⁶ CFU/ml, respectively) laid in grade III/C according to COMESA’s milk grades. Similar results were found by Doyle et al. (2015); they recorded MCC milk samples’ TBC mean values of 1.5 × 10⁶ CFU/ml. In this study, it was found that, once milk reached the MCC, it was directly tested via platform tests for organoleptic properties, added water and then cooled in cooling tanks at 4°C in compliance to a ministerial order (MINAGRI, 2016). The slight increase of the TBC mean values from dairy farmers to MCC, observed in this study, could have been caused by use of contaminated transportation containers and/or time the utensils were cleaned after supplying milk to a MCC.
These findings are supported by Grimaud et al. (2007)in Uganda (with similar milk handling and transport conditions); they demonstrated increase of bacterial load in milk during transportation.
The highest TBC mean values obtained at dairy farmer’s level was found to be associated with the investigated factors and milk handling practices used by farmers in the study area. These include source of water used to clean containers, milking space, production systems, milking hygiene and cleanliness of milk containers used during milking. This is in agreement with findings of (Banwart (1989); he concluded that poorly cleaned and sanitized milking utensils are the source of many microorganisms which transform high quality milk to an unacceptable product. The current findings also corroborate those of Grimaud et al. (2007), who during an evaluation of milk quality in Uganda, noted that milk contamination took place as early as at the farm level, the beginning of the value chain. They concluded that raw milk contamination along the value chain is associated with storage and milk handling conditions, especially during transportation from the primary production area to the urban market place.
In this study, coliforms (E. coli and Enterobacter spp.) were the most isolated bacteria from different levels of the raw milk chain, representing 34.4%. The results are in agreement with those of Garedew et al. (2012)who found E. coli (29.6%) to be the most isolated Gram-negative staining bacterial pathogen. Adams and Moss (2008)concluded that E. coli is the most prominent fecal coliform and that its presence indicates fecal contamination of raw milk and its products; which is in agreement with the findings of the current study. Mellenberger and Roth (2009)also stated that coliform bacteria are normal inhabitants of soil and the intestines of cows. They accumulate and multiply in manure, polluted water, dirt and contaminated bedding. Iraguha et al. (2015), from their study in eastern Rwanda, found that the predominance of coliform bacteria were largely of environmental origin, at farm level.
The predominance of coliforms found in the current study seems to be associated with milking practices such as unclean water use during milking and cleaning of milk utensils, poor milker’s hygiene, milking space and non-use of teat dips. The coliform contamination at other levels of the value chain (milk hawkers and kiosks) increased largely due to poor hygiene of milk handlers and poorly cleaned utensils used for milk transport. Salmonella organisms were found at 16.4% in the current study. These findings corroborate those found by Lubote et al. (2014)in Arusha, Tanzania; they reported prevalence of Salmonella organisms at 37.3% of all the bacterial isolates along the raw milk chain. This high prevalence is explained by factors such as poor animal husbandry and hygienic practices, inappropriate transportation and storage facilities, lack of cooling systems and use of unclean water. The presence of E. coli and Salmonella organisms is also an indication of fecal contamination by milk handlers as previously reported (Kamana et al., 2014).
The current results have also revealed high prevalence of coagulase-negative staphylococci (CNS), at 14.9%. Coagulase-negative staphylococci are commonly considered to be teat skin opportunists that normally reside on the teat skin (Radostits et al., 2007). So, they may contaminate milk during udder washing and milking, which also explains their association with poor milking hygienic practices and non-use of teat desinfectant(s) before milking. Other bacteria isolated in this study were: Streptococcus spp. at 16.4%, Bacillus spp. at 7.5 % and Staphylococcus aureus at 7.5%. These bacteria could originate from mastitic milk (O’Brien et al., 2009).
Although the current study did not go further to establish diseases associated with consumption of raw milk; De Buyser et al. (2001)did so when they explored the implication of milk and milk products in food-borne diseases in France and in different industrialized countries. They found that 37.5% of the food vehicles were from raw milk where Salmonella spp. were responsible for 29 outbreaks, L. monocytogenes for 10 outbreaks, pathogenic E. coli 11 outbreaks, and Staphylococcus aureus 10 outbreaks. Furthermore, Rohrbach et al. (1992)reported that 68 of 195 (34.9%) dairy producers in East Tennessee and Southwest Virginia consumed raw bulk-tank milk produced on their farm. Twenty-five percent (17 of 68) of the bulk-tank milk samples were shown to contain Listeria monocytogenes, Campylobacter jejuni, Y. enterocolitica and/or Salmonella (Rohrbach et al., 1992).
The high mean values of TBC that placed milk in the third grade at farm level (according to COMESA’s grading) was mainly due to poorly cleaned milk containers used by farmers during milking, the time milk containers were cleaned, poor hygiene practices of milkers, use of stream water to clean containers and udder, milking from open space, and use of cold water without disinfectant to clean utensils. The study also revealed that milk contamination took place as early as at the farm level-the beginning of the value chain; increasing along the rest of raw milk chain.
The authors have not declared any conflict of interests.
REFERENCES
|
Adams MR, Moss MO (2008). Food Microbiology.Third Edit. Cambridge CB4 0WF, UK: The Royal Society of Chemistry.
|
|
|
|
Addo KK, Mensah GI, Aning KG, Nartey N, Nipah GK, Bonsu C, Akyeh ML, Smits HL (2011). Microbiological quality and antibiotic residues in informally marketed raw cow milk within the coastal savannah zone of Ghana. Tropical Medicine and International Health 16(2):227-232.
Crossref
|
|
|
|
|
Alvarez VB (2009). Fluid Milk and Cream Products, In: Clark, S. (ed.) The Sensory Evaluation of Dairy Products. Columbus: Springer ScienceþBusiness Media, LLC pp. 73-133.
Crossref
|
|
|
|
|
Banwart GJ (1989). Basic food microbiology.Second Edi. New York: International Thomson Publishing.
Crossref
|
|
|
|
|
Bertu WJ, Dapar M, Gusi AM, Ngulukun SS, Leo S, Jwander LD (2010). Prevalence of brucella antibodies in marketed milk in Jos and environs. African Journal of Food Science 4(2):62-64.
|
|
|
|
|
Boor KJ, Brown DP, Murphy SC, Kozlowski SM, Bandler DK (1998). Microbiological and chemical quality of raw milk in New York State. Journal of dairy science. Elsevier 81(6):1743-1748.
Crossref
|
|
|
|
|
Campbell SG, Byersdorfer AL, Ludemann LR, Hyde RLW (2015). Standard Operating Policy/Procedure Standard Bacterial Plate Count. United States Department of Agriculture, Center for Veterinary Biologics. Ames, USA.
|
|
|
|
|
COMESA (2006). East African Standard: Raw cow milk - Specification.
View
|
|
|
|
|
Cramér H (1946). Mathematical Methods of Statistics., Princeton University Press. New Delh, India: Asia Publishing House.
Crossref
|
|
|
|
|
De Buyser ML, Dufour B, Maire M and Lafarge V (2001). Implication of milk and milk products in food-borne diseases in France and in different industrialised countries, International Journal of Food Microbiology 67:1-17.
Crossref
|
|
|
|
|
Doyle MM, Garcia S, Bahati E, Karamuzi D, Cullor JS (2015). Microbiological analysis of raw milk in Rwanda. African Journal of Food Science and Technology 6(5):141-143.
|
|
|
|
|
Food and Agriculture Organization (FAO) (2010). Status and Prospects for Smallholder Milk Production A Global Perspective. Edited by H. Torsten and J. Otte. Rome.
|
|
|
|
|
Farah Z, Mollet M, Younan M, Dahir R (2007). Camel dairy in Somalia: Limiting factors and development potential. Livestock Science 110(1-2):187-191.
Crossref
|
|
|
|
|
Games PA, Howell JF (1976). Pairwise Multiple Comparison Procedures with Unequal N's and/or Variances : A Monte Carlo Study. Journal of Educational Statistics 1(2):113-125.
Crossref
|
|
|
|
|
Garedew L, Berhanu A, Mengesha D, Tsegay G (2012). Identification of gram-negative bacteria from critical control points of raw and pasteurized cow milk consumed at Gondar town and its suburbs, Ethiopia. BMC public health 12(950):1-7.
Crossref
|
|
|
|
|
Goff HD, Kinsella JE, Jordan WK (1989). Influence of Various Milk Protein Isolates on Ice Cream Emulsion Stability. Journal of Dairy Science 72(2):385-397.
Crossref
|
|
|
|
|
Grimaud P, Sserunjogi ML, Grillet N (2007). An evaluation of milk quality in Uganda: value chain assessment and recommendations. African Journal of Food Agriculture, Nutrition and Development 7(5):1-15.
|
|
|
|
|
Harding F (1995). Hygienic Quality, in Milk Quality. First edit. SPRINGER-SCIENCE+BUSINESS MEDIA, B.V, 1689-1699.
Crossref
|
|
|
|
|
Iraguha B, Hamudikuwanda H, Mushonga B (2015). Bovine mastitis prevalence and associated risk factors in dairy cows in Nyagatare District, Rwanda. Journal of the South African Veterinary Association, 86(1):1-6.
Crossref
|
|
|
|
|
Jay JM (2000). Modern Food Microbiology.6th Editio. Gaithersburg, Maryland: Aspen Publishers, Inc.
Crossref
|
|
|
|
|
Kaiza KG (2011). Food safety in milk markets of smallholder farmers in Tanzania: a case of peri urban wards in Temeke Municipality. Sokoine University of Agriculture.
|
|
|
|
|
Kamana O, Ceuppens S, Jacxsens L, Kimonyo A, Uyttendaele M (2014). Microbiological Quality and Safety Assessment of the Rwandan Milk and Dairy Chain. Journal of Food Protection 77(2):299-307.
Crossref
|
|
|
|
|
Kilango K, Makita K, Kurwijila L, Grace D (2012). Boiled milk, food safety and the risk of exposure to milk borne pathogens in informal dairy markets in Tanzania, in The World dairy Summit Conference, 4-8th November 2012, Cape Town , South Africa. Cape Town, 15.
|
|
|
|
|
Lore T, Omore A, Staal S (2005). Types, levels and causes of post- harvest milk and dairy losses in sub-Saharan Africa and the Near East: Phase two synthesis report. Nairobi. Available at:
View
|
|
|
|
|
Lubote R, Shahada F, Matemu A (2014). Prevalence of Salmonella spp. and Escherichia coli in raw milk value chain in Arusha, Tanzania. American Journal of Research Communication 2(9):1-13.
|
|
|
|
|
Mellenberger R, Roth CJ (2009). California Mastitis Test (CMT) Fact Sheet, Department of Animal Sciences, Michigan State University and Department of Dairy Science, University of Wisconsin-Madison.
|
|
|
|
|
MINAGRI (2013). Rwanda National Dairy Strategy-Final Report. Kigali, Rwanda.
View
|
|
|
|
|
MINAGRI (2016). Ministerial Order regulating the collection, transportation and selling of milk. Rwanda.
View
|
|
|
|
|
MINALOC (2011). Province and District Websites, Government of Rwanda. Available at:
View (Accessed: 4 June 2017).
|
|
|
|
|
Mosalagae D, Pfukenyi DM, Matope G (2011). Milk producers' awareness of milk-borne zoonoses in selected smallholder and commercial dairy farms of Zimbabwe. Tropical Animal Health and Production 43(3):733-739.
Crossref
|
|
|
|
|
Ngasala JB, Nonga HE, Mtambo MMA (2015). Assessment of raw milk quality and stakeholders' awareness on milk-borne health risks in Arusha City and Meru District, Tanzania. Tropical Animal Health and Production 47(5):927-932.
Crossref
|
|
|
|
|
O'Brien B, Berry DP, Kelly P, Meaney WJ, O'Callaghan (2009). A study of the somatic cell count ( SCC ) of Irish milk from herd management and environmental perspectives. Moorepark Dairy Production Research Centre. Fermoy.
|
|
|
|
|
Oliver SP, Boor KJ, Murphy SC, Murinda SE (2009). Food safety hazards associated with consumption of raw milk. Foodborne Pathogens and Disease 6(7):793-806.
Crossref
|
|
|
|
|
Page MC, Braver SL, MacKinnon DP (2003). Levine's Guide to SPSS for Analysis of Variance. 2nd Editio. New Jersey: Lawrence Erlbaum Associates.
Crossref
|
|
|
|
|
Parekh TS, Subhash R (2008). Molecular and Bacteriological examination of milk from different milch animals with special reference to Coliforms. Current Research in Bacteriology 1(2):56-63.
Crossref
|
|
|
|
|
Pires SM, Evers EG, Pelt W, Van, Ayers T, Scallan E, Angulo FJ, Havelaar A, Hald T (2009). Attributing the Human Disease Burden of Foodborne Infections to Specific Sources. Foodborne pathogens and disease 6(4):417-424.
Crossref
|
|
|
|
|
Quinn PJ, Markey BK, Leonard FC, Fitzpatrick ES, Fanning S, Hartigan PJ (2011). Veterinary Microbiology and Microbial Disease. Blackwell Science Ltd ©.
|
|
|
|
|
Radostits OM, Gay CC, Hinchcliff KW, Constable PD (2007). Veterinary Medicine: A Textbook of the Diseases of Cattle, Horses, Sheep, Pigs and Goats.10th Ed. Spain: Saunders, Elsevier.
|
|
|
|
|
Rohrbach BW, Draughon FA, Davidson PM, Oliver SP (1992). Prevalence of Listeria monocytogenes, Campylobacter jejuni, Yersinia enterocoiitica and Salmonella in Bulk Tank Milk: Risk Factors and Risk of Human Exposure. Journal of Food Protection 55(2):93-97.
Crossref
|
|
|
|
|
Welch BL (1951). On the Comparison of Several Mean Values: An Alternative Approach. Biometrika 330.
Crossref
|
|