ABSTRACT
Water quality was assessed from 11 hand dug wells in the Adentan Municipality using Water Quality Index (WQI) and bacteriological load as indicators. The sampling was conducted during the months of July to September, 2019. A total of 33 samples were taken from 11 hand dug wells at monthly intervals. Weighted Average Water Quality Index (WAWQI) was used to compute parameters which include temperature, pH, conductivity, total dissolved solids, turbidity, total solids, biological oxygen demand, salinity and total alkalinity. Indicator fecal coliforms were also enumerated. All samples showed presence of E. coli and Salmonella in the dug wells with AD2 having the highest E. coli count of 1.32x10³cfu/100 ml. AD11 had the least count of both E. coli and Salmonella (1.28x10² cfu/100 ml and 1.68x101 cfu/100 ml) respectively. The highest WQI value was recorded for AD7 and the lowest was recorded for AD9. 36.4% of the wells were graded as “A” whilst the remaining 63.6% were graded “B”. The combined results of WQI and bacteriological assessment shown that the water quality determined only by WQI (physico-chemical) parameters cannot reflect the true water quality status.
Key words: Water quality index, bacteriology, weighted average water quality index, indicator.
Water for domestic activities should be potable to guarantee good public health using water-quality index and bacteriological assessment as effective tools for assessment allowing for reporting of information of the quality of the water to citizens and policy makers (Atulegwu and Njoku, 2004). Ground water is generally considered ‘safe’ and requires no treatment due to the natural filtering action (Abila et al., 2012), however, it is susceptible to contamination from sanitary hazards and fecal matter in close proximity to the wells (Adelana and MacDonald, 2008). It is estimated that about 100 million people in rural areas in Sub Saharan Africa rely on ground water for domestic purposes. A report by the Ghana Water Company (GWCL, 2019) indicated that 20% of urban communities are without access to public water services and depend on other sources like ground water for survival. UN figures on Sustainable Development Goal 6 reveal that millions die yearly from diseases connected to insufficient supply and quality of water.
The rapid increase in water demand has placed a great stress on available water resources through both poor waste management and over exploitation (Ramakrishnaiah et al., 2011). As a result, groundwater quality is deteriorating due to among others disposal of massive industrial effluents and mining activities, as reported for different parts of India (Rodell et al., 2009; MacDonald et al., 2015). The quality of water from shallow aquifers is easily compromised when sited close to septic systems in homes and communities (Lutterodt et al., 2018). This is more prevalent in peri-urban areas of Sub Saharan Africa where septic systems are rife (Lapworth et al., 2017). Improving the water supply remains a challenge and many countries have implemented water quality protection measures and monitoring regimens (Astel et al., 2006; Behmel et al., 2016; Romero 2016) including multivariate statistical methods (Singh et al., 2005), modeling techniques (Huang et al., 2016), and methods based on multi-metric indices (Wu et al., 2012).
The Adenta Municipality in Ghana has had a water crisis for many years as a result of a malfunctioning water treatment plant. In 2014, the Kpone water treatment plant was expanded to a capacity of 40 million gallons per day (GWCL, 2014) allowing the Adenta community to have access to quality water. However, some localities like in New Adenta are not connected to the Ghana Water Company Limited (GWCL). Many households in New Adenta have resorted to hand dug wells as a source of water.
Visual inspection of these wells show sub-standard construction, proximity to contaminant sources like septic tanks, toilets and others, raising doubts about the quality of the water. The World Health organization (WHO, 2004) recommends that, shallow wells and boreholes ought to be situated at minimum distance of 30 and 17 m from latrines and septic tanks respectively (WHO, 2004; Chukwurah, 2001). This is not the case with dug wells of New Adenta closer than the 17 m distance recommended, coupled with the low water table of the dug wells.
Statistics from the Adentan Municipal Health Directorate on Water Borne Diseases show high incidence of Typhoid fever and Diarrheal cases. Frequency of typhoid fever increased from 4793 cases in 2016 to 7147 reported cases in 2018 representing 49.1% increase over a two-year period. Within that same period diarrhoeal cases increased from 2290 to 3176 representing a 38.7% increase. The suitability of water from hand dug wells have not been analyzed for either bacteriological or physicochemical quality together with the water quality index in the Adenta municipality. The aim of this study was to assess the quality of some hand dug wells of the Adentan Municipality using both the water quality index and bacteriological load as a novel way to determine water quality for our municipality.
Study area
Adentan municipality is located on latitude 5′ 43′′N and longitude 0′ 09′′W, and is 10 km to the North-East of Accra, Ghana. The total land area of the municipality is 123 km2 and is bound by Kpong Katamanso to the North, Ledzokuku Krowor and Accra Metro to the South, Tema Metro to the East and La Nkwantanang Madina to the West. The municipality is divided into four sub-districts; Gbentenaa, Koose, Nii Ashale Botwe and Sutsurunaa.
Sampling and analysis
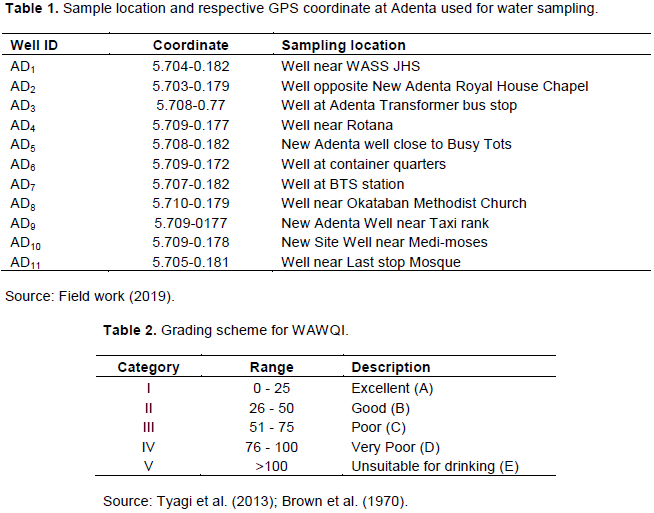
Sampling was based on the sanitary inspections that were conducted during the months of July to September, 2019 from 11 different sampling locations around the Adentan Municipality. The risk assessment was based on five factors: relative position of septic systems (whether downhill or uphill), closeness to septic tanks, protection mechanisms and appropriate receptacles for fetching water. A risk matrix with appropriate colour coding (not shown) was used to rank the wells based on these risk factors. Preferences were given to wells available for communal use and for drinking purposes. A total of 33 samples were taken from 11 hand dug wells (triplicate from each well) at monthly intervals and coded as follows AD1, AD2, AD3, AD4, AD5, AD6, AD7, AD8, AD9, AD10, and AD11 (Table 1) and analyzed within 24 h.
All chemicals and reagents were of analytical grade. Samples were collected in 500 ml polythene bottles having double stopper. Prior to the collection, the clean sample bottles were rinsed thoroughly with the sample water to be collected. The physical and chemical parameters analyzed included temperature, pH, TSS, TDS, conductivity, salinity, turbidity, DO, BOD and total alkalinity. Total coliforms, Fecal coliforms, E. coli and Salmonella present in the samples were enumerated using lactose and lauryl tryptose broths for fecal coliforms and E. coli, while pre-enrichment broth selenite cystine was used for Salmonella.
Water quality index
The Overall WQI (OWQI) for surface water and groundwater for drinking purposes was developed by Singh et al. (2015) and Stigter et al. (2006). The present study used the Weighted Average Water Quality Index (WAWQI) for ten water quality parameters to compute WQI. The parameters are temperature, pH, conductivity, total dissolved solids, turbidity, total solids, biological oxygen demand, salinity and total alkalinity. The water quality index was calculated using quality rating scale and assigning weight values to the selected parameters (Dinius, 1987). The following weighted average aggregation functions were employed for this purpose: Where Wi = weight of the ith variable and Qi is the quality score rating. These scores are further converted to a common scale based on their relative importance to impact the quality of water. These sub-indices functions are developed based on the water quality standards and their concentrations to meet in particular range. For this purpose, mathematical expressions were fitted for each parameter to obtain the sub-index equations (WAWQI =∑QiWi/∑Wi). Based on the status of water quality data, the index value ranges from 0 to 100 and is classified into five categories: excellent (0-25), good (26-50), poor (51-75) very poor (76-100) and unsuitable for drinking (>100). The status of water corresponding to different WQI values is presented in Table 2. If the index is high, it indicates that some of the water quality parameters are beyond permissible ranges and suitable measures are needed to improve the quality of water.
Sanitary inspection and risk assessment
A standardized inspection checklist originally developed by British Geological survey and previously used by Lutterodt et al. (2018) was adapted for risk inspection and assessment. Results of Sanitary inspection and Risk assessment of the 11 dug wells showed that AD9 and AD10 were found to have risk of extreme contaminations, AD4 and AD8 moderate contaminations, AD1 and AD3 high contaminations and the remaining five wells (AD2, AD5, AD6, AD7, AD11) had very high contaminations.
Bacteriological analysis
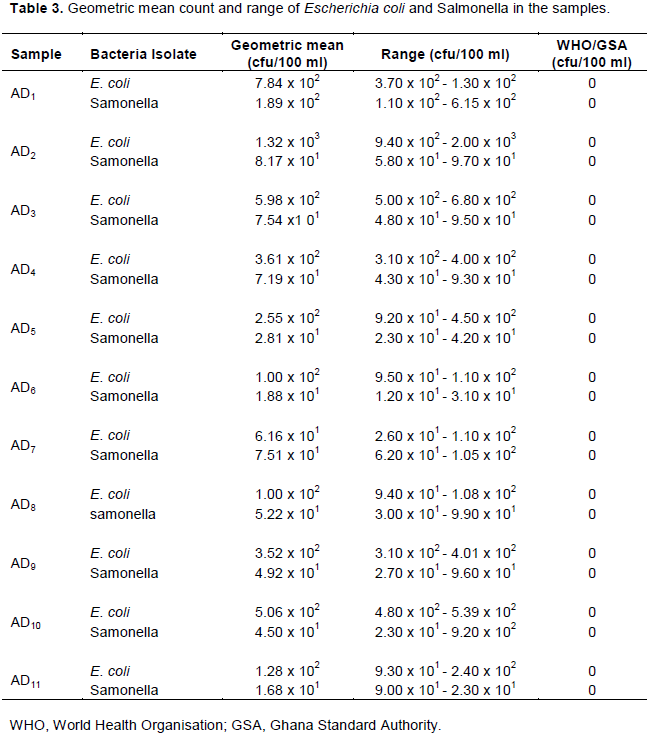
Table 3 shows the mean count and the range of E. coli and Salmonella count in the dug wells. The highest E. coli count was 1.32x10³ cfu/100 ml in well AD2 whilst the least count was recorded in AD11 with a count of 1.28x10² cfu/100 ml. Similarly, the highest and the least count of Salmonella were 1.89x10² cfu/100 ml and 1.68x101 cfu/100 ml for wells AD1 and AD11 respectively. The E. coli counts in all the dug wells were consistently higher than the Salmonella count. The results indicate non-conformity with the WHO (WHO, 2011) and GSA (GSA, 2009) guidelines of 0 CFU/100 ml.
Physico-chemical analysis
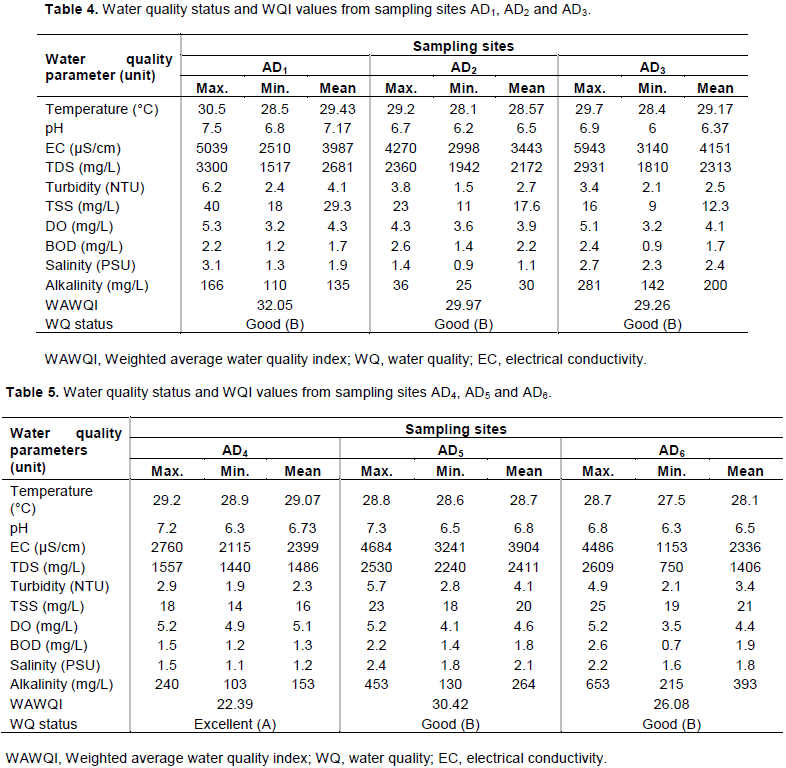
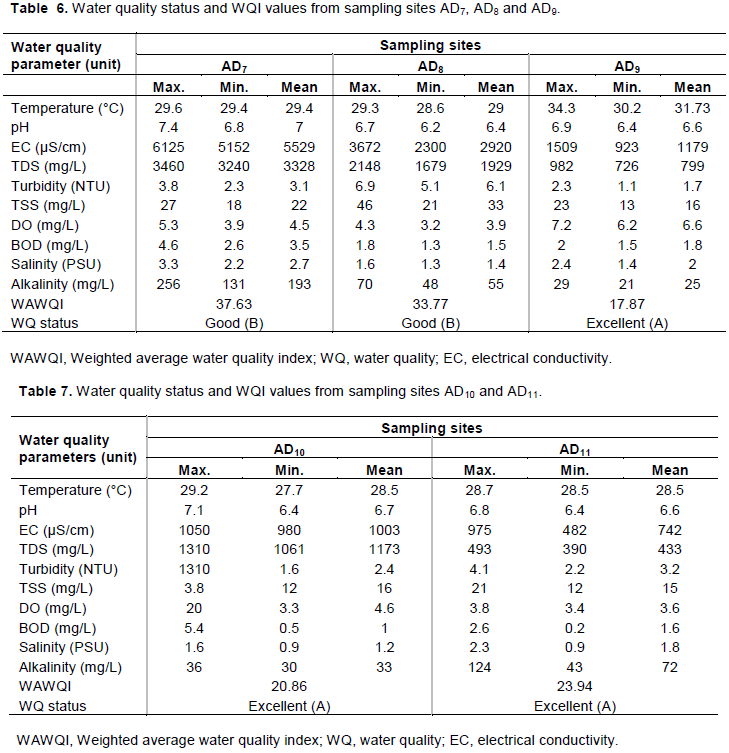
The temperatures recorded for the dug wells were within the range of 28.1±0.6 to 31.7±2.2°C. The maximum temperature was recorded at AD9 with AD6 recording the minimum. The pH values were within the range of 6.4±0.5 to 7.1±0.3 with AD1 recording the maximum. Conductivity and Total Dissolved Solids (TDS) were within the range of 742±247.6 uS/cm to 5529±521.7 uS/cm and 433±53.5 mg/l to 3328.6±116.0 mg/l respectively (Tables 4 to 7). AD7 and AD11 in both cases recorded the maximum and minimum values respectively. The turbidity recorded for the wells were 2.333±0.5NTU to 6.1±0.9 NTU with AD8 and AD9 recording the maximum and minimum respectively. The TSS values range between 12.3±3.5 to 29.3±11.0. The maximum total suspended solids (TSS) was recorded at well AD9 whilst the minimum TSS was recorded at the Well at AD3. The Dissolved Oxygen (DO) recorded for the dug wells were within the range of 3.6±0.2 to 6.6±0.5 with AD9 and AD11 recording maximum and minimum values respectively. AD7 recorded the highest Biological Oxygen Demand (BOD) of 1.0±0.5 (Tables 4 to 7). The salinity recorded for the dug wells were within the range of 1.1±0.2 to 2.7±0.5. The maximum salinity was recorded at AD1 whilst the minimum salinity was recorded at the Well at AD3. Total alkalinity recorded for the dug wells were within the range of 25.6±4.1 to 393.3±230.0. The maximum alkalinity was recorded at well at AD6 whilst the minimum alkalinity was recorded at AD9.
Water quality index
The computed WQI for the eleven 11 dug wells are summarized in Tables 4 to 7. The WQI values of the wells were in the range from 17.87 to 37.64. With respect to the WAWQI grading, the smaller the WQI value, the better the grading of water. The highest WQI value was recorded at AD7 whilst the least WQI value was recorded at AD9. 36.4% of the wells could be graded as “A” whilst the remaining 63.6% falls within the “B” grade (Tables 4 to 7). None of the samples were of poor, very poor or not suitable for drinking grade.
The risk ranking and the score assigned to each of the dug wells did not correlate with actual contamination levels in the samples (Oluwasanya, 2013). For instance, wells AD9 and AD10 which were ranked as having potential for extreme contamination had lower E. coli count compared to AD1 and AD3. This lack of correlation was also observed with Salmonella counts and may be due to lack of protective systems in the construction of the wells or failure to adhere to standard practices (Nkansah et al., 2010a). Lutterodt et al. (2018) also reported incoherence of risk score to correlate with actual contamination levels in dug well and boreholes at Dodowa in Ghana.
Physico-chemical properties
Many of the dug wells had temperatures slightly higher than the recommended range of 22 to 29 (WHO, 2011). The relatively high temperatures recorded may be due to major ions from water/rock interaction from dissolved amounts of carbonates like calcite or sulphides like pyrite, as both dissolution reactions are highly exothermic (Corbella and Ayora, 2003). Nkansah et al. (2010b) attributes high water temperature to either microbial activity or depth at which water is sampled since worm tends to float in stratified waters.
The positive correlation of temperature with DO (r=0.8), weak positive correlation with Salinity (r=0.3) and a weak negative correlation with electrical conductivity (r=-0.1) may be due to the fact that temperature affects chemical parameters like dissolved oxygen, electrical conductivity and salinity (Chapman, 1996). Yang et al. (2007) reports
that climatic conditions and chemical, biological, and microbial processes are effective in determining oxygen variation in water. Except wells AD3 and AD8 which were mildly acidic (6.36 and 6.43 respectively), the compliance level of pH was very high (82%). Addo et al. (2016) reported that acidic geology of an area may contribute significantly to the lower pH, below the permissible limit, as observed in the study. Chapman (1996) reported the formation of weak carbonic acid which dissolves carbon dioxide to react with H2O to release hydrogen ions (H+) to lower the pH of the water.
There was a 73% non-compliance in terms of the measured conductivity which present a health threat to consumers as a result of the very high amount of dissolved salts in the water samples. The linear relationship between conductivity and TDS of all the samples (r=0.97) may be attributed to the direct proportionality between conductivity and TDS. The turbidity and TSS recorded in this study were all within the recommended range of WHO (2011) for drinking water. Compliance was 91 and 100% for all the analyzed water samples, respectively. This is supported by Amoako et al. (2011) who reported similar values of TSS for ground water samples. All the samples recorded a 0% BOD compliance level as recommended by World Health Organization (WHO, 2011) and thereby rendering them unsafe for consumers without prior treatment. There was a weak negative correlation with BOD (r=-0.03). There was a 100% salinity compliance rate for all the water samples as the recorded values were below the recommended threshold of less than 200 mg/l. Similarly, the compliance rate of total alkalinity was 100% as they all fell below the WHO recommended value of less than 500 mg/l.
Bacteriological indicators
The results of the bacteriological analysis revealed that all the 11 samples recorded E. coli and Salmonella spp. counts which exceed the WHO standard limit for drinking water which is 0 cfu/100 ml. This represents 0% compliance and is a public health concern in this municipality. Tekpor et al. (2017) reported similar findings of high levels of bacteriological contamination of dug wells at Atebubu in Ghana whilst Akple et al. (2011) stated that location of dug wells and unsanitary features poses greater influence on contamination levels compared with the WHO standard. This may be due to the sitting of dug wells in proximity to septic systems and unsanitary conditions which might have rendered the wells susceptible to microbial contamination. Cairncross and Cliff (1987) indicated that soakage pits and pit latrines can extend their influence on ground-water quality up to 10 m or more as groundwater flow is either lateral or vertical. Even though the presence of coliforms is a source of worry, Binnie et al. (2002) and Griffith et al. (2003) reported that coliform bacteria are widely found in nature and do not necessarily indicate fecal pollution.
Water quality index
According to the computed WQI, the overall water quality status in the Adentan municipality was “excellent” for AD4, AD9, AD10 and AD11 whilst the rest (63.6%) were of “good” threshold. These results which were within the range of 17.8 to 37.6 indicated that the water quality in the municipality meet the WAWQI standard for drinking water even though E. coli and Salmonella spp. were found in the water. Sener et al. (2017) and Bordalo et al. (2006) have all reported that even though single-factor methods (for example the major parameter that influence water quality) provide valuable information, multiple parameters can benefit water quality evaluation, and such methods have been increasingly adopted in various studies. Evtimova and Donohue (2016) recently showed that water level is an important parameter regulating the structure and function of natural lake ecosystems. This may be one of the reasons why all the samples recorded either excellent or good water quality status.
Eleven different parameters were used to assess the suitability of hand dug wells for drinking purposes in the Adentan municipality in Ghana. Even though the computed WQI shows that 36.4 and 63.6% of water sample were of excellent or good water category, there was bacterial contamination in all the samples. The combined result of WQI and bacteriological assessment show that, water quality determined only by physico-chemical parameters cannot reflect the true water quality status. Therefore, to improve the water quality in the municipality, local management agencies should pay attention to the bacteriological quality of the water samples.
The authors have not declared any conflict of interests.
The authors are very thankful to the Technicians at the Microbiology Laboratory at the Water Research Institute, Accra, Ghana for facilitating the laboratory work.
REFERENCES
|
Abila R, Mutemi M, Mutuku E, Mutati K, Munguti M, Musyoka CM (2012). Physico-chemical and bacteriological quality assessment of shallow wells in Kitui town, Kenya. Journal of Environmental Science and Water Resources 1(2):27-33
|
|
|
|
Adelana S, Mcdonald AM (2008). Applied groundwater studies in Africa. London, UK: CRC Press, Taylor and Francis Group.
Crossref
|
|
|
|
|
Addo MG, Terlabie JL, Larbie JA (2016). An investigation of bacteriological, physicochemical and heavy metal quality of treated water supplied from the Barekese Dam to the Kumasi metropolis, Ghana. International Journal of Bio-Science and Bio-Technology 8(2):207-216.
Crossref
|
|
|
|
|
Akple MA, Keraita B, Konradsen F, Agbenowu E (2011). Microbiological quality of water from hand-dug wells used for domestic purposes in urban communities in Kumasi, Ghana. Urban Water Journal 8(1):57-64.
Crossref
|
|
|
|
|
Amoako J, Karikari AY, Ansa-Asare OD (2011). Physico-chemical quality of boreholes in Densu Basin of Ghana. Applied Water Science 1:4148.
Crossref
|
|
|
|
|
Astel A, Biziuk M, Przyjazny A, Namiesnik J (2006). Chemometrics in monitoring spatial and temporal variations in drinking water quality. Water Resource 40:1706-1716.
Crossref
|
|
|
|
|
Atulegwu P, Njoku J (2004). The impact of biocides on the water quality. International Journal of Environmental Science Technology 1:47-52.
|
|
|
|
|
Behmel S, Damour M, Ludwig R, Rodriguez MJ (2016). Water quality monitoring strategies - A review and future perspectives. Science of the Total Environment 571:1312-1329.
Crossref
|
|
|
|
|
Binnie C, Kimber M, Smethurst G (2002). Basic water treatment. Royal Society of Chemistry, Cambridge. UK.
|
|
|
|
|
Bordalo AA, Teixeira R, Wiebe WJ (2006). A water quality index applied to an international shared river basin: The case of the Douro River. Journal of Environmental Management 38:910-920.
Crossref
|
|
|
|
|
Brown RM, McClelland NI, Deininger RA, Tozer RG (1970). Water quality index-do we dare? Water Sewage Works 117(10):339-343.
|
|
|
|
|
Cairncross S, Cliff JL (1987). Water use and health in Mireda, Mozambique. Transactions of the Royal Society of Tropical Medicine Hygiene 81:51-54.
Crossref
|
|
|
|
|
Chapman DV (1996). Water Quality Assessments - A Guide to Use of Biota, Sediments and Water in Environmental Monitoring - Second Edition University Press, Cambridge ISBN 0 419 21590 5 (HB) 0 419 21600 6 (PB)
|
|
|
|
|
Chukwurah EI (2001). Aquatic Microbiology. Otoba Press Limited, Onitsha, Nigeria.
|
|
|
|
|
Corbella M, Ayora C (2003). Role of fluid mixing in deep dissolution of carbonates. Geologica Acta 1(4):305-313.
|
|
|
|
|
Dinius SH (1987). Design of an index of water quality. Water Resources Bulletin 23(5):833-843.
Crossref
|
|
|
|
|
Evtimova VV, Donohue I (2016). Water-level fluctuations regulate the structure and functioning of natural lakes. Freshwater Biology 61:251-264.
Crossref
|
|
|
|
|
Griffith JF, Weisberg BS, McGee DC (2003). Evaluation of microbial source tracking methods using mixed fecal sources in aqueous test samples. Journal of Water Health 1:141-151.
Crossref
|
|
|
|
|
GSA-Ghana Standards Authority (2009). Limits for Drinking water (GS 175-1:2009/3rd Edition).
|
|
|
|
|
GWCL (2019) Ghana Water sets new targets by the year 2025'. Available at:
View
|
|
|
|
|
GWCL (2014). Kpone Water Supply Expansion Project. Available at:
View
|
|
|
|
|
Huang JC, Gao JF, Zhang YJ (2016). Eutrophication Prediction Using a Markov Chain Model: Application to Lakes in the Yangtze River Basin, China. Environmental Modeling and Assessment 21:233-246.
Crossref
|
|
|
|
|
Lapworth DJ, Nkhuwa DCW, Okotto-Okotto J, Pedley S, Stuart ME, Tijani MN, Wright J (2017). Urban groundwater quality in sub-Saharan Africa: Current status and implications for water security and public health. Hydrology and Earth System Sciences 25:1093-1116.
Crossref
|
|
|
|
|
Lutterodt G, van de Vossenberg J, Hoiting Y, Kamara A. Oduro-Kwarteng S, Foppen JWA (2018). Microbial Groundwater Quality Status of Hand-Dug Wells and Boreholes in the Dodowa Area of Ghana. International Journal of Environmental Research and Public Health 15(4):730.
Crossref
|
|
|
|
|
MacDonald AM, Bonsor HC, Taylor R, Shamsudduha M, Burgess WG, Ahmed KM, Mukherjee A, Zahid A, Lapworth D, Gopal K, Rao MS, Moench M, Bricker S, Yadav SK, Satyal Y, Smith L, Dixit A, Bell R, van Steenbergen F, Basharat M, Gohar MS, Tucker J, Calow RS, Maurice L (2015). Groundwater resources in the Indo-Gangetic basin resilience to climate change and abstraction. British Geological Survey Open Report 63.
|
|
|
|
|
Nkansah MA, Boadi NO, Badu M (2010a). Assessment of the Quality of Water from Hand-Dug Wells in Ghana. Journal of Environmental Health Insights 4:7-12.
Crossref
|
|
|
|
|
Nkansah MA, Ofosuah J, Boakye S (2010b). Quality of Groundwater in the Kwahu West District of Ghana. American Journal of Scientific and Industrial Research 1(3):578-584.
Crossref
|
|
|
|
|
Oluwasanya G (2013). Qualitative risk assessment of self-supply hand-dug wells in Abeokuta, Nigeria: A water safety plan approach. Waterlines 32(1):36-49.
Crossref
|
|
|
|
|
Ramakrishnaiah CR, Sadashivaiah C, Ranganna G (2011). Tumkur District : Census 2011 data. E-Journal of Chemistry 6:523-530.
Crossref
|
|
|
|
|
Rodell M, Velicogna I, Famiglietti JS (2009). Satellite-based estimates of groundwater depletion in India. Nature 460:999-1002.
Crossref
|
|
|
|
|
Romero E (2016). Long-term water quality in the lower Seine: Lessons learned over 4 decades of monitoring. Environmental Science Policy 58:141-154.
Crossref
|
|
|
|
|
Sener S, Sener E, Davraz A (2017). Evaluation of water quality using water quality index (WQI) method and GIS in Aksu River (SWTurkey). Science of the Total Environment 131-144.
Crossref
|
|
|
|
|
Singh RP, Krishan G, Takshi KS (2015). Water level fluctuation as the sum of environmental and anthropogenic activities in southeast, Punjab (India). Journal of Environmental and Analytical Toxicology 5:298.
Crossref
|
|
|
|
|
Singh KP, Malik A, Sinha S (2005). Water quality assessment and apportionment of pollution sources of Gomti River (India) using multivariate statistical techniques - A case study. Analytica Chimica Acta 538:355-374.
Crossref
|
|
|
|
|
Stigter TY, Ribeiro L, Dill AMMC (2006). Application of groundwater quality index as an assessment and communication tool in agro-environmental policies - Two Portuguese case studies. Journal of Hydrology 327:578-591.
Crossref
|
|
|
|
|
Tekpor M, Akrong MO, Asmah MH, Banu RA, Ansa EDO (2017). Bacteriological quality of drinking water in the Atebubu-Amantin District of the Brong-Ahafo Region of Ghana. Applied Water Science 7:2571-2576 .
Crossref
|
|
|
|
|
Tyagi S, Bhavtosh S, Prashant S, Rajendra D (2013). Water Quality Assessment in Terms of Water Quality Index' American Journal of Water Resources 1(3):34-38.
|
|
|
|
|
WHO (World Health Organization) (2011). Water and sanitation. Guidelines for drinking-water quality.
View
|
|
|
|
|
WHO (2004). World Health Organization. Guidelines for drinking-water quality: recommendations (Vol. 1). World Health Organization: 2004.
|
|
|
|
|
Wu NC, Schmalz B, Fohrer N (2012). Development and testing of a phytoplankton index of biotic integrity (P-IBI) for a German lowland river. Ecological Indicators 13:158-167.
Crossref
|
|
|
|
|
Yang HJ, Shen ZM, Zhang JP (2007). Water quality characteristics along the course of the Huangpu River (China). Journal of Environmental Science 19:1193-1198.
Crossref
|
|