Quantum dots (QDs) are 1-10 nm semiconductor nanoparticles that possess size-dependent luminescence, the QDs usually refer to the II−VI, III−V and IV−VI binary and their alloyed semiconductor materials with a confined size in three dimensions (Kumar et al., 2007). The QDs have attracted tremendous attention from materials scientists, physicists, chemists and biologists worldwide due to a number of distinguished characteristics, including prominent optical performance with good photo-stability (Dubertret et al., 2002; Wu et al., 2003; Medintz et al., 2005), high quantum yield (QY) and long fluorescence lifetime (Medintz et al., 2005). Also included are simultaneous excitation of multiple QDs by a single light source (Han et al., 2001), narrow, symmetrical and size-tunable emission spectra coupled with wide absorption spectra (Chan et al., 2002) and broad spectral windows spanning from the ultraviolet to infrared region (Medintz et al., 2005).
One of the QDs, cadmium selenide (CdSe), attracts awareness because it is beneficial for light emitting diodes, solar cells and biological imaging (Bera et al., 2010). Previously, CdSe QDs were produced, using organometallic chemical techniques (Danek et al., 1994; Alivisatos, 1996). Furthermore, numerous efforts have been initiated to investigate new capping structures such as dodecyl amine and stearic acid for CdSe (Hines and Guyot-Sionnest, 1996; Peng et al., 2000; Peng and Peng, 2001). Notably, some bacteria exhibit a strong reducing capability toward the semiconductor precursors (Malarkodi et al., 2014). The revelation of natural metal-related bio-detoxification, bio-mineralization and enzymatic reactions really facilitates the understanding of QDs formation mechanisms in biological systems (Dameron and Winge, 1990; Crookes-Goodson et al., 2008; Saa et al., 2010). Fusarium oxysporum in a mixture of CdCl2 and SeCl4 synthesized CdSe nanoparticles (9-15 nm) (Kumar et al., 2007). Also, CdSe QDs were synthesized using Saccharomyces cerevisiae, which is widely used as a model organism and an ideal candidate biosynthesizer for fluorescent semiconductor CdSe QDs (Cui et al., 2009). In addition, Pearce et al. (2008) synthesized CdSe QDs by adding CdCl2O8 to selenide produced from selenite by Veillonella atypica, which is an anaerobic bacterium. In two latter studies (Pearce et al., 2008; Cui et al., 2009), cadmium was added after microbial formation of selenide for CdSe production in two-vessel processes, likely for the Cd toxicity to the microbes. In contrast, Kumar et al. (2007) showed a one-vessel process in which the fungus produces CdSe in the co-presence of selenite and cadmium ion, which might boost economic efficiency through its simple operation of fewer reaction vessels and culturing without microbial contamination. Similarity, Ayano et al. (2014) isolated Pseudomonas aeruginosa strain RB from a soil sample, which has capacities of both selenite reduction and cadmium resistance. This bacterium can synthesize 10-20 nm CdSe particles inside and outside the cells from selenite and Cd ion by a one-vessel reaction particle larger than 100 nm were noticed outside the cells. The value of the atomic Se/Cd ratio of the produced particles was 1.0, which was the ideal value (Ayano et al., 2014). The CdSe produce would compete with the CdS synthesis under alkaline state, resulting in high S contents and low Se/Cd ratios compared with other conditions (Ayano et al., 2015). Actually, CdSe is known to appear reddish brown (Kumar et al., 2007), whereas SeNPs and CdS show intense red (Ayano et al., 2014) and bright yellow (Ahmad et al., 2002), respectively.
QDs have interest in many industrial research applications such as transistors, computing, photovoltaic devices, photodetector devices, photo-catalysts, LEDs, diode lasers and second-harmonic generation because of the high tenability of properties (Ramirez et al., 2015). To benefit from the interdisciplinary research among nanotechnology, chemical processing, biotechnology and systems engineering tremendous progress has been made in the biomedical applications of QDs during the past two decades since the first study regarding their biological applications were reported in 1998 (Bruchez et al., 1998). QDs are an important class of fluorescent labels with prominent optical features and can be combined with advanced biological and imaging techniques for molecular and cellular imaging (Zhou et al., 2015). Additionally, the QDs have large surface areas and may function as effective nano-scaffolds to conjugate miscellaneous probes for ultrasensitive bioassays and diagnostic applications (Kairdolf et al., 2013). BGRW strain of Providencia vermicola has a discriminatory ability to produce selenium nanoparticles, resist many metals such as selenium, cadmium, silver, zinc, copper, lead, nickel, cobalt and bismuth metals and able to grow in the presence of 6 mM of CdCl2 (El-Deeb et al., 2018). Therefore, this study investigated effects of culture conditions such as pH, temperature and Se/Cd ratios on the rate of CdSe synthesis of the strain BGRW, which have ability to produce CdSe QDs isolated from a rhizosphere in the farm at Taif, KSA.
Bacterial strain
Strain BGRW was used for this study; this strain was revealed to synthesize selenium nanoparticles (El-Deeb et al., 2018). The 16s rRNA sequence of this strain was reported later by the previous study as accession KX447430 in the GenBank database.
Reduction of cadmium and selenium ions
Previously isolated strain BGRW as a selenium reducing bacteria was screened for selenium-cadmium reducing ability. Bacterial strain was grown on tryptic soy agar (TSA) supplemented with 0.5 mM selenium dioxide and 0.5 mM cadmium chloride at 37°C for 24 h according to Ayano et al. (2015) and Cui et al. (2009) with slight modification. If colonies just grow, a strain is classified as resistant but if the colonies take yellow-orange color, a strain is classified as cadmium and selenium reduced strain.
Determination of minimum inhibitory concentration (MIC) of SeO2 and CdCl2
The metal salts SeO2 and CdCl2 were used in varying concentrations (0.5-25 mM) supplemented onto a nutrient agar plate. The metal resistant bacterial colony was scored and sub-cultured on tryptic soy agar (TSA) with different concentrations of various metal salts such as SeO2 and CdCl2and incubated at 37°C for 24 h. The MIC is expressed as the minimum concentration of various metal ions that completely inhibited the appearance of colonies on the plates. Experiments were carried out in triplicate (Ghosh et al., 2008).
Ability of BGRW to resist various metals
Tryptic soy agar amended with 1 mM of Silver, Zinc, Copper, Gold, Lead, Nickel, Cobalt and Bismuth were added to the medium as ZnCl2, PbCl2, CuCl2, AuCl3, AgNo3, BiCl₃, NiCl2 and CoCl2 (Piotrowska-Seget et al., 2005). Each of these metals was added in a separate experiment. The plates were incubated at 37°C for 48 h. Metals resistance is the ability of microorganism to resist killing by used metal.
CdSe QDs synthesis, collection and purification
The isolated bacteria were cultivated aerobically in 100 mL tryptic soy medium supplemented with 0.1 mM SeO2 and 0.9 mM CdCl2 (the best ratio which determined later) in 250 mL flasks in one-vessel production of QDs. This is so since SeO2 and CdCl2 salts were added in one step on a rotary shaker (110 rpm) for 24 h at 37°C in the dark (Ayano et al., 2015). Formation of CdSe quantum dots was monitored, by recording the absorbance spectrum (200–800 nm) at regular intervals.
QDs collection was different, depending on their location when cells containing the particles as intracellular production bacteria were collected by centrifugation (7000 rpm, 4°C, 10 min) from 50 mL of the culture and washed three times with ultrapure water. Subsequently, the pellet was resuspended in 5 mL of Phosphate Buffer solution (pH 7.2) as a wash buffer and followed by cell-disruption with an ultra-sonicator (130 W, 10 min, Vibracell VCX- 130; Sonics and Materials Inc., CT, SA); the suspensions were filtered with 0.25 μl Millipore syringe filters. Then the QDs were collected from the filtrates by centrifugation (10,000 rpm, 4°C, 30 min) and suspended in 5 mL of ultrapure water according to Cui et al. (2009) with slight modification. In addition, another easy procedure of QDs biorecovery was used, whereas the cells containing QDs were sterilized at ordinary autoclaving program according to Fesharaki et al. (2010) with slight modification.
But when the production of QDs was extracellular, bacteria were precipitated using centrifugation (7,000 rpm, 4°C, 10 min) from 50 mL of the culture then the supernatant was filtered through 0.25 μl Millipore syringe filters to obtain free cell supernatant which had free QDs. Then, the QDs were collected using centrifugation (10, 000 rpm, 4°C, 30 min) and suspended in 5 mL of ultrapure water (Suresh, 2014). The precipitate of QDs from intra/extra cells was washed with ethanol and water to remove any contaminants present and dried in hot air oven at 45 -50°C; this step is called purification (Shivashankarappa and Sanjay, 2015). The CdSe QDs were purified from the protein and other contaminants.
Characterization of CdSe QDs
Fluorescence or UV-Vis spectrophotometer
The characterizations of the synthesized QDs were carried out according to the method described previously (Ahmad et al., 2003). The biologically synthesized CdSe QDs were characterized by UV-Vis spectroscopy (Perkin Elmer, Lambda 25) instrument scanning in the range of 200-800 nm, at a resolution of 1 nm. However, the fluorescence excitation spectra of all CdSe QDs samples were measured with a fluorescence spectrophotometer at an excitation wavelength of 380 nm (RF-5301, Shimadzu; Ex = 380 nm), using the same settings. All samples for fluorescence or UV-Vis spectra measurement analysis were conducted to collect and purify CdSe QDs as mentioned above at 25°C; all samples were diluted 10-fold for all experiments. UV-Vis spectroscopy analyses of cell-free supernatant without the addition of SeO2or CdCl2 was used as control throughout the experiment. Analysis of several weeks old samples was also carried out to check the stability of CdSe QDs.
Transmission electron microscopy (TEM) measurements
The sample was first centrifuged at 10,000 rpm for 30 min. For transmission electron microscope (TEM) measurements, a drop of solution containing synthesized CdSe QDs was placed on the carbon coated copper grids and kept under vacuum desiccation for overnight before loading them onto a specimen holder. Studies of size and morphology of the nanoparticles were performed by means of transmission electron microscopy (TEM) operated at 120 k accelerating voltage (JTEM 1230, Japan, JEOL) at King Saud University.
X-ray diffraction (XRD) analysis
X-ray diffraction (XRD) analysis was performed using an automated diffract meter (Philips type: Pw1840), at a step size of 0.02, scanning rate of 20 in 2θ /min, and a 2θ range from 10 to 80. Indexing of the powder patterns and least squares fitting of the unit cell parameters was possible using the software X'Pert High score Plus.
Electron Dispersive Spectrometer (EDS) analysis
The chemical elements that form the purified quantum dots were determined with EDS. For that purpose, recovered pellets of CdSe QDs were analyzed with an energy-dispersive X-ray spectrometer (Hitachi S-570, Tokyo, Japan).
Fourier Transforms Infrared Spectroscopy (FTIR) analysis
FTIR measurements were carried out using attenuated total reflection Fourier transform infrared (ATR-FTIR) spectrometer (Bruker, Germany, Alpha-P). The instrument was configured with ATR sample cell including a diamond crystal with a scanning depth up to 2 µm. To remove any free biomass residue or compound that is not capping ligand of the QDs, the residual solution of 100 ml after reaction was centrifuged at 10,000 rpm for 30 min. The bio transformed products present in cell-free filtrate, freeze-dried sample powders, were applied to the surface of the crystal then locked in place with a "clutch-type" lever before measuring transmittance. Each of the spectra was collected in the range 400- 4,000 cm-1 at 2 cm-1 resolution. Compared to the conventional transmission mode, the present technique is faster sampling without preparation, excellent reproducibility and simpler to use.
Optimization of CdSe QDs biosynthesis
The effect of temperature on CdSe QDs formation
All assays to investigate the effect of various parameter on the reduction ability by inoculated pure microbial cultures in 250 ml Erlenmeyer flasks containing 100 ml tryptic soy broth (Ayano et al., 2015). In addition to the required volume of 200 mM stock solutions of SeO2 and CdCl2 was done to give an overall concentration of 0.1 mM SeO2: 0.9 mM CdCl2, which was the best ratio to the biosynthesis of CdSe QDs and the pH of the aqueous mixture was adjusted to pH 7.0. The effect of temperature on CdSe QDs formation was evaluated with assay by incubating the samples at a temperature range between 10 and 60°C. The flasks were incubated on a shaker at 110 rpm for 24 h, each temperature was carried out in duplicate; no inoculum was added to sterile controls. The synthesis of CdSe QDs was followed by visual observation of orange-yellow color formed in the culture; UV-Vis spectrums were also obtained.
The effect of SeO2 and CdCl2 concentration on CdSe QDs formation
This was done by the inoculation pure microbial cultures in 250 ml Erlenmeyer flasks containing 100 ml tryptic soy broth with different ratios of SeO2 and CdCl2 in the assays (0.1 mM: 0.9 mM, 0.2 mM:0.8 mM, 0.3 mM:0.7 mM, 0.4 mM:0.6 mM, 0.5 mM:0.5 mM, 0.6 mM:0.4 mM, 0.7 mM:0.3 mM, 0.8 mM:0.2 mM and 0.9 mM:0.1 mM). All these concentrations were obtained by adding the required volume of 200 mM stock solutions of SeO2 and CdCl2. Each ratio was carried out in duplicate; no inoculum was added to sterile controls. The flasks were incubated on a shaker at 110 rpm and 37°C for 24 h according to Suresh et al. (2014) with slight modification. The synthesis of QDs was followed by visually observation of gradation color from red to orange-yellow formed in the culture, UV-Vis and fluorescence spectrums were also obtained as previously described (Wu et al., 2015).
The effect of pH on CdSe QDs formation
All assays to investigate the effect of pH on the reduction ability by inoculated pure microbial cultures in 250 ml Erlenmeyer flasks containing 100 ml tryptic soy broth were done (Ayano et al., 2015). Adding to the required volume of 200 mM stock solutions of SeO2 and CdCl2 to give an overall concentration of 0.1 mM SeO2: 0.9 mM CdCl2 was done. This was the best ratio to biosynthesis of CdSe QDs. The effect of pH on CdSe QDs formation was evaluated using specific buffers, ranging from pH 5 to 9. Acetate was used for the acidic pH range and NaOH for the alkaline pH range. The flasks were incubated on a shaker at 110 rpm and 37°C for 24 h. The synthesis of QDs were followed by visual observation of orange-yellow color formed in the culture, each pH was carried out in duplicate; no inoculum was added to sterile controls.
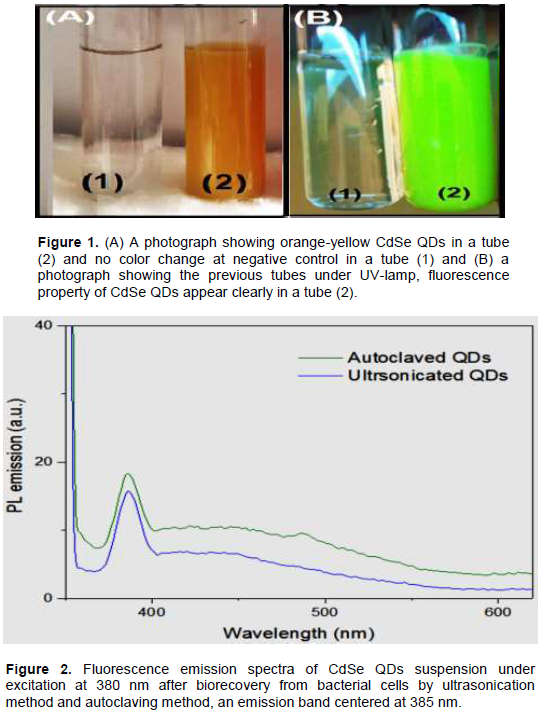
The strain has a discriminatory ability to resist many metals such as selenium, cadmium, silver, zinc, copper, lead, nickel, cobalt and bismuth. It was observed that upon addition of the SeO2 and CdCl2 into the flask containing the TSB medium inoculated with Providencia vermicola BGRW, the color of the medium changed to yellow-orange color (Figure 1) and CdSe QDs were found extra/intracellularly; these QDs persisted for eight months in liquid suspension. BGRW strain was found to be highly resistant to selenium dioxide up to 20 mM and was able to grow in the presence of 6 mM of CdCl2.
When cells containing the quantum dots at intracellular production, bacterial cells were collected, washed and sonicated or another easy procedure of nanoparticles bio-recovery was used, where the culture was sterilized at the ordinary autoclaving program. The wet heat sterilization process disrupted the bacterial cells containing the QDs; this method was used by Fesharaki et al. (2010) as a succeeding method for nanoparticles biorecovery by Klebsiella pneumoniae culture. Fluorescence spectrophotometer was used to compare the released QDs and the previous two methods (ultrasonication and autoclaving); the result confirms that autoclaving method had the higher released QDs from bacterial cells than ultrasonication method (Figure 2). The precipitate of nanoparticles was washed with ethanol and water many times to remove any contaminants present and dried in hot air oven at 45 -50°C; this step called purification from the protein and other contaminants formed in the reaction suspension (Shivashankarappa and Sanjay, 2015).

Characterization of CdSe QDs
Visualization of biogenic CdSe QDs color
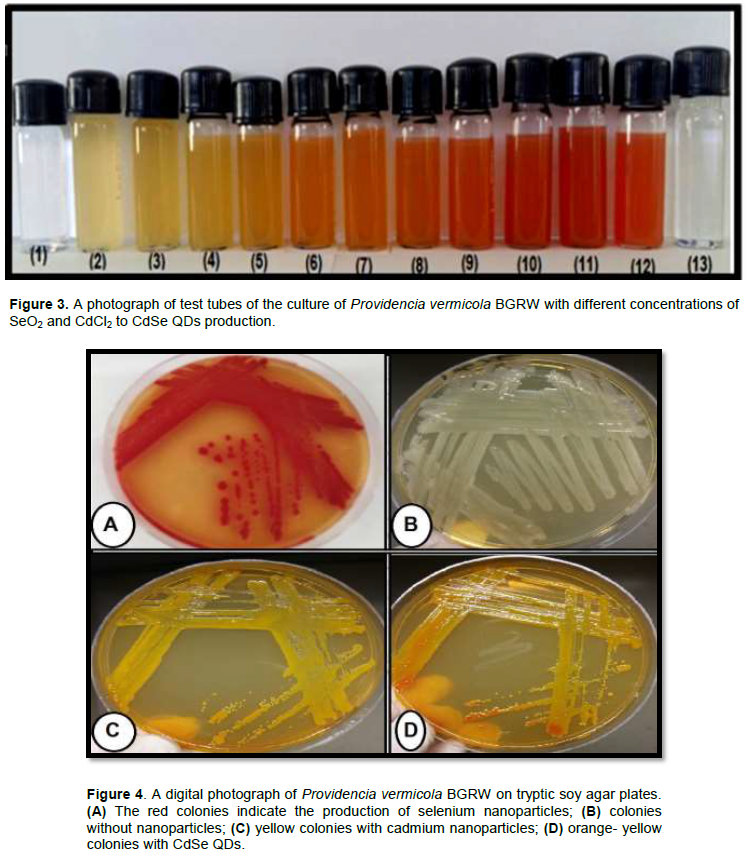
For CdSe QDs biosynthesis by BGRW, the incubation of bacterial culture with sodium dioxide and cadmium chloride at 37° C for 24 h in dark showed a color change to bright orange-yellow (Figure 1, tube 2), which is the characteristic of CdSe QDs formation. This orange-yellow color is due to the excitation of surface Plasmon vibrations in CdSe QDs and it provides a convenient spectroscopic signature for CdSe QDs formation, whereas no color change could be demonstrated in a solution of selenium dioxide and cadmium chloride as a negative control (Figure 1, tube.1). Many related searches revealed that nanoparticles formation might involve a complex of either reductases, capping proteins, quinones or cytochromes, electron shuttles or phytochelatins that are reduced and stabilized various metal nanoparticles (Kumar et al., 2007; Ayano et al., 2014). Furthermore, different size, shape and color of CdSe QDs formed depends on the molar ratio of cadmium and selenium ions in the medium; the culture with SeO2 and CdCl2 started to turn reddish brown color in presence of 0.5mM SeO2:0.5 mM CdCl2 within 24 h of incubation while in (0.1mM SeO2:0.9mM CdCl2) concentration, the color of culture was orange-yellow. Therefore, the CdSe QDs tends more yellowish when cadmium ions were increased in bacterial culture (Figure 3, tubes 3-5) while, the CdSe QDs tends more reddish when selenium ions were increased in bacterial culture (Figure 3, tubes 9-11).Colonies of BGRW strain formed orange-yellow colonies on the agar supplemented with (0.1 mM SeO2:0.9 mM CdCl2) after 24 h of incubation as shown in (Figure 4D). These results are in agreement with results obtained by other authors who concluded that different colors CdSe QDs are dependent on the molar ratio of Cd+2 and Se+2 in the medium. CdSe QDs appeared reddish brown at (Kumar et al., 2007; Ayano et al., 2014) study, whereas the CdSe QDs appeared with light yellow color at (Suresh, 2014) study at 1 mM CdCl2 and 1 mM SeCl4 concentrations while SeNPs and CdS show dense red (Bajaj et al., 2012) and bright yellow (Ahmad et al., 2002), respectively.

Generally, the incubation period needed for the synthesis of CdSe QDs in the present study was 24 h when the others conditions were optimized: pH 9 and 37°C. In contrast, an incubation period required for the synthesis of CdSe QDs was 48 h by (Ayano et al., 2015).
In addition, an important observation that the reduction of the selenium and cadmium ions takes place extracellularly by P. vermicola BGRW as well as intracellular production was made. Accordingly, this offers a great advantage over an intracellular process of synthesis from the application point of view, since the CdSe QDs formed inside the bacteria would be needed for additional step of processing to ensure nanoparticles release from the bacteria using ultrasound treatment or by reaction with suitable detergents.
UV-Vis spectrophotometer for CdSe QDs
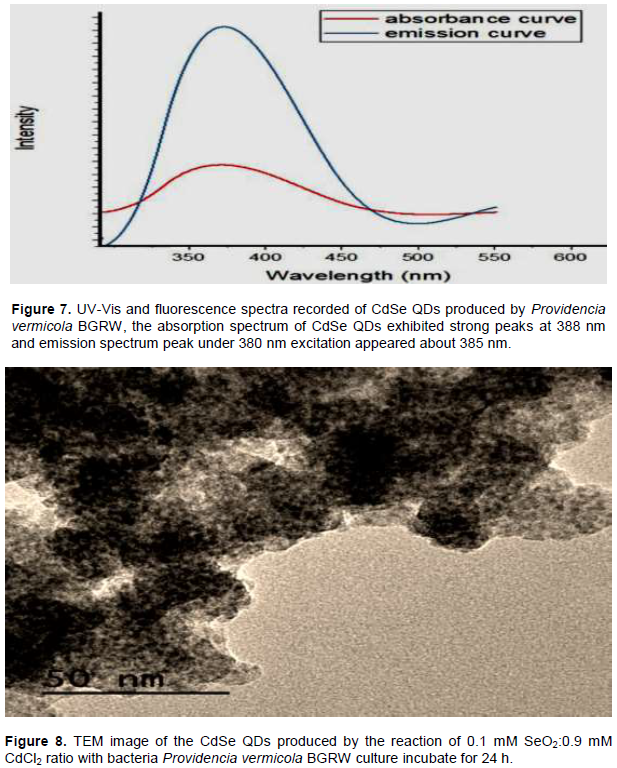
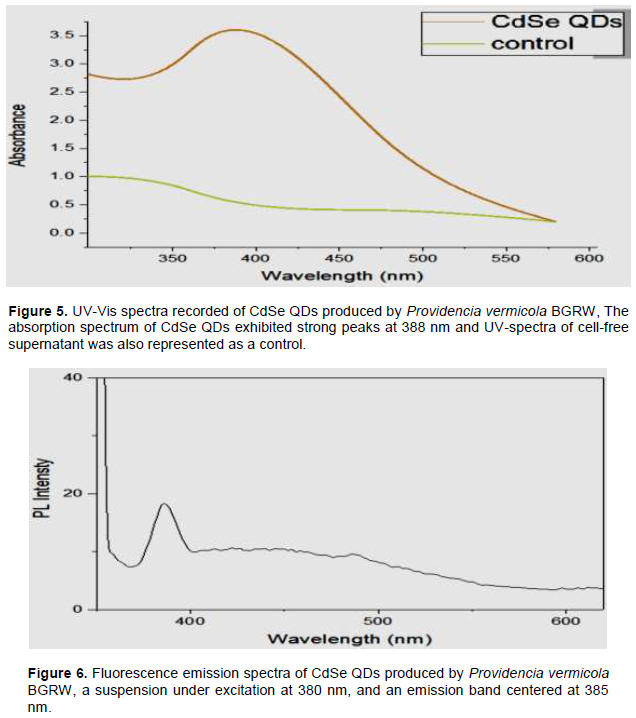
For CdSe QDs spectra measurements, the UV-Vis spectrum illustrated shows an absorption peak in the region of 200-800 nm for the cell filtrate from the culture of P. vermicola BGRW strain which had 0.1 mM SeO2: 0.9 mM CdCl2 as a source of selenium and cadmium ions. This showed the presence of absorbance bands centered at 388 nm, suggesting the formation of CdSe quantum dots, which is (Figure 5) compatible with the study of Ogermann et al. (2012). Similar to spectra of CdSe, QDs showed the presence of absorbance band centered at 350 nm in Gupta and Ramrakhiani (2009) and Suresh (2014) studies. When the biological method of CdSe QDs production was used, an absorption band may be centered between 270 and 280 nm, which is visible due to protein or peptide, associated with the quantum dots; indicating a possible protein or a peptide core-shell as a capping molecule (Wu et al., 2015). The broad peak of QDs may be due to the variation in the size of the nanoparticles (Malarkodi et al., 2014). However, some of the other studies did not use UV-Vis spectrophotometer to characterize CdSe QDs (Cui et al., 2009; Ayano et al., 2015).
Fluorescence spectrophotometer for CdSe QDs
Depending on fluorescence property of quantum dots, photoluminescence characteristics of the biogenic CdSe quantum dots were studied by fluorescence spectral measurements upon excitation at 380 nm. An emission band centered at 385 nm (Figure 6) was observed and was comparable to the emission peaks of QDs synthesized by chemical method reported earlier (Zhang et al., 2007; Fokina et al., 2016).
The size-dependent absorbance and fluorescence spectrum in the visible range, commonly observed for similar quantum dots was not detected at (Cui et al., 2009; Qu et al., 2001) studies. Ayano et al. (2014) explained why different wavelengths absorbed and emitted, whereas a strong absorbance (300–400 nm) and fluorescence (390–560 nm) was observed, there was probability that the CdSe quantum dots spectrum might have been overlapped with one or varied bio-molecules such as NADH/NAD+, whose absorbance and fluorescence might have been correlated with CdSeQDs.
The emission is referred to the band gap or near band gap emission, resulting from the recombination of electron-hole pairs in the quantum dot nanoparticles (Smith and Nie, 2009). The absorption spectrum (Figure 7) of CdSe QDs did not show bands at wavelengths longer than 400 nm. Upon ultraviolet irradiation, however, an emission centered at 385 nm appears in the spectrum in Figure 7.
Transmission Electron Microscopy (TEM) measurements of CdSe QDs
TEM images of the CdSe QDs synthesized by a culture of Providencia vermicola BGRW with 0.1 mM SeO2:0.9 mM CdCl2 ratio were done in Figure 8, the particles ranged in size approximately from 2 to 4 nm in diameter in one vessel production. Also, transmission electron micrographs of prepared CdSe QDs (Figure 8) showed that the particles were poly-dispersed nanoparticles. Cui et al. (2009) reported the smallest size of CdSe QDs produced by Saccharomyces cerevisiae yeast, pluralities of the particles were monodispersed spheres with a mean diameter of 2.69±0.07 nm, while in Ayano et al. (2014) study, the CdSe QDs produced by Pseudomonas sp. strain RB were 10-20 nm. Recently, 15 to 20 nm CdSe QDs were biosynthesized by yeast (Wu et al., 2015).
Energy-dispersive X-ray (EDS) analysis and X-Ray diffraction (XRD) analysis of CdSe QDs
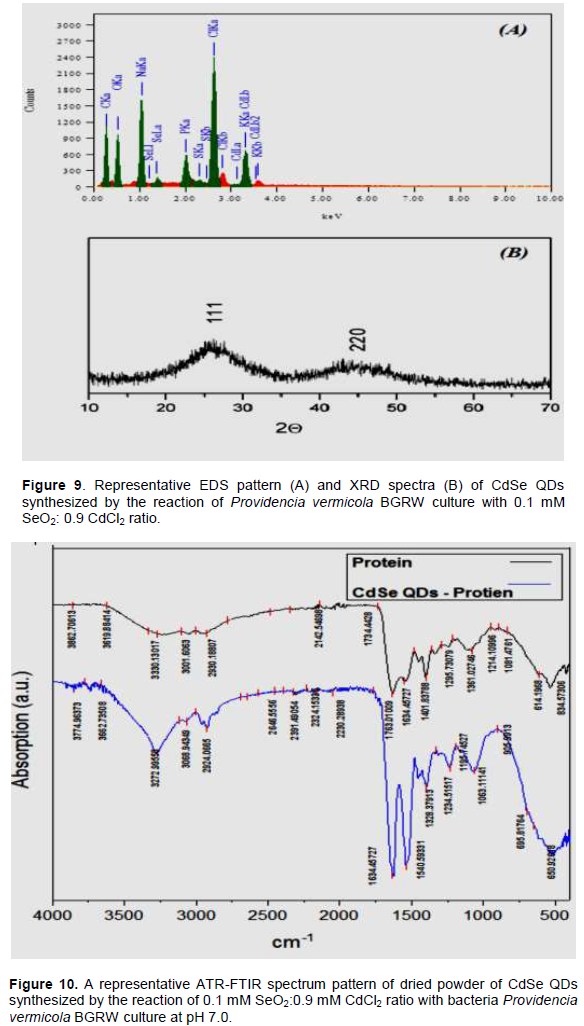
Furthermore, energy-dispersive x-ray (EDS) analysis of freeze-dried CdSe QDs is shown in Figure 9A. The EDS result of the CdSe QDs confirmed that the QDs contained elements such as cadmium, selenium, oxygen, carbon, sulphur, sodium, phosphorus, chlor and potassium. The existing elements oxygen, carbon, phosphorus and sulphur, which are the main integral of proteins and oligopeptides took a step closer to this hypothesis, CdSe QDs were manufactured with the assistance of protein molecules and on the protein layer, giving the CdSe products high stability (Srivastava and Mukhopadhyay, 2013).
In addition, the XRD pattern indicates CdSe quantum dots exhibit cubic crystal structure. The intensity of XRD peaks was not strong and little broad indicates the semi-amorphous nature of the biosynthesized CdSe QDs (Figure 9B).
Fourier transforms infrared spectroscopy (FTIR) analysis of CdSe QDs
Biosynthesized CdSe QDs that were produced by Providencia vermicola BGRW was characterized by using attenuated total reflection Fourier transform infrared (ATR-FTIR). The ATR-FTIR spectrum (Figure 10) of bacterial crude protein and the CdSe QDs surface showed obvious changes in both the shape and the peak position, suggesting the changes in the secondary structure of protein after nanoparticle formation. FTIR results revealed that secondary structures of proteins were affected as a consequence of binding with CdSe QDs. ATR- FTIR spectra of CdSe QDs (Figure 10) showed that several peaks appeared at 650, 695, 905, 1063, 1195, 1234, 1328, 1540, 1634, 2230, 2324, 2391, 2646, 2924, 3068, 3272, 3662 and 3774 , which are characteristic of proteins. The strong broad peaks at 2646, 2924, 3068, 3272, 3662 and 3774 can be corresponding to the amine group (NH stretching) and 3272, 3662 and 3774 cm-1 can be assigned to hydroxyl (OH) group. The peaks at 695, 2924, 3068 and 1540 are associated with C-H stretching (Mukherje, 2014). The bands at 1063, 1195 and 1234 may be attributed to C-O stretching mode (Huang et al., 2007). The peak at 695 likely due to the presence of aromatic compounds (Tani et al., 2007). Furthermore, the FTIR spectrum revealed two bands at 1634 and 1540 cm-1 corresponding to the amide I and II bands of proteins, respectively. The Amide I band is primarily a C=N stretching mode and the Amide II band is a combination of N-H in-plane bending and C-N stretching. The more-complex Amide III band is located near 1328 cm-1. The amide groups indicating the presence of proteins as mentioned above. With the overall observations, it can be concluded that the proteins might have formed a capping agent over the CdSe QDs, which may respond to their stabilization (Dhar et al., 2015). Therefore, the produced CdSe QDs persisted for several months in liquid suspension. The peak at 650 cm-1 corresponds to C−S disulfide stretching vibration indicate the frequent occurrence of thiols and its substituted compounds, constituting the backbone of the interacting protein. From the ATR-FTIR spectra, an interaction between CdSe QDs and protein is farther confirmed by the shift in CS (614 cm−1 to 1328 cm−1), CO (1081 cm−1 to 1063 cm−1), CN (1295 cm−1 to 1234 cm−1), nitro compound (1401 cm−1 to 618 cm−1) and OH (2930, 3001, 3330, 3619 and 3862 cm−1 to 2924, 3068, 3272, 3662 and 3774 cm−1).

Some of these peaks (1540, 3662 and 3774) revered hydroxyl, amide and amine which were similar between selenium nanoparticles and CdSe QDs. This means that the capping agent for different nanoparticles were similar if the bacterial strain was one, while there were a lot of various peaks at QDs. It is worth mentioning that, there are no previous studies characterizing the capping agent of biosynthesized CdSe QDs. At similar study on CdS QDs, the stability of the CdS QDs is brought by the binding of the proteins to nanoparticles, either by free amino groups or through cysteine residues (Sanghi and Verma, 2009; Ahmad et al., 2002). The data provide some insights on the nature of the capping layer of nanoparticles surface, which may be further utilized for bio-functionalization for different applications (Syed and Ahmad, 2013).
Optimization the condition of CdSe QDs synthesis
The effect of temperature on CdSe QDs formation
Several factors can affect the stability, size, shape, crystallinity and aggregation of QDs, among these factors are incubation time of bacteria with precursors, precursor concentration, biomass, type of bacteria, the presence of oxygen, presence of capping agent, a negative charge of NPs, pH, temperature and presence of EPS and PVP (Tam et al., 2010). One of the important parameters to evaluate the efficiency of the biosynthesis method is the incubation temperature, the rate of any chemical and biological reaction is affected by it. Quantum dots synthesis of Providencia vermicola BGRW culture in terms of color intensity were examined at different temperature (10-60°C). The increase in the color intensity of culture was due to increased number of quantum dots formed (Shirsat et al., 2016). In addition, the increase in fluorescence intensity under UV-lamp of culture was due to increasing number of CdSe QDs (Ayano et al., 2014). In addition, green synthesis of CdSe QDs is enzyme-mediated process and enzymes are temperature sensitive.
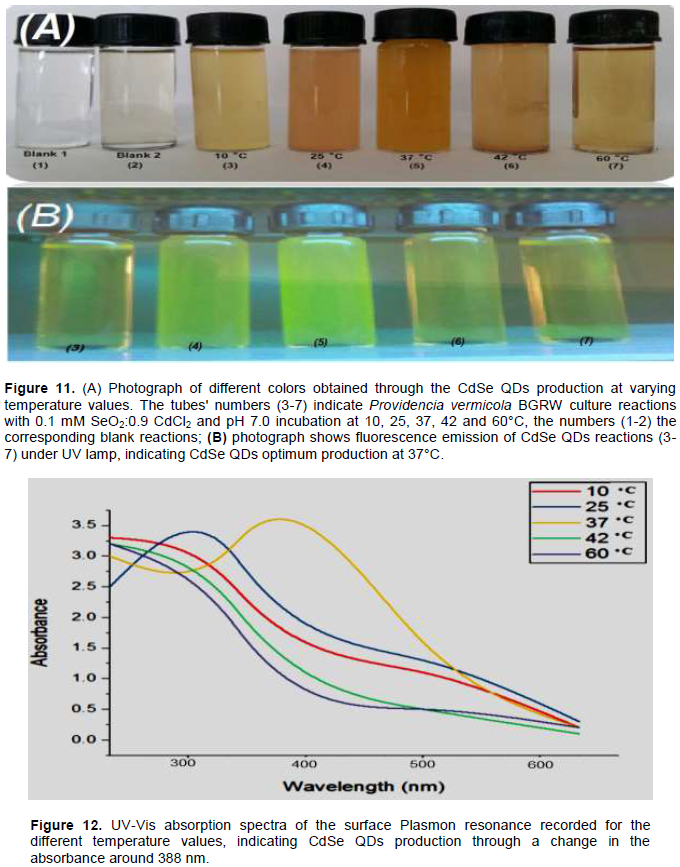
The results were found for CdSe QDs formation started at 25°C (Tube 3), with the optimum formation at 37°C (Tube 5) (Figure 11A). It was found that changes in temperature greatly affected the rate of QDs biosynthesis at 0.9 mM CdCl2: 0.1 mM SeO2 ratio and pH 7. At 10°C, the culture reaction did not give a color of CdSe QDs, signifying no formation of CdSe QDs; indicating that chemical reduction was not formed. At 25 to 37°C (Tubes 4 and 5), the culture gave an intense orange-yellow color, with a clear difference in the blank reaction, proving it to be the optimum temperature to produce QDs. At 42 and 60°C (Tube 6) the culture did not give color, again a clear difference in the blank reaction, these results were also confirmed under UV-lamp (Figure 11B); whereas the culture incubated at 37°C showed the highest intensity of fluorescence emission. Also, UV-Vis spectroscopy affirmed these results as shown (Figure 12), showed that the optimum temperature for the synthesis of QDs by Providencia vermicola BGRW was 37°C, whereas the control experiment, that is SeO2 and CdCl2 solution incubated at different temperature (10-60°C) showed no sign of QDs synthesis (data not shown). A similar study, Ayano et al. (2014), reported that the optimum temperature for growth that is most practical is expected to be 37°C because the specific growth rate declined at temperatures higher than 40°C. Also, the eliminations of selenite and cadmium ion become slower as the temperature rose, Pseudomonas aeruginosa Strain RB grew well with removal of most of the supplemented amounts of selenite and cadmium at 30°C, although growth happened more rapidly at 37°C than that at 30°C.
The effect of metal ion concentration on CdSe QDs formation
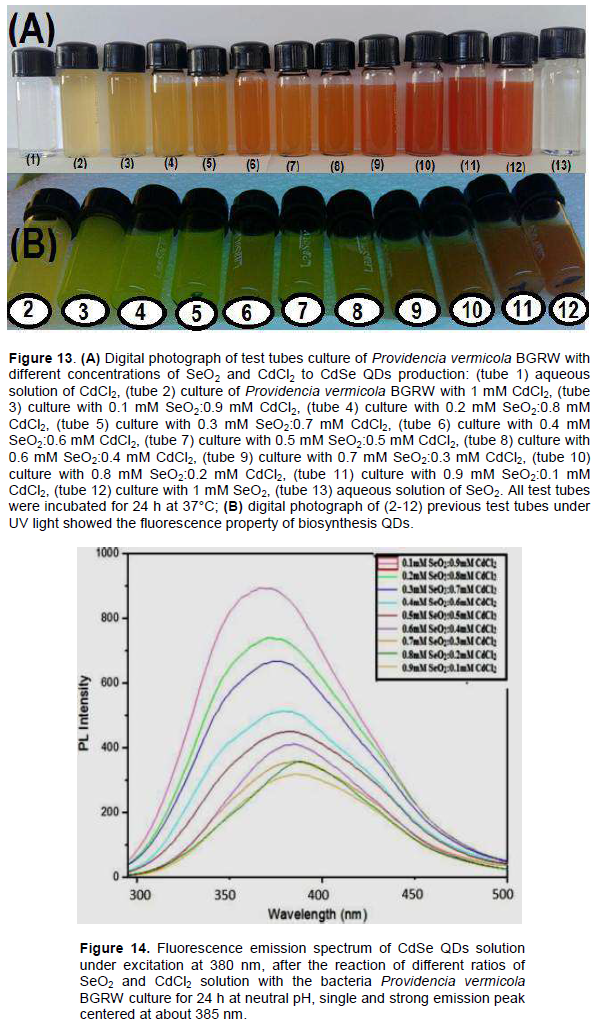
The effect of different SeO2 and CdCl2 ratios (concentrations of SeO2 and CdCl2) (0.1 mM:0.9 mM, 0.2 mM:0.8 mM, 0.3 mM:0.7 mM, 0.4 mM:0.6 mM, 0.5 mM:0.5 mM, 0.6 mM:0.4 mM, 0.7 mM:0.3 mM, 0.8 mM:0.2 mM and 0.9 mM:0.1 mM) were investigated. Flasks containing the reaction mixtures of bacterial culture incubated with different ratios of SeO2 and CdCl2 compared to four control. The first one was the bacterial culture with SeO2, the second was the aqueous solution of SeO2, the third was the bacterial culture with CdCl2, and the last was the aqueous solution of CdCl2. Visual analysis revealed that the orange-yellow color changed with different ratios of selenium and cadmium ions concentrations (Figure 13A); whereas, the CdSe QDs tends to be more yellowish when cadmium ions were increased in bacterial culture (Tubes 3-5) from (Figure 13A). However, the CdSe QDs tends to be more reddish when selenium ions were increased in bacterial culture (Tubes 8-11) from (Figure 13, A). When these tubes were exposed to the UV light (Figure 13B), fluorescent properties which distinguished quantum dots clearly appeared in the following concentrations of CdCl2 and SeO2 (0.4 mM:0.6 mM, 0.5 mM:0.5 mM, 0.6 mM:0.4 mM, 0.7 mM:0.3 mM, 0.8 mM:0.2 mM and 0.9 mM:0.1 mM), respectively.
The optimum ratio of CdSe QDs production, which had the highest fluorescence emission, was 0.9 mM CdCl2:0.1 mM SeO2 investigated by quickly measuring the maximum fluorescence intensities of QDs contained bacteria solutions to determine the optimal synthetic conditions. The emitted fluorescence light increase with high concentration of cadmium ions and low concentration of selenium ions. It is worth mentioning that, the reaction of P. vermicola BGRW culture with cadmium chloride (Tube 2) at (Figure 13B) did not emit any fluorescence light under UV light which shows the quantum dots did not produce, unless the existence of cadmium and selenium ions together and the type of QDs were CdSe, not CdS. In addition, it is worth mentioning that the color of fluorescent lighting is different by various ratios, which showed that the concentration of materials effect on the size of the quantum as known, the fluorescent color differs depending on the QDs size similar to other results (Wu et al., 2015). Whereas, the CdSe QDs tends to give green fluorescent when cadmium ions were increased in bacterial culture (Tubes 3-5), (Figure 13B), the CdSe QDs tends to orange fluorescent when selenium ions were increased (Tubes 9, 10) (Figure 13B).
These results were also confirmed by fluorescence spectroscopy, Figure 14 shows the spectra obtained when bacterial culture was incubated with varying ratios of SeO2 and CdCl2. As shown in (Figurd 14), the fluorescence spectra recorded from the bacterial culture to determine CdSe QDs, in all ratios of SeO2 and CdCl2 showed the appearance strong emission peak centered at about 385 nm, which is a characteristic for CdSe QDs. Furthermore, the increasing intensity of the peak can be attributed to the increase in the number of QDs in the solution. In this study, the CdSe QDs production by BGRW increased according to cadmium ions increased. The fluorescence spectra was used to determine the optimized ratio of CdSe QDs production instead of UV-Vis spectra because the estimation of the highest absorption of ratios used was difficult; referring to the presence of many peaks at many positions.
In another study, Yan et al. (2014) produced CdSe QDs from E. coli cells which had the strongest ability to biosynthesize QDs when 250 μM selenium and 750 μM cadmium concentration was used. Yan et al. (2014) resulted that, high concentrations of Na2SeO3 or CdCl2 might contribute to superoxide anion oxidative damage, which would reduce the intracellular biochemical activity, leading to the decrement of QDs biosynthesis. In addition, when the concentration of selenium or cadmium was at a low level, the synthesis ability of cells was not saturated, leading to a low yield of CdSe QDs.
The effect of pH on CdSe QDs formation
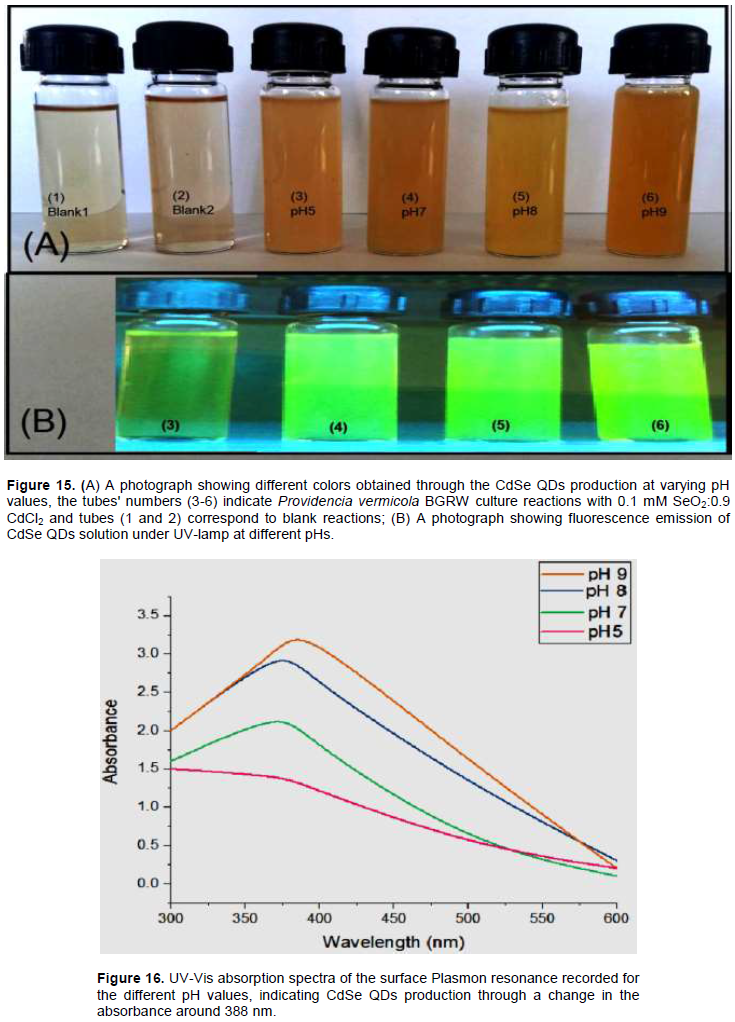
Furthermore, CdSe QDs were formed at various pH values (5.0, 7.0, 8.0 and 9.0), the optimum formation of QDs was at pH 9.0 (Tube 5) of (Figure 15). When pH was increased from 5 to 9, maximum synthesis was observed at pH 9.0. The synthesis time was greatly reduced and the yield of QDs was significantly enhanced, as evidenced by UV-Vis spectroscopy (Figure 16). The color of culture at pH 5 was more reddish than that of the other cultures under neutral and alkaline pHs. The bacterial culture at pH 8.0 actually became yellower than those under neutral or acidic conditions are which is similar to a previous report (Ayano et al., 2015).
Therefore, the present study shows that the optimum pH for the synthesis of QDs was 9.0. The control experiments, that is, a mixture of SeO2 and CdCl2 solution incubated at different pH (5-9) showed no synthesis of QDs (data not shown).
This is also in agreement with earlier reports that addition of an alkaline ion is necessary to carry out the reduction reaction of metal ions (Shankar et al., 2004) and in the absence of the hydroxyl ion, the time required for
reduction of metal ions was prolonged.
There was one report that discussed the effect of pH condition on CdSe QDs production by bacteria (Ayano et al., 2014). Their results indicated that the selenite and cadmium removals did not decrease until 24 h at pH 6.5 and were slower thereafter, that was not applicable to the CdSe synthesis. At pH 8.0, the removal of both selenite and cadmium decreased considerably and the cadmium removal was higher than the selenite removal, this tendency was also observed at pH 8.5.