ABSTRACT
Access to adequate and safe water is a universal human need. Lack of safe and adequate water supply causes health risk and the situation is serious in developing countries The aim of this study was to determine the bacterial load, physicochemical quality of drinking water in wells, reservoir, taps and household storage containers water samples and to investigate the hygiene and sanitation practices of the consumers in Woreta Town. A cross sectional community based study was conducted from January to March 2016 in Woreta town. A total of 189 water samples were collected from wells, reservoir, private taps and household storage containers in three rounds for bacteriological, physicochemical quality of drinking water and the hygiene-sanitation practices of the consumers were assessed using interview. Bacterial load analysis of water samples revealed that well and reservoir water samples were 100%; 30 (100%) tap water samples and 30 (100%) household storage container water samples were contaminated with total coliforms and did not meet the recommended value of World Health Organization (0CFU/100 ml). Regarding thermotolerant coliforms, one well water sample, 21 (70%) tap water samples and 30 (100%) household water samples were contaminated. The bacteriological load was greater at the household storage container water samples. There was statistically significant difference in total coliform and thermotolerants coliforms among the water sources at p < 0.01. Proper management of water sources, appropriate disinfection of raw water sources with chlorine and promoting good hygiene and sanitation practices are recommended to deliver safe drinking water to the consumers of the study area.
Key words: Bacteriology, drinking water, household, hygiene, physicochemical, tap water.
Outbreaks of waterborne diseases continue to occur throughout the world and the problem is especially serious in developing countries where there is lack of safe water for drinking and for sanitation. Access to safe water is a fundamental human need and, therefore, a basic human right (Mmuoegbulam et al., 2017). More than 80% of diseases in the world are attributed to unsafe drinking water or inadequate sanitation practices (Bedada et al., 2018). Globally, more than 1 billion people depend on perilous drinking water resources from rivers, lakes, and open wells. Several studies have confirmed that water-related microbial diseases not only remain leading causes of morbidity and mortality worldwide but that the spectrum of diseases is expanding and the incidence of many water-related microbial diseases are increasing (Duressa et al., 2019). Diarrhea remains a major killer in children and it is estimated that 80% of all illness in developing countries is related to water and sanitation; and that 15% of child deaths under the ages of 5 years in developing countries results from diarrheal diseases (Kassie and Hyelom, 2017; Malhotra et al., 2015). The human pathogens that present serious risk of diseases whenever present in drinking water include Salmonella species, Shigella species, Yersinia enterocolitica, Campylobacter species, various viruses such as Hepatitis A virus, Hepatitis E virus, Rotavirus and parasites like Entamoeba histolytica, and Giardia lamblia (Agbo et al., 2019).
Provision of safe household water includes conditions and practices of water collection, storage, handling and the choice of storage containers or vessels (Kassie and Hyelom, 2017). Water may become contaminated at any point between collection, storage, serving or handling in the house (Bedada et al., 2018). Microbial contamination of collected and stored household water is caused not only by the collection and use but unsanitary and inadequately protected (open, uncovered or poorly covered) water collection and storage containers. Unsanitary methods to dispense water from household storage vessels, including contaminated hands and dippers and inadequate cleaning of vessels, lead to accumulation of sediments and pathogens (Tambekar et al., 2008). The direct detection of pathogenic bacteria requires costly and time consuming procedures, and well-trained labor. These requirements lead to the concept of indicator organisms of fecal contamination (WHO, 2006b). Indicator bacteria are used to evaluate the potability of drinking water because it would be impossible to accurately enumerate all pathogenic organisms that are transmitted by water (Bedada et al., 2018). The use of indicator organisms, in particular the coliform, as a means of assessing the potential presence of waterborne pathogens has paramount importance in protecting public health. The presence of any coliform organism in drinking water is used as an indicator of fecal contamination since they are the most sensitive indicator bacteria for demonstrating contamination (Bedada et al., 2018; Nourani et al., 2007).
The World Health Organization (WHO) rated Ethiopia as having the lowest level of water supply coverage in sub-Saharan Africa, at 24%, and the second lowest sanitation coverage, at 15% (WHO, 2006a). The cause of this water quality problem is the backward socio-economic development which results in one of lowest standard of living, poor environmental conditions and low level of social services (UNWATER/WWAP, 2004). Ethiopia is one of the countries where only 52 and 28% of its population have access to safe water and sanitation coverage, respectively. For this reason, 60% to 80% of the population suffers from waterborne and water related diseases. According to Ministry of Water Resource (MoWR, 2007) of Ethiopia, these burden the country with enormous financial and social costs to take care of such a huge number of people suffering from these debilitating infections. Three-fourth of the health problems of children in Ethiopia are communicable diseases arising from the environment, especially water and sanitation. Forty six percent of under-five mortality is due to diarrhea. The Ministry of Health of Ethiopia (MoH, 2005) estimated that 6,000 children die each day from diarrhea and dehydration. In Amhara region, 90,000 children under 5 years of age die annually from diseases related water and sanitation (WHO, 2006a).
The drinking water supply of Woreta town is exposed to contamination at different points by a number of reasons. According to Woreta town Water Supply Office (WWSO, 2015), open defecation, agricultural activities around the water source, improper disposal of garbage in the field or streets, the poorly constructed pit latrines, construction of waste storage pits and latrines within a short distance from water distribution pipe line, unsanitary conditions of water storage containers, and personal hygiene problems are the major sources of pollutants of drinking water in the town. Appropriate treatment and sanitary survey are very important to protect and control the waterborne diseases (Eliku and Sulaiman, 2015). The currently accepted bacterial indicators (total coliforms, thermotolerant coliforms) and related physico-chemical parameters are very important to evaluate drinking water quality (WHO/UNICEF, 2010). So far no studies have been done in Woreta town on the bacteriological and physicochemical quality of drinking water in relation with hygienic practices of the consumers. The aim of the study was to determine the bacteriological and physicochemical quality of drinking water from source to point-of-consumption and to assess hygienic practices of consumers in Woreta town from January to March, 2016. The findings of this study will provide important baseline information about water quality for stake holders for further work and intervention.
Study design and description of study area
A cross sectional study was conducted in Woreta town over a period of three months (January to March, 2016). It is located in North Western Ethiopia, Amhara National Regional State. The town is situated between 11º55´N latitude and 37º42´E longitude with an elevation of 1,828 meters above sea level. The topography of the town is characterized by plain and it has hot agroclimatic zone. The total population of the town in the four urban kebeles was 26,317 and the number of households was 5,550. The communities in the study area completely depend on ground water as its main source for drinking purpose. The communities of the town have access to tap water from two wells.
Ethical approval
The purpose and procedures of the study were explained to all participants and consent was obtained from all of them. The study was approved by the ethical clearance committees of Bahir Dar University.
Sampling procedures
From the total four kebeles found in the in Woreta town, 2 wells and 1 reservoir were found and all were included in the study. A representative sample of 30 taps and 30 households were selected randomly for household water handling practice of household storage container, bacteriological and physicochemical drinking water quality analysis.
Sample collection
A total of 189 water samples were collected aseptically from wells (n=2), reservoir (n=1), private taps (n=30) and household containers (n=30) in three rounds. For bacteriological water quality examination, water samples were collected in sterile glass bottles and transported to the Bahir Dar Town Water Supply Service Office water microbiology laboratory in a cold box containing ice freezer packs within 2 h collection. From each sampling point 250 ml of water sample was taken for analysis.
Bacteriological analysis
To examine bacteriological parameters, samples were analyzed using membrane filtration (MF) method (APHA, 1998). All samples were analyzed for the presence of total coliforms (TC) and thermotolerant coliforms (TTC). One hundred milliliter of water sample was filtered through a sterile cellulose membrane filter with a pore size of 0.45 µm. The membrane filter was transferred to a sterilized Petri dish containing absorbent pad soaked with membrane lauryl sulfate tryptose broth (Wagtech, England). The Petri dishes were incubated at 37ºC for 18-24 h for TC and 44.5ºC for 18-24 h for TTC. All yellow colonies were counted, recorded and the results were expressed in numbers of colony forming units (CFU) per 100 ml of water sample.
Physicochemical analyses
Physicochemical parameters were analyzed at the site of sample collection and in the laboratory. Temperature and pH were analyzed by using portable digital pH meter (Jenway model-370, England). Turbidity was analyzed by using portable microprocessor turbidity meter (H193703 ELE international, Hungary) within 1 h following the collection of samples, whereas free residual chlorine test was made for all chlorinated samples by using photometer 7100. The test was performed by using N, N-diethyl-1, and 4-phenlenediamine (DPD) chlorine tablets. Total dissolved solids and electrical conductivity were analysed by using portable digital conductivity meter (CC-401, Poland). Furthermore, consumers’ hygiene-sanitation practices were assessed through interview. The interview questions and sanitary inspection forms were adapted from WHO and assessment of the conditions of household water containers was obtained through observation checklist (WHO, 2006).
Statistical analysis
Statistical analysis of bacteriological and physicochemical collected data was statistically analyzed by using SPSS version 20 and were compared with WHO guideline standards of drinking water quality and interpreted as safe, acceptable and polluted range. One-way analysis of variance (ANOVA) was done to test for differences among the parameters measured with respect to sampling sites. P value of ≤ 0.05 was considered to indicate statistical significance.
Bacteriological load of drinking water sources
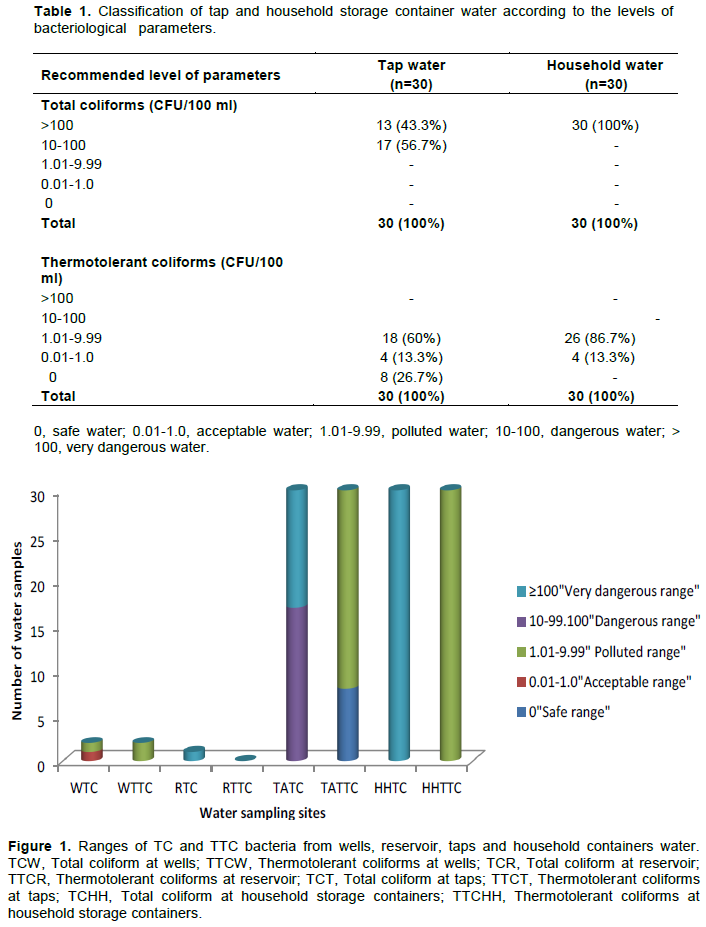
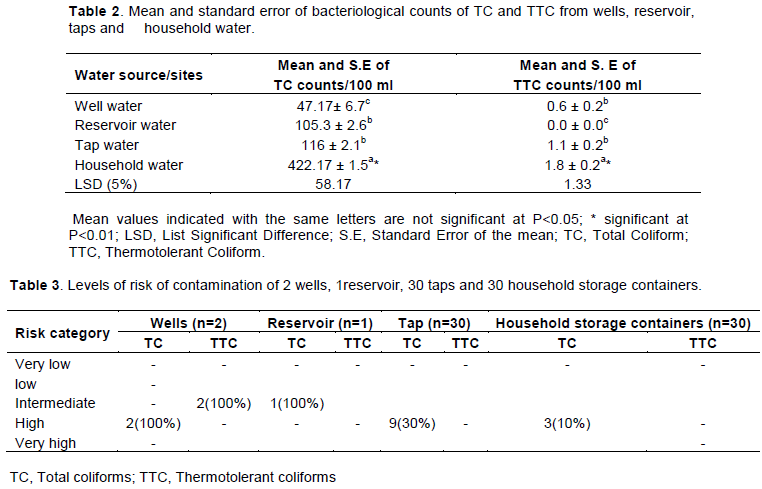
Bacteriological analysis of drinking water samples taken from different sites of Woreta town is presented in Tables 1 and 2. Bacteriological quality of water samples from wells, reservoir, taps and household storage containers were carried out by using the TC and TTC. In the bacteriological water quality analyses of well water, all the water samples were contaminated and were in the range of 10-100 CFU/100 ml for TC. With regard to other bacteriological indicators, TTC, all water samples in well 3 were in the recommended value of WHO (0 CFU/100 ml) whereas in well 6 all water samples were in the range of 1.01-9.99 CFU/100 ml which was not in compliance with WHO guideline. The mean TC and TTC count in the well water samples was 47.17± 6.7/100 and 0.6 ± 0.2/100 ml, respectively. All reservoir water samples were contaminated with TC but were free from TTC. The mean TC and TTC counts were 105.3 ± 2 and 0.0 ± 0.0, respectively.
As shown in Table 1 and Figure 1, out of 30 tap water samples examined, 17 (56.7%) of them were in the range of 10-100 CFU/100 ml whereas 13 (43.3%) samples were in the range of >100 CFU/100 ml for TC counts which were at high and very high level of contamination, respectively. Regarding TTC, 18 (60%) and 4 (13.3%) samples were in the range of 1.01-9.99 CFU/100 ml and 0.01-1.0 CFU/100 ml, respectively. They were at medium and low level of contamination, respectively. Eight (26.7%) tap water samples were found 0 CFU/100 ml which were in the acceptable limit of WHO (0 CFU/100 ml). The mean TC and TTC count in the tap water samples were 116 ± 2.1/100 and 1.1 ± 0.2/100 ml, respectively.
Analysis of household water samples revealed that all the household storage container water samples had TC >100 CFU/100 ml and were above the recommended value of WHO. Regarding the TTC, among the total samples, 25 (83.3%) household container water samples and 5 (16.7%) household water sample had TTC from 1.01-9.99 and 0.01-1.0 CFU/100 ml, respectively. Therefore, the average TC and TTC counts for the 30 household water samples were beyond the recommended value of WHO which is 0 CFU/100 ml (Table 1). The mean TC and TTC count in the household storage container water samples were 422.17 ± 1.5/100 ml and 1.8 ± 0.2/100 ml, respectively. The results of analysis of variance (ANOVA) test showed that there was statistically significant difference in TC among the water source at p < 0.01.
Regardless of significance of difference the higher average value of TC was recorded at household water (422.17± 1.5) and the lowest value was recorded at well water (47.17± 6.7). Regardless of the TTC there was statistically significant difference among well, tap, reservoir and household water at p < 0.01. The higher average value of TTC was recorded for household water (2.0±0.1) and the lowest value was recorded for reservoir water (0.0±0.0) (Table 2).
Level of risk of contamination of water sources
To identify causes of contamination and the risks of future contamination of drinking water sources, sanitary inspection is important to show level of contamination (Tsega et al., 2013). In the case of risk classification (Table 3), all well water samples had medium sanitary risk scores for TTC count. Similarly, all reservoir water samples had low sanitary risk score for TTC. The overall risk-to-health status of tap water samples, 9 (30%) and 21 (70%) of tap water samples had low and medium risk score for TTC, respectively. In the case of household storage containers, 3 (10%) and 27 (90%) water samples had high and very high sanitary risk score for TTC, respectively. In the case of TTC, 8 (27%) and 22 (73%) household storage container water samples had low and medium sanitary risk score, respectively. The results of sanitary inspection support the presence of high bacteria counts in household storage container drinking water samples and indicated that the water has been faecally contaminated.
The physicochemical results of water sources
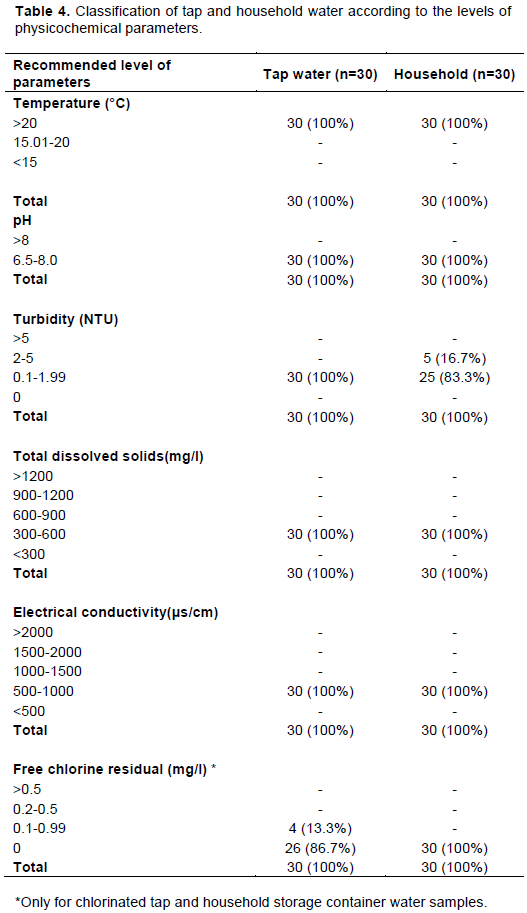
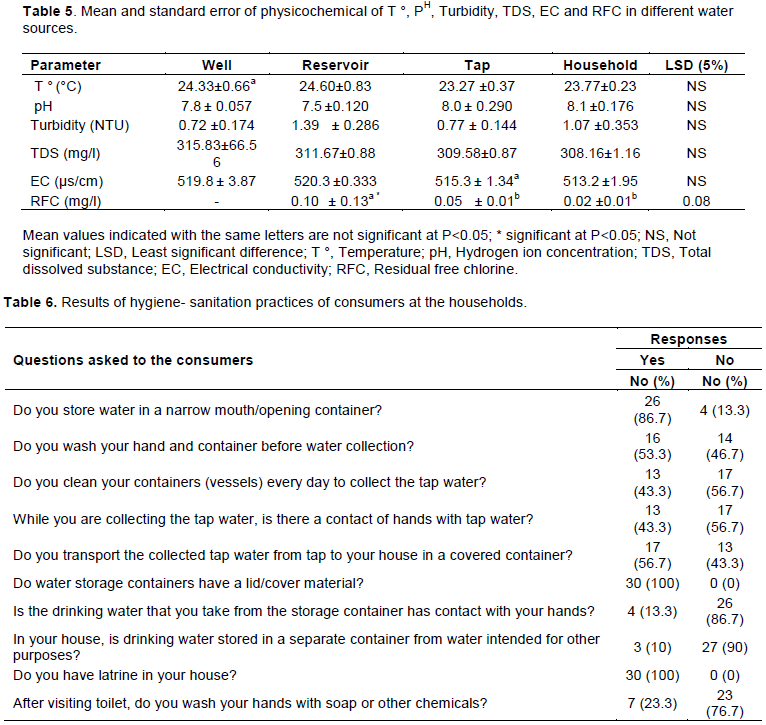
Physicochemical analysis of drinking water samples taken from different sites of Woreta town is presented in Tables 4 and 5. The water quality of wells, reservoir, taps and household storage containers were carried out by using the physicochemical parameters like temperature, pH, turbidity, total dissolved substance, electrical conductivity and residual free chlorine. All the measured parameters obtained from different water sampling sites were within the WHO standards of drinking water except temperature and residual free chlorine.
In the case of temperature analyses of wells, reservoir, taps and household storage containers water samples, all water samples had temperature above 20°C which were beyond the recommended value of WHO (<15°C). All water sources had pH value in the range of 6.5-8.0 which were in the recommended value of WHO (6.5-8.0). The result of turbidity of all water samples were in the range of 0.1-1.99 NTU which were in the recommended value of WHO (<5 NTU). The mean measurements of total dissolved substance (TDS) and electrical conductivity (EC) were between 309.58 - 382.50 mg/ l and 513.2 - 520.3 μs/cm, respectively. The mean value of residual free chlorine (RFC) in the reservoir, taps and household storage container water samples were between 0.02- 0.10 mg/l which is less than the value recommended by WHO. The reasons might be due to irregular chlorination, presence of high bacterial load, high temperature and organic matter. The recommended WHO value of RFC in drinking water was from 0.2-0.5 mg/l. Therefore, the water samples were safe for drinking purpose in terms of pH, TDS and EC except temperature and residual free chlorine. The results of ANOVA test showed that there was a statistically significant difference in free residual chlorine among reservoir, tap and household water samples at p<0.05. The highest RFC value was recorded at the reservoir (0.10 ± 0.01) and the lowest value was recorded at the household water samples (0.02 ±0.01). But there was no statistically significant difference in temperature, turbidity, pH, conductivity and total dissolved substance among wells, reservoir, taps and household storage container water samples (Table 5).
Hygiene-sanitation practices of consumers at household storage containers
The results of questionnaire survey on hygiene-sanitation practices of consumers at household are shown in Table 5. According to the respondents’ responses, 26 (86.7%) of consumers collect their drinking water in a narrow mouth containers, 16 (53.3%) wash their hands and containers before water collection, 13 (43.3%) clean their containers (vessels) everyday, 17 (56.7%) collect water from tap without contact with their hands and 17 (56.7%) transport the collected tap water to house in a covered container. All respondents replied that they store water in a container which has cover. Four responded that they take water from their container with contact with their hands and three had separate water container for storing drinking water in the house. All respondents had latrines in their house and 7 (23.3%) answered that they wash their hands with water only after visiting toilet. As indicated in Table 6, using TC as bacteriological indicator to determine the overall risk to health status showed that majority of the household water containers were at high risk score. Using TTC, the majority household water containers were at intermediate risk score. Therefore, inappropriate cleaning of storage water containers, poor sanitation and poor hygienic practices of consumers in household water containers were the main factors for the contamination of stored water at home. Moreover, there was no strong tradition of hand washing with soap after defecation. This might be a because of chronic water shortage, lack of surplus cash to purchase soap and a general lack of awareness about the importance of hand washing.
Adequate, safe and accessible supply of drinking water is essential to sustain life. The World Health Organization recommends that drinking water intended for consumption be free from total TC and TTC, since the presence of these indicator bacteria indicates a potential health risk for consumers (WHO, 2012). However, in this study the result showed that the average count of TC and TTC from wells, reservoir, taps and household storage containers water samples were above the recommended value of WHO (0 CFU/100 ml). In the case of bacteriological analysis of wells in this study all (100%) and 50% water samples were contaminated with TC and TTC, respectively. The same study done in Mali (Diakite et al., 2019) indicated 1.75% of the well water samples were contaminated by TC and TTC which was less than this study. The same study done in Fatrta Woreda, Ethiopia indicated 22 (91.7%) well water samples were not in compliance with WHO recommended values (0 CFU/100 ml) (Kassie and Hayelom, 2017). The possible contamination routes to wells might be agricultural activities, livestock grazing and sewage leakage. Bacteriological analyzes of TC and TTC from reservoir water samples indicated all water samples were contaminated with TC but in the case of TTC the water samples were incompliance with WHO standards (0CFU/100 ml). In a study done in Nepal (Panta et al., 2016), majority of water samples from reservoirs were contaminated with TC and TTC. In a study done in Adama town reported by Eliku and Sulaiman (2015), all reservoir water samples were in the acceptable limit of WHO (0 CFU/100 ml).
In this study, 30 (100%) and 22 (73.3%) of tap water samples were contaminated by TC and TTC, respectively. The result indicated the contamination level
is higher in tap water samples than well and reservoir water samples. A study done in Jima (Yasin et al., 2015) reported 66.67 % of tap water samples were negative for TTC. A previous study reported in Nekemte town of Ethiopia (Duressa et al., 2019) showed 100% of the tap water samples did not meet the TC standard (0 CFU/100ml) set by WHO, whereas about 37% of the samples failed to meet safe water quality with regard to TTC. Another study conducted in Bahir Dar city of Ethiopia indicated that 44.8% of tap water samples had TC whereas 40% of the tap water samples had TTC (Tabor et al., 2011).
The bacteriological analysis of water at household storage containers in this study indicated 30 (100%) of water samples were contaminated with TC and TTC. The results also indicated that more number of TC and TTC were encountered in household storage containers compared to wells, a reservoir and tap water sample which was in line as that reported in Nyala city of South Darfur (Abdelrahman and Eltahir, 2011). Another study conducted in Bahir Dar indicated that 19 (54.2%) and 12 (34.2%) household storage containers water samples had TC count from 10-100 and 1.01-9.99 CFU/100 and 16 (45.7%), 14 (40%), 1 (2.8%) household storage containers water samples had TTC counts ranging from 10-100, 1.01-9.99, and 0.01-1.01 CFU/100 ml, respectively (Tabor et al., 2011). Another study conducted in Ethiopia showed that poor sanitation and poor hygiene in household were the main factors for the contamination of water during transportation and after storage at home (WHO/UNICEF, 2010). A similar study done in Northwest Ethiopia has reported a similar finding with this study (Tsega et al., 2013). The high load of TC and TTC counts in the household storage containers water samples are likely to reflect lower personal hygiene, poor sanitation and handling practice of the consumers in collection and storage.
The sanitary inspection results showed that all (100%) wells of this study had sanitary risk score high and medium for TC and TTC, respectively. A study in Farta Woreda of Ethiopia (Kassie and Hayelom, 2017) revealed 15 (50%) of protected water resources had high sanitary score for E. coli contamination. The sanitary inspection results indicated 30 (100%) of household storage containers of this study had sanitary risk score low and medium for TC and TTC, respectively, which was in agreement a study done in Farta Woreda Ethiopia (Kassie and Hayelom, 2017). Contamination of water sources at different points due to inadequate protection and poor hygienic practices of consumers may contribute for the deterioration of drinking water.
In this study, selected physicochemical quality of well, reservoir, taps and household storage container water samples were analysed to assess public health implications on the consumers. Temperature is one of the physico-chemical parameter used to assess the quality of drinking water. The results of the study showed all water samples from different sampling sites had a temperature >20°C which was in agreement with the report made in Jima town (Yasin et al., 2015) and Nekemte town of Ethiopia (Durassa et al., 2019). Similarly, earlier studies in Bahir Dar city (Tabor et al., 2011) reported a mean temperature of 23.8°C. Temperature could affect the quality of drinking water by reducing the solubility of gases and affecting the rate of chemical reaction (Yasin et al., 2015).
The pH of water samples from all water sources was within the range of 6.5-8 which is in the recommended standards of WHO (6.5-8). Though pH has no direct effect on the human health, all the biochemical reactions are sensitive to variation of pH (Nidhi, 2018; Gupta and Sunita, 2009). A similar study conducted in Abeokuta, Nigeria, showed that a pH value ranging 6.8-7.1 was recorded (Shittu, 2008). The turbidity of all water samples from wells, reservoir, taps and household storage containers were in the range of 0.1-5NTU and all of them were below WHO standards (<5NTU). For the results of other similar study in Nekemte town (Duressa et al., 2019) the turbidity of the tap water samples was in the range of 0.1–1.7 NTU. High level of suspended organic matter and microorganisms often cause high level of turbidity in drinking water. High level of turbidity can stimulate the growth of bacteria and can protect pathogenic microorganisms from the effects of disinfectants (Yasin et al., 2015). The TDS measurements of water samples from wells, reservoir, taps and household container water samples were in the range of 300-600 mg/l. The TDS values of water samples from all sources were in the acceptable standard of 600 mg/l (WHO, 2006b). However, for the study done in Nekemte town (Duressa et al., 2019), the TDS measurements of the tap water samples were in the range of 37–46.5 mg/l which was below the maximum acceptable standard of 600 mg/l. The electrical conductivity (EC) measurements of water samples from different sampling points of this study were in the range of 500-1000 μs/cm. For the research conducted in Nekemte (Duressa et al., 2019), the electrical conductivity (EC) measurements of water samples were found to be in the range of 58 –70 μs/cm which is much lower than for this study. In this study, all chlorinated water samples had a mean value of RFC 0.10 mg/ which was below the recommended limit of WHO (0.2 - 0.5 mg/l) which was in line with the report in Kote town (Roopavathi et al., 2016). The low level of residual free chlorine might be due to non-continuous disinfection process at the disinfection point, less concentration of RFC and the presence of high level of bacterial load and organic matter.
This study reveals that majority of drinking water samples were unsafe for consumption. There was an increase in bacterial indicator counts as the water moves from the wells to household level (point-of-consumption). The number of TC and TTC were not in compliance with the WHO guideline value 0 CFU/100 ml. Therefore, high counts of indicator organisms in majority water samples suggested the presence of pathogenic organisms that constitute a threat to anyone consuming these water sources. Sanitary inspection matrixes on health score of wells, reservoir, taps and household storage containers water samples indicated the majority were classified as high risk, while some were at medium risk. Insufficient and irregular chlorination, poor sanitation and hygiene practices have contributed to the higher level of bacterial contamination of water from wells to point-of-consumption. There should be a continuous chlorination of drinking water and awareness creation about hygiene and sanitation to maintain safe drinking water at household level.
The successful completion of this research would not have been possible without the generous support of several people. I would like to take this occasion to thank Bahir Dar town water supply office laboratory technicians who helped with the materials and ideas throughout my work. Furthermore, I would like to thank those respondents involved in the interview to assess the hygienic-sanitation practices of the consumers in the study area.
The author has not declared any conflict of interests.
REFERENCES
|
Abdelrahman AA, Eltahir YM (2011). Bacteriological quality of drinking water in Nyala, South Darfur, Sudan. Environmental monitoring and assessment 175(1-5):37-43.
Crossref
|
|
|
|
Agbo B, Ogar A, Akpan U, Mboto C (2019). Physico-Chemical and Bacteriological Quality of Drinking Water Sources in Calabar Municipality, Nigeria. Journal of Advances in Microbiology 14:1-22.
Crossref
|
|
|
|
|
APHA (1998). American public health association: Standard methods for examination of water and wastewater (20thEd.). Washington, DC.
|
|
|
|
|
Bedada TL, Mezemir WD, Dera FA, Sima WG, Gebre SG, Edicho RM, Biegna AG, Teklu DS,Tullu KD (2018). Virological and bacteriological quality of drinking water in Ethiopia, Applied Water Science 8(2):70.
|
|
|
|
|
Roopavathi C, Mamatha SS, Raju NS (2016). Assessment of physicochemical and bacteriological drinking water quality of different sources of H.D. Kote town, Mysore district, International Journal of Engineering Research and Application 6(7):45-51.
|
|
|
|
|
Diakiten H, Gao Y, Toure A (2019). Assessment of the Microbiological Quality of Drinking Water in Light of Water Quality in the Pelengana Commune of Segou Region. Computational Water, Energy, and Environmental Engineering 8(3):79-89.
Crossref
|
|
|
|
|
Duressa G, Assefa F, Jida M (2019). Assessment of Bacteriological and Physicochemical Quality of Drinking Water from Source to Household Tap Connection in Nekemte, Oromia, Ethiopia. Journal of environmental and public health pp. 1-7.
Crossref
|
|
|
|
|
Eliku T, Sulaiman H (2015). Assessment of physico-chemical and bacteriological quality of drinking water at sources and household in Adama Town, Oromia Regional State, Ethiopia. African Journal of Environmental Science and Technology 9(5):413-419.
Crossref
|
|
|
|
|
Gupta DP, Sunita Saharan JP (2009). Physiochemical Analysis of Ground Water of Selected Area of Kaithal City (Haryana) India. Researcher 1(2):1-5.
|
|
|
|
|
Jain N (2018). Physico-chemical assessment of water quality in one Part of Hinjewadi, Pune Maharashtra India. Hydrology Current Research 9(291):2.
Crossref
|
|
|
|
|
Kassie G, Hayelom H (2017). Bacteriological quality of drinking water from source to point of use among rural communities of Farta Woreda in North West, Ethiopia. African Journal of Microbiology Research 11:1069-1074.
|
|
|
|
|
Malhotra S, Sidhu SK, Devi P (2015). Assessment of bacteriological quality of drinking water from various sources in Amritsar district of northern India. J Infect Dev Ctries 9:844-848.
Crossref
|
|
|
|
|
Mmuoegbulam O, Bassey I, Unimke A, Igwe E (2017). Bacteriological and Physicochemical Quality of Malabor Hostel Tap Water - University of Calabar, Nigeria. Annual Research and Review in Biology 13:1-12.
Crossref
|
|
|
|
|
Ministry of Health (MoH) (2005). National Hygiene and Sanitation Strategy, Ministry of Health of the Federal Democratic Republic of Ethiopia and WSP-Africa.
|
|
|
|
|
MoWR (2007). Ethiopian water resources management policy, Addis Ababa, Ethiopia.
View
|
|
|
|
|
Mulamattathil S, Bezuidenhout C, Mbewe M (2015). Analysis of physico-chemical and bacteriological quality of drinking water in Mafikeng, South Africa. Journal of water and health 13(4):1143-1152.
Crossref
|
|
|
|
|
Nourani M, Peyda M, Eslami A (2007). Microbiological quality assessment of rural drinking water supplies in Iran. Journal of Agriculture and Social sciences 3(1):31-33.
|
|
|
|
|
Panta ND, Poudyal N, Bhattacharya SK (2016). Bacteriological Q uality of Drinking Water S ources and Reservoirs S upplying Dharan M unicipality of Nepal, Annals of Clinical Chemistry and Laboratory Medicine 2:19-23.
Crossref
|
|
|
|
|
Shittu OB, Olaitan JO, Amusa TS (2008). Physico-Chemical and Bacteriological Analyses of Water Used for Drinking and Swimming Purposes in Abeokuta, Nigeria. African Journal of Biomedical Research 11:285-290.
Crossref
|
|
|
|
|
Tabor M, Kibret M, Abera B (2011). Bacteriological and physicochemical quality of drinking water and hygiene-sanitation practices of the consumers in bahir dar city, ethiopia. Ethiopian Journal of health sciences 21(1):19-26.
Crossref
|
|
|
|
|
Tamberker D, Banginwar Y (2008). Studies on intervention for controll of waterborne diseases: promoting personal and domestic hygiene in hotel's/restaurant's owner and workers. Journal of Comparative Toxicology and Physiology 1:267-276.
|
|
|
|
|
Tsega N, Sahile S, Kibret M, Abera B (2013). Bacteriological and physico-chemical quality of drinking water sources in a rural community of Ethiopia. African health sciences 13(4):1156-1161.
Crossref
|
|
|
|
|
World Water Assessment Programme (UNWATER/WWAP) (2004). United Nations Educational, Scientific, and Cultural Organization World Water Assessment Program. National Water Development Report for Ethiopia. Addis Ababa.
|
|
|
|
|
World Health Organization (WHO) (2006a). Meeting the millennium development goal drinking water and sanitation target: the urban and rural challenge of the decade, Geneva.
|
|
|
|
|
World Health Organization (WHO) (2006). Guidelines for Drinking Water Quality, 1st Addendum to the 3rd Edition Recommendations, World Health Organizations, Switzerland, Geneva.
|
|
|
|
|
World Health Organization (WHOb) (2012). Rapid assessment of drinking-water quality: a handbook for implementation, Geneva.
|
|
|
|
|
World Health Organization/United Nations International Children's Emergency Fund (WHO/UNICEF) (2010). Rapid assessment drinking water quality in the Federal Democratic Republicof Ethiopia, Country Report of Pilot Project Implementation in 2004-2005. WHO, Geneva and UNICEF, New York.
|
|
|
|
|
World Wide Security Organistion (WWSO) (2015). Woreta town Water Service Office Annual Report, Woreta.
|
|
|
|
|
Yasin M, Ketema T, Bacha K (2015). Physico-chemical and bacteriological quality of drinking water of different sources, Jimma zone, Southwest Ethiopia. BMC Res Notes 8(1):541.
Crossref
|
|