ABSTRACT
Litter decomposing macrofungi (LDM) and ectomycorrhiza (ECM) play vital roles in maintenance of forest ecosystem. Since these soil-litter dwelling fungi produce lignolytic enzymes, they have been proved useful in soil bioremediation. However, literature of these groups is limited and therefore it is important to record and identify them. This study reports the diversity of litter growing macrofungi in three sal (Shorea robusta C.F. Gaertn.) dominated small forests, that is, Bethuadahari Wildlife Sanctuary (BWS), Ranaghat Forest (RF) and Zafarnagar Forest (ZF) of Nadia, West Bengal India. During the study period (2013 and 2014) 10,253 carpophores, belonging to 37 macrofungal species were sampled and 17 edible, 14 inedible and 4 poisonous species were identified based on previous records. Podoscypha elegans (G. Mey.) Pat. was recorded in India for the first time. Only 7 ECM (~18.91%) and 30 saprophytic (~81.08%) species were recorded. The differences of diversity pattern in the three forests varied significantly. Shannon and Brillouin indices were highest in BWS suggesting the most diverse fungal community in terms of α diversity whereas; β and Taxonomic diversity studies suggested that RF was the most heterogeneous forest among the sampled forests.
Key words: Brillouin, diversity, ectomycorrhiza, litter decomposing macrofungi, Shannon.
India is a mega-diversity nation having a forest cover of 697,898 km2 occupying 21.23% of the land area (State of Forest Report, 2011-2012) and is endowed with rich fungal flora (Manoharachary et al., 2005). Fungi are one of the most under-studied and under-protected groups (Minter, 2011) and thus, need special attention.
Saprotrophic decomposer fungi, mutualistic mycorrhizal fungi and parasitic fungi are the main functional groups which inhabit the forest litter (Simard and Austin, 2010). Some fungi of the first group and ectomycorrhiza (ECM) produce macroscopic carpophores and are referred to as macrofungi.
Litter decomposing macrofungi (LDM) colonize the forest litter and play a major role in litter decomposition (Osono, 2015) while ECM, is considered essential for the growth and health of forest tree species (Courty et al., 2010). Unfortunately, record of these groups is limited. Both ECM and LDM play vital roles in forest nutrition cycle (Cairney and Meharg, 2002). LDMs assume signi-ficance because a number of attempts have been made by different workers to exploit their lignolytic enzymes arsenal for bioremediation (Anastasi et al., 2013). The bioremediation property of both LDMs (Baldrian and Šnajdr, 2006; Liers et al., 2013) and ECM (Casieri et al., 2010) has been documented. Decontamination of pollutants from soil, water etc by the use of microorga-nisms is denoted as bioremediation (Rhodes, 2012) and this process is thought to be highly advantageous in recent years over other conventional processes (Ali, 2010). The forest area in West Bengal is around 11,879 km2 occupying 13.38% land area and Nadia accounts for merely 0.30% (12 km2) of this (State Forest Report, West Bengal 2011-12). Forests of Nadia are tropical moist deciduous broad leafed ones dominated by Shorea robusta C.F. Gaertn. (Dipterocarpaceae). The forest cover of the district is very low and is patchy in nature. Such a condition prevails in all other districts of tropical moist climate of West Bengal (Maldah, Murshidabad, Barddhaman, Hugli, Haora, Eastern parts of Bankura, West and East Medinipur and the Northern parts of North and South 24-Parganas).
With this in view, the current study intended to record the occurrence of this important but less studied group of macrofungi in three forests of Nadia District of West Bengal, India. Detailed survey were undertaken to also study the a, b and taxonomic diversity of the LDM species. This type of diversity study with LDM is the first of its kind in this area.
Study areas
In the three forests the dominant tree is S. robusta (Dipterocarpaceae) along with other species like Swietenia mahagoni (Meliaceae), Tectona grandis (Lamiaceae), Terminalia arjuna (Combretaceae), Mesua ferrea, Diospyros blancoi (Ebenaceae), and Saraca asoca (Fabaceae). The tree density differed in the three forests, BWS (~67 ha) being the densest among them. BWS is a protected forest while RF (~34 ha) and ZF (~29 ha) are not protected. The distance between BWS and ZF is ~52 km while between BWS and RF is ~56.5 km.
Sampling, identification and diversity analysis
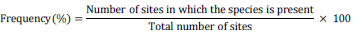
Forest areas were surveyed at intervals of 7 days from January 2013 till December 2014 and identified based on morpho-anatomical characterization and literature (Butler and Bisby, 1960; Arora, 1986) studies. P. elegans was further identified based on sequencing of 18S rDNA and NCBI blast. The sequence was published in NCBI genebank. Sampling was carried out in fixed random plots of 25 × 25 m2 marked as B1 to B10 in BWS (that is, 10 plots), R1 to R7 in RF and Z1 to Z7 in ZF (that is, 7 plots each in RF and ZF). The total number of different species and individuals were recorded. Frequency of occurrence (F) was calculated after Tapwal et al., (2013) as follows:
Based on frequency percentage (F) the fungal species were classified in 4 categories as (1) Very Low occurring (F value =1-20), (2) Low occurring (F value =21-40), (3) Moderately occurring (F value =41-60) and (4) High occurring (F value =61-100).
All diversity analyses were done by PAST-3.11 software (Hammer et al., 2001). The different α-diversity indices namely Taxa S, Number of Individuals, Shannon (H) and Brillouin were calculated for each plot selecting percentile type bootstrap of 9999 replicates. The mean of Shannon (H) and Brillouin indices for each forest were calculated. Individual based rarefaction curve was constructed from the pooled data over two years. Whittaker β diversity (βW) was calculated from the presence-absence data. Taxonomic distinctness and taxonomic diversity (Clarke and Warwick, 1998) with pooled 95% confidence (conditional method) were calculated.
Collection and identification
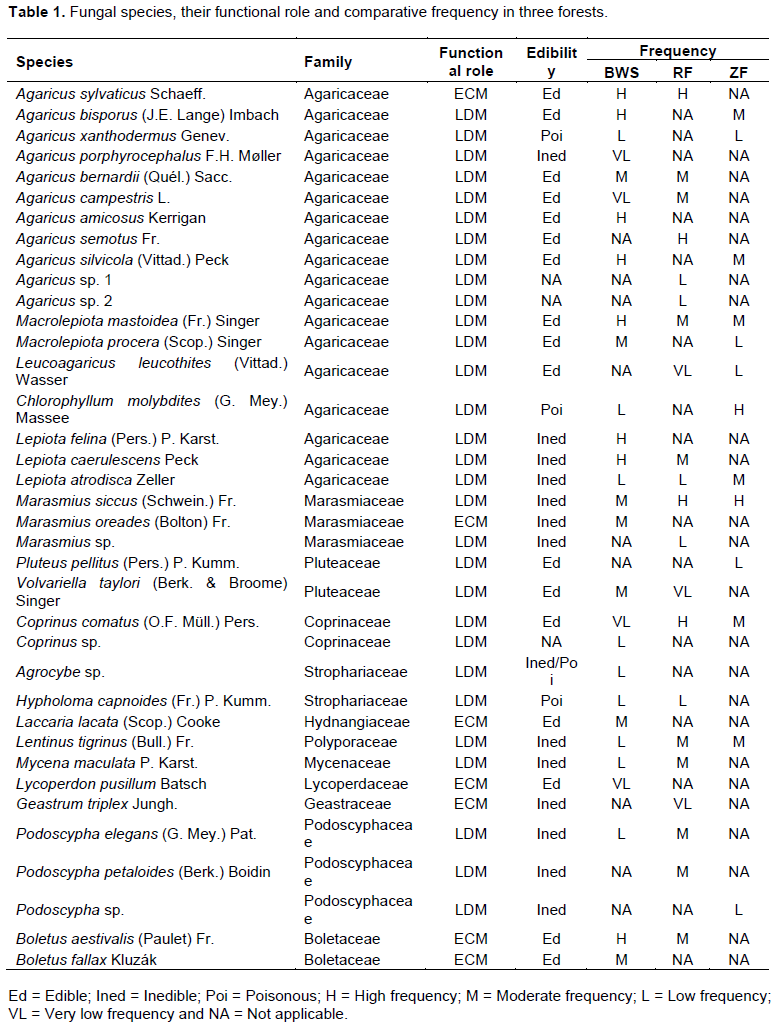
Altogether 5754, 2556 and 1943 numbers of carpophores were surveyed from BWS, RF and ZF respectively and 37 species were recognized (Table 1; Supplementary File 1) and classified into 18 genera of 12 basidiomycetous families. Two species of Agaricus and one species each of Marasmius, Coprinus, Agrocybe and Podoscypha could not be identified due to lack of literature. P. elegans was recorded for the first time in India. The identity of the species was further confirmed by 18S rDNA sequencing and blast analysis and the sequence was published in NCBI GenBank (Accession number: KP966113.1). The species was found growing on both wood litter and on soil-litter in BWS and RF during June to August.
28 fungal species belonging to 12 fungal families were recorded in BWS (Table 1), among which Agaricaceae represented the largest family. In RF, 21 species were recorded belonging to13 genera and 10 families while in ZF a total of 13 species were recorded among 10 genera and 6 families.
17 edible, 14 inedible and 4 poisonous (Table 1) species were recognized and only 7 species, previously reported as ECM, were recorded of which 6 namely Agaricus sylvaticus, Marasmius oreades, Laccaria lacata, Lycoperdon pusillum, Boletus aestivalis and B. fallax were present in BWS while 3, viz. A. sylvaticus, Geastrum triplex and Boletus aestivalis were recorded from RF and none was recorded from ZF.
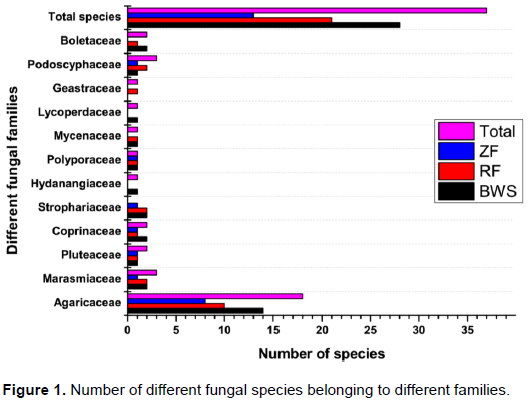
Agaricaceae was the most dominant fungal family in terms of number of species (Figure 1). Five genera and 18 spp. of Agaricaceae were found in the three forests of which the maximum (14 spp.) were documented in BWS, followed by RF (10 spp.) and ZF (8 spp.). The genus Agaricus showed maximum of 11species (Table 1), of which 8, 6 and 3 were present in BWS, RF and ZF respectively. Among the other families, Marasmiaceae (Marasmius siccus, Marasmius oreades and Marasmius sp.) and Podoscyphaceae (Phaps elegans, Phaps petaloides and Podoscypha sp.) were the second most abundant having three species each.
Comparative frequency of different species in three forests
Based on frequency percentage (F) (Table 1), the frequency of the fungal species was found considerably different among forests.
In BWS, 4 very low occurring spp. (A. porphyrocephalus, A. campestris, C. comatus and L. pusillum) 9 low occurring spp. (A. xanthodermus, C. molybdites, L. atrodisca, Coprinus sp., Agrocybe sp., H. capnoides, L.tigrinus, M. maculata and P. elegans), 7 moderately occurring species (A. bernardii, M. procera, M. siccus, M. oreades, V. taylori, L. lacata and B. fallax) and 8 high occurring species (A. sylvaticus, A. bisporus, A. amicosus, A. silvicola, M. mastoidea, L. felina, L. caerulescens, and B. aestivalis) were recorded. In RF, L. leucothites, V.taylori and G. triplex comprised the very low occurring group, Agaricus sp. 1, Agaricus sp. 2, L. atrodisca, Marasmius sp. and H. capnoides comprised the low occurring group. 9 moderately occurring (A. bernardii, A. campestris, M. mastoidea, L. caerulescens, L. tigrinus, M. maculate, P. elegans, P. petaloides and B. aestivalis) and 4 high frequency species (A. sylvaticus, A. semotus, M. siccus and C. comatus) were also found in RF. In ZF the low occurring species were A. xanthodermus, M. procera, L. leucothites, P. pellitus and Podoscypha sp. 1 while the moderately occurring species were A. bisporus, A. silvicola, M. mastoidea, L. atrodisca, C. comatus and L. tigrinus and the high occurring species comprised of C. molybdites and M. siccus and no very low frequency species was recorded. Only 5 species (M. mastoidea, L. atrodisca, M. siccus, C. comatus and L. tigrinus) were recorded in all three forests, but, their frequency was different.
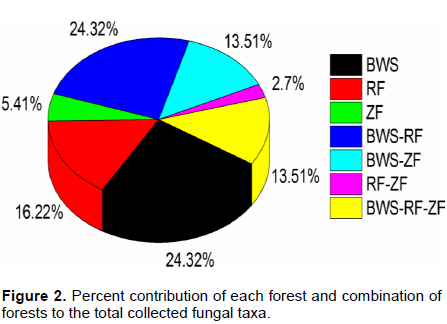
The different forests contributed different numbers of fungal taxa. Among the total, 9 species such as A. porphyrocephalus, A. amicosus, L. felina, M. oreades, Coprinus sp., Agrocybe sp., Laccaria lacata, L. pusillum and B. fallax were exclusive to BWS. Similarly 6 species (A. semotus, Agaricus sp. 1, Agaricus sp. 2, Marasmius sp., G. triplex and P. petaloides) and 2 species (P. pellitus and Podoscypha sp.) were limited to RF and ZF respectively. BWS and RF shared 9 species, while 5 species were shared by BWS and ZF (Table 1). Only one species, that is, L. leucothites was common in RF and ZF and 5 species were common in all the three forests. BWS contributed maximum fungal taxa singly. Percentage contribution of each forest in terms of total fungal species is presented in Figure 2.
Study of α-diversity
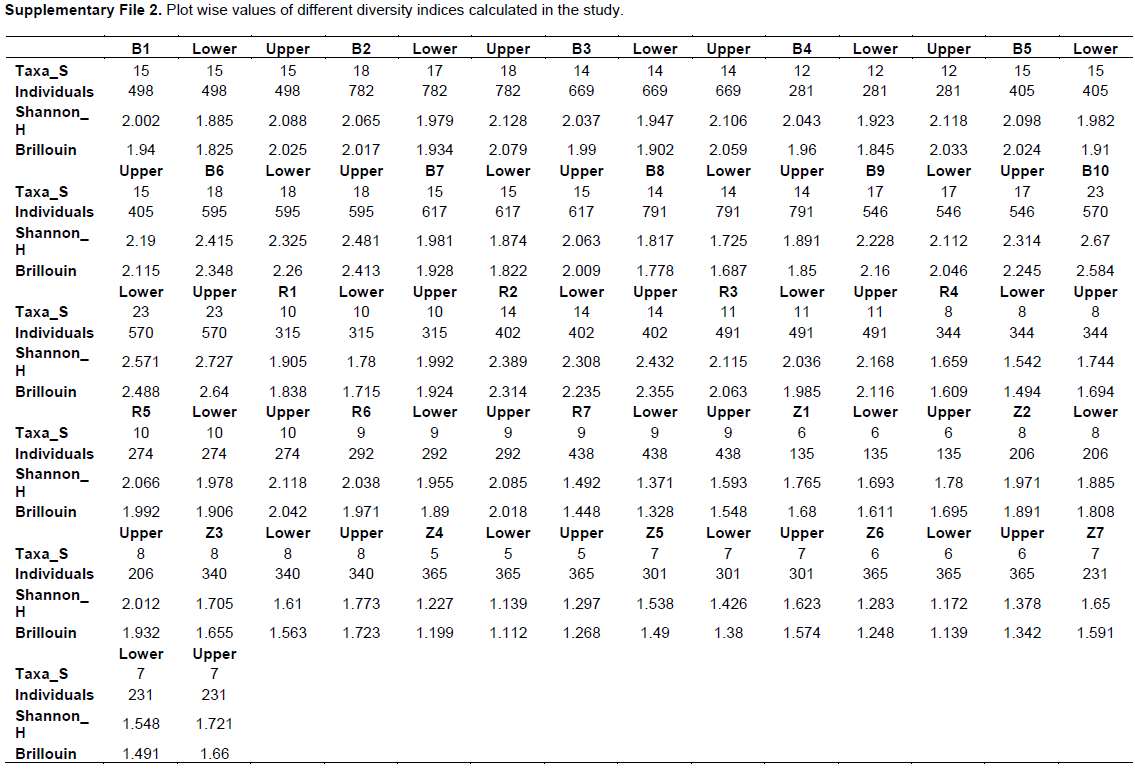
The different diversity indices such as Taxa S, Number of Individuals, Shannon (H) and Brillouin were calculated (Supplementary File 2). Maximum Taxa-S was recorded in B-2 and B6 (18 spp.) and minimum in Z-4 (5 spp.).
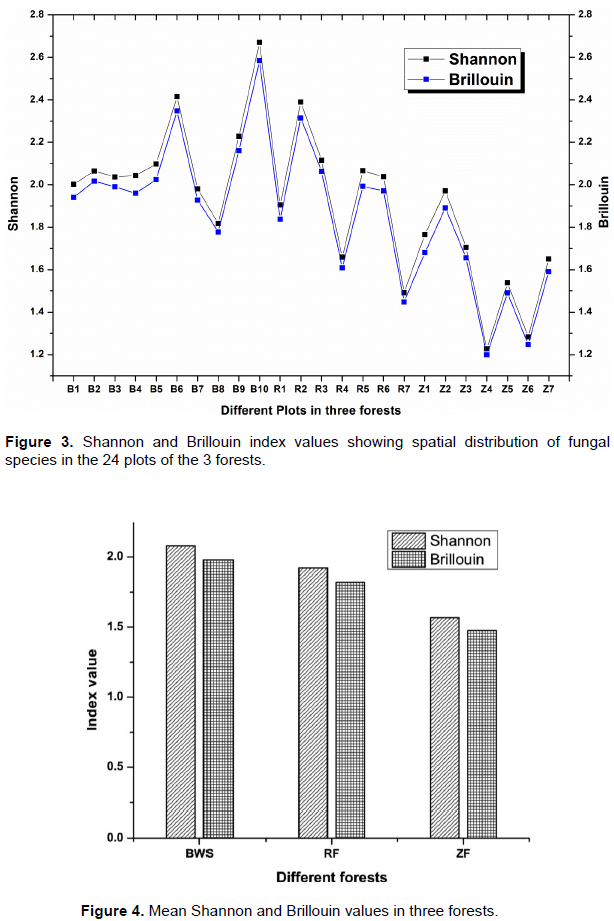
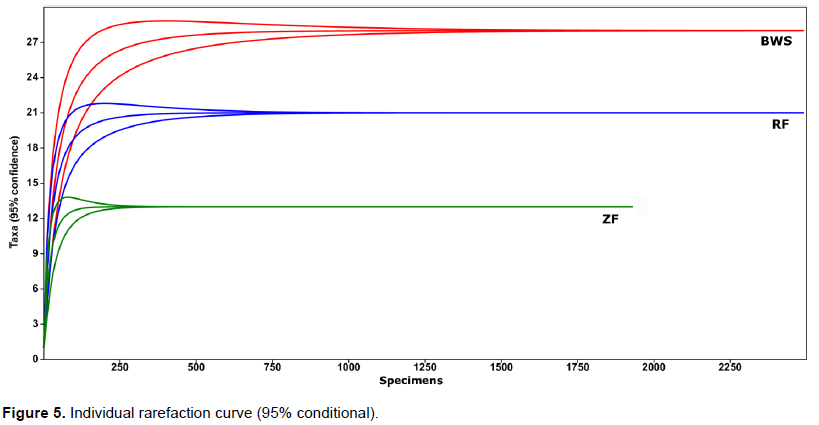
Plot wise Shannon (Figure 3) ranged from 1.81 (B-8) to 2.67 (B-10) in BWS, 1.49 (R-7) to 2.38 (R-2) in RF and 1.22 (Z-4) to 1.97 (Z-2) in ZF. The lowest and highest Shannon values among all 24 plots were recorded at Z-4 (in ZF) and B-10 (in BWS) respectively. The mean Shannon (Figure 4) for the three forests was 2.07, 1.92 and 1.56 in BWS, RF and ZF respectively. Plot-wise Brillouin (Figure 3), ranged from 1.77 (B-8) to 2.58 (B-10) in BWS, 1.44 (R-7) to 2.31 (R-2) in RF and 1.19 (Z-4) to 1.89 (Z-2) in ZF. The mean Brillouin (Figure 4) were 1.98, 1.82 and 1.47 in BWS, RF and ZF respectively. Comparative Mean Shannon and Brillouin (Figure 4) values were higher in BWS followed by RF and ZF.
Rarefaction
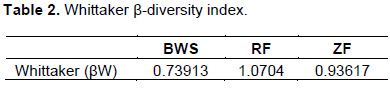
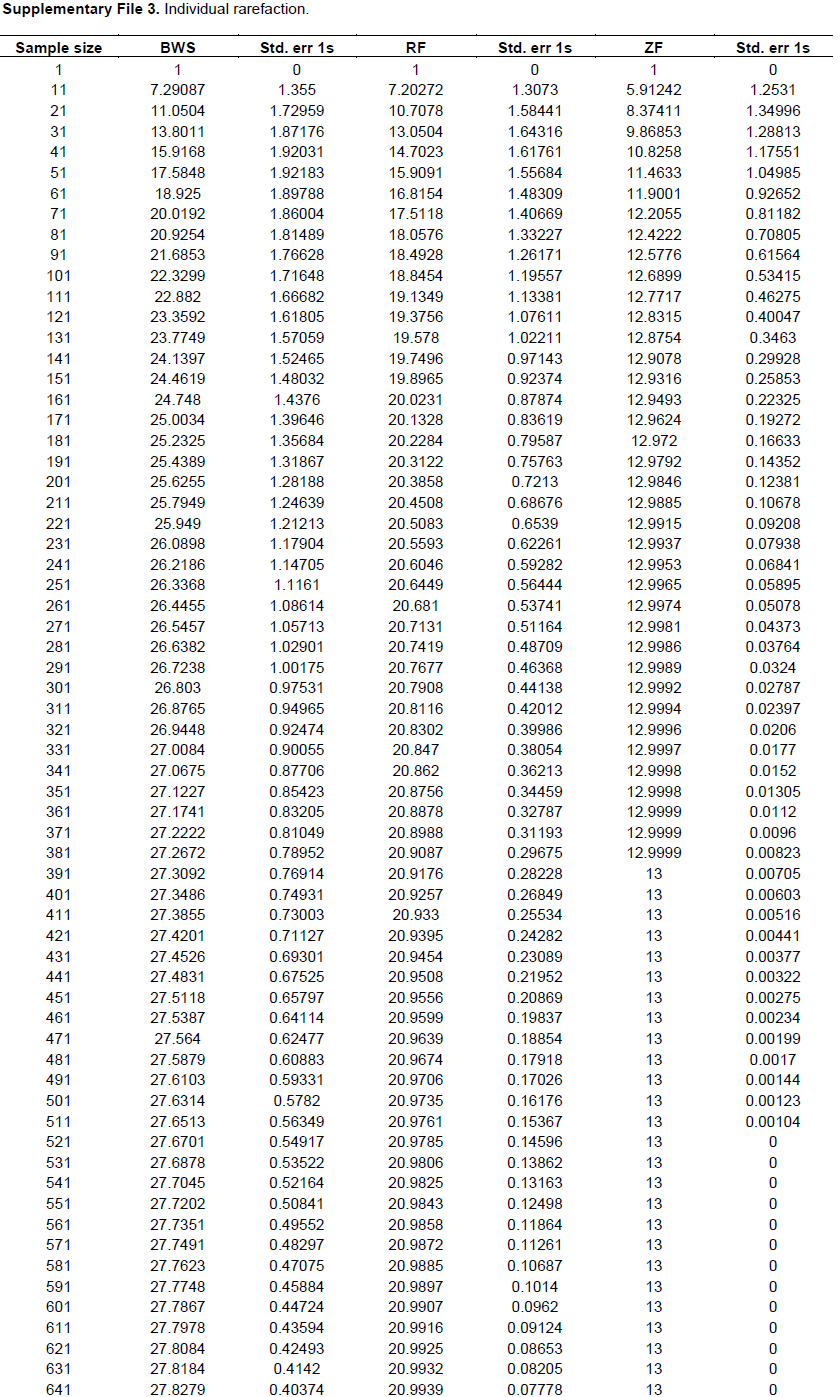
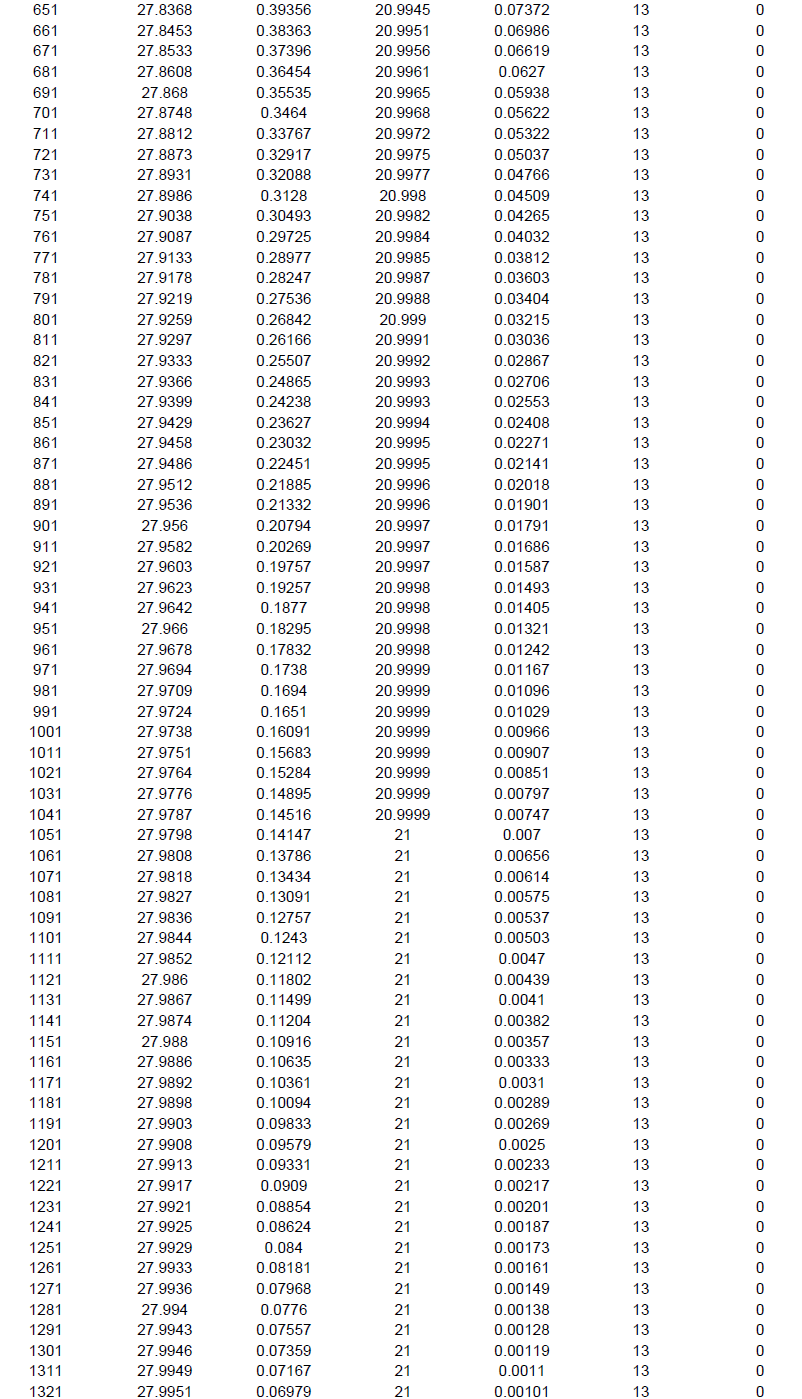
The individual based rarefaction curve (Figure 5; Supplementary File 3) showed highest species richness in BWS. Since, the curve line of ZF lies significantly lower than RF, species richness was lowest in ZF. At 101 sample size, 22.32, 18.84 and 12.68 specimens may be recorded in BWS, RF and ZF respectively.
β diversity
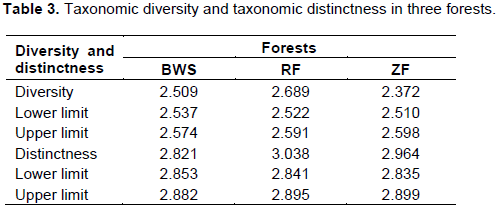
Whittaker (βW) results showed (Table2) that species composition differed in the three forests and RF had the highest βW (1.07) followed by ZF (0.93) and BWS (0.73). Thus, BWS showed more uniform and less heterogenous species composition while in RF the heterogeneity was the maximum and in ZF heterogeneity was medium.
Taxonomic diversity (∆) and taxonomic distinctness (∆*)
Results of ∆ showed (Table 3) that the diversity values were 2.50, 2.68 and 2.37 in BWS, RF and ZF respectively and maximum diversity was recorded in RF followed by BWS and ZF. The ∆* values (Table 3) for BWS, RF and ZF were 2.82, 3.03 and 2.96 respectively in an order of RF>ZF>BWS. Thus, in ZF the diversity (∆) among the taxa was low, but the distinctness (∆*) was higher.
Myco-vegetation in the litter layer of forests of Nadia
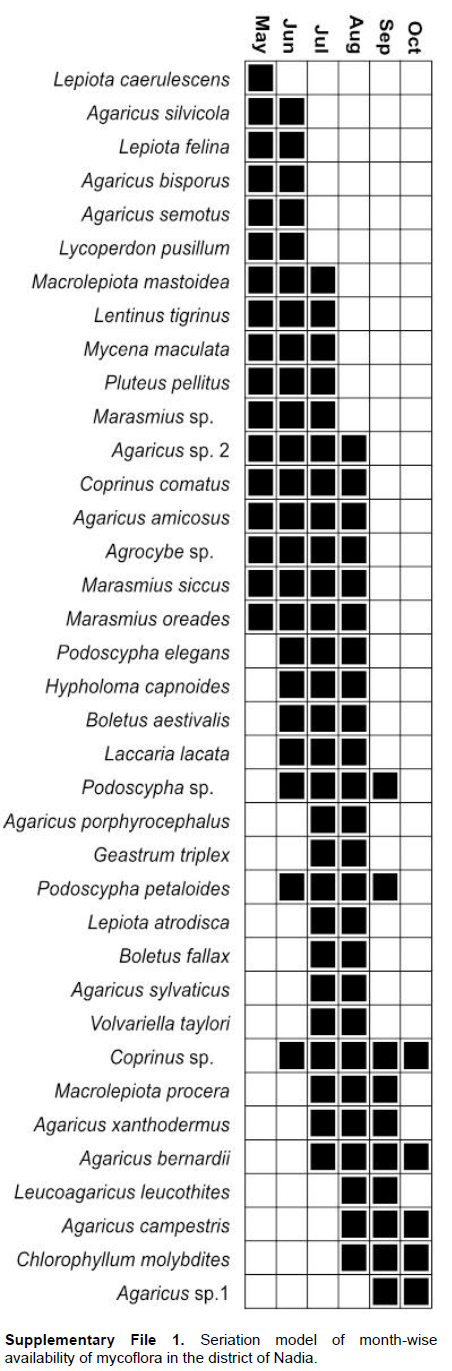
The transient nature of the carpophores makes fungal sampling challenging and to minimize the sampling error, pooled data was analyzed for overall presentation of fungal diversity in this study. Collections were done between May to October (2013-14) and no carpophores were found during December to April indicating that the pre-Monsoon, Monsoon and the cooler post-Monsoon periods (prior to winter) were favourable for fungal study in this region. The carpophores sprouted for varying periods from 1 to 5 months (Supplementary File 1).
There was also month-wise variation in the availability of LDMs (Figure 6) and 17, 23, 27, 25, 10 and 5 species were recorded during the months of May to October respectively. Maximum species were available during July (mid- Monsoon). The average rainfall recorded in the district of Nadia is 188.20, 955.00 and 118.40 mm in the pre-Monsoon, Monsoon and post-Monsoon periods respectively (Annual Flood Report, 2014).
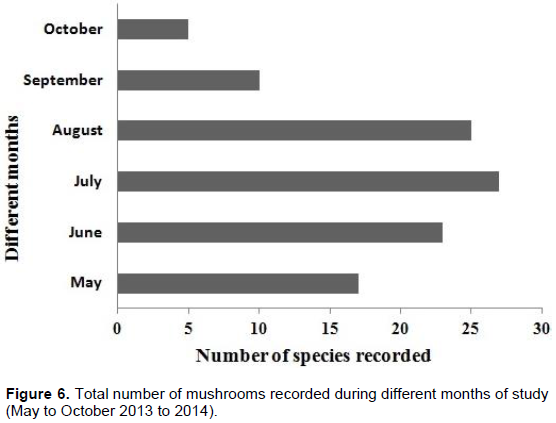
In this Gangetic plain of Nadia summer (April-May) is associated with nor’westers (a natural phenomenon locally known as Kal-Boishakhi). The carpophores sprout in shady, moist forest litter after such 2 to 3 spells of rain. Seventeen macrofungi were found growing in May in the three forests. With the onset of the Monsoon (mid-June to mid-September), the number of macrofungi increased. At the end of monsoon (September) excessive wetness of the forest floor resulted in slight reduction in their appearance October coincides with the post monsoon season and macrofungi became significantly lower during the period.
Spatial distribution of agaric fungi in forest floor is common and affected by biotic factors like host resources, interspecific interactions etc. (Yamashita and Hijii, 2006) while ECM distribution is further affected by under soil
root distribution (Matsuda and Hijii, 1998) and litter availability (Dahlberg et al., 1997). A similar spatial carpophore distribution was evidenced in the present study varying in between the different plots and also among the three forests.
Dipterocarp dominates the lowlands of South-East Asian forests (Slik et al., 2009) and they form ECM association (Brundrett et al., 1996). Such dipterocarp forests exist in the Indian sub-continent. The ECM constituents of such forests are unknown (Brearly, 2012) though ECM is essential for better health of such forests (Courty et al., 2010). However, their role in the tropical ecosystem is unclear (Brearley, 2012).
In the present study the percentage of ECM species was ~18.91% while in case of BWS the maximum ECM was recorded (~21.42%) followed by RF (~14.28%) and no ECM was recorded in ZF during the study. However, the presence of ECM in ZF cannot be ruled out since: (1) The undersoil diversity of ECM has been reported to be higher than that of the topsoil (Henkel et al., 2012).
Comparative study with other forest ecosystem
Comparison of fungal flora with other regions having similar or different geographical and climatic conditions is important for better understanding of myco-vegetation. Macrofungal diversity, including all groups, has previously been studied in West Bengal in different ecosystems. Dutta et al. (2013) recorded 62 species in 46 genera from the Sundarbans while Pradhan et al. (2016) reported 98 macrofungi (72 genera) including saprophytes, parasites and ECM, from Eastern Himalayas (Darjeeling). In their study 58.16% (a total of 57 species) were saprotrophs comprising of only one species of Agaricus. Only three species from the Sundarbans and five species from the Eastern Himalayas were common with the present study.
In similar studies in Assam, Gogoi and Prakash, (2015) reported 138 gilled mushrooms from wood and litter, belonging to 48 genera in 23 families. Baral et al. (2015) reported 115 macrofungi with Polyporaceae being the largest family from sal forests in central Nepal. Osono (2015) compared LDM diversity in subtropical, cool temperate and subalpine forests in Japan and recorded 35, 32, and 18 species respectively. Thus, the lower number of macrofungi in this study is due to the stress given on only LDMs. All other functional groups of forest fungi were not taken into account.
Agaricus comprised the dominant genera in the forests of Nadia, while Russula was dominant genera in both Darjeeling ecosystems of Eastern Himalayas and Assam. However, Usha and Janardhana (2014) found Agaricus to be the dominant genera in Parts of Western Ghats in Karnataka and reported 8 agaric species; while 11 species was recorded in this study.
Diversity pattern of fungi in the present study
Among the different α-diversity indices, Shannon increases as the richness and evenness of a community increases and it is common biodiversity index. However, Pielou (1966) suggested that Shannon must be applied when randomized samples are drawn from a community where the number of species is known. Since, the total number of macrofungi was not known Brillouin was used as it is more applicable where the composition of the community is not known (Pielou, 1975). Thus, Brillouin values were more interpretative as a measure of α-diversity and accordingly ranked the three forests as BWS>RF>ZF. BWS, being a protected land had lesser anthropogenic effect and also the forest being relatively dense, nurtured maximum number of macro-fungal species.
Since, in ecological analysis the number of species accumulates when sample size increases and thus, it is important to extrapolate the correlation between the number of species and sample size. Individual based rarefaction curve is a suitable way to express this relationship and in the present study at 101 sample size, 22.3299, 18.8454 and 12.6899 specimens may be recorded in BWS, RF and ZF respectively. Since, the rarefied sample (Figure 5) for the three forests was curved asymptotically parallel to the X axis no new species could be recorded as the curves reached their respective asymptotes.
Beta diversity (Whittaker, 1960) measures the differences in the composition of species between more than one local assemblages. For a given level of regional species richness, as there is an increase in beta diversity it is associated with the difference in individual localities more markedly from one another (Koleff et al., 2003). Thus, it may be applied to evaluate the extent to which two or more forests differ in terms of their species composition. In this study, Whittaker β (βW) was calculated for each forest area from the presence-absence data. Beta measures change when there are differences between the species composition among the sites and it becomes zero when the species composition among sites does not change. Though, BWS showed maximum α-diversity, in terms of β-diversity it was least heterogeneous while, in RF the heterogeneity was the maximum and in ZF heterogeneity was medium.
The present study indicated that having high α value does not ensure that the community should also have a high β value. We found BWS having highest α but lowest β values while RF had a medium α but highest β values indicating that both the components were self-determining in nature. The independence of β and α diversity is a much debated topic (Jost, 2007; Baselga, 2010; Jost, 2010) and the statistical independence of the two components is not essential as well as expected and, rather, is a basic pragmatic question in biodiversity (Jost, 2010). The independence largely depends on the nature of ecosystem under study as well as on the experimental procedure. Independence noted in this study may be the outcome of both or either of these factors. Thus, the small forests of Nadia accommodate a considerable number of LDM and ECM. Occurrence of P. elegans was a new addition to Indian fungal flora as it was recorded for the first time in two subtropical moist deciduous forests (BWS and RF) of India. Low and moderate frequencies of occurrence of the species were recorded in BWS and RF respectively. The study presents the inventory of fungal diversity in the region and provides baseline information of LDMs and ECMs for further research in this field. Such fungi, being litter and soil growing and having lignolytic enzymes similar to white rot fungi, have an advantage over the latter for better adaptability in soil and should therefore be assessed for their role in soil-bioremediation (Baldrian and Šnajdr, 2006; Liers et al., 2013; Osono, 2015). Hence identifying and studying the diversity of the LDM is of prime importance and further studies are required.
The authors have not declared any conflict of interests.
REFERENCES
|
Ali H (2010). Biodegradation of synthetic dyes- a review. Water Air Soil Pollut. 213:251-273.
Crossref
|
|
|
|
Anastasi A, Tigini V, Varese GC (2013). The bioremediation potential of different ecophysiological groups of fungi. In. Fungi as bioremediators. Springer Berlin Heidelberg. pp. 29-49.
Crossref
|
|
|
|
|
Annual Flood Report (2014 Internet). Government of West Bengal. Web. [cited 2016 April 27]. Available from:
View.
|
|
|
|
|
Arora D (1986). Mushrooms demystified. A comprehensive guide to the fleshy fungi. Ten Speed Press, Berkeley.
|
|
|
|
|
Baldrian P, Šnajdr J (2006). Production of ligninolytic enzymes by litter-decomposing fungi and their ability to decolorize synthetic dyes. Enzyme Microb. Technol. 39:1023-1029.
Crossref
|
|
|
|
|
Baral S, Thapa-Magar KB, Karki G, Devkota S, Shrestha BB (2015). Macrofungal diversity in community-managed sal (Shorea robusta) forests in central Nepal. Mycology 6:151-157.
Crossref
|
|
|
|
|
Baselga A (2010). Multiplicative partition of true diversity yields independent alpha and beta components; additive partition does not. Ecology 91:1974-1981.
Crossref
|
|
|
|
|
Brearley FQ (2012). Ectomycorrhizal associations of the Dipterocarpaceae. Biotropica 44:637-648.
Crossref
|
|
|
|
|
Brundrett M, Bougher N, Dell B, Grove G, Malajczuk N (1996). Working With Mycorrhizas in Forestry and Agriculture. ACIAR Monograph 32. ACIAR, Canberra.
|
|
|
|
|
Butler EJ, Bisby GR (1960). The Fungi of India. Indian Council of Agricultural Research, New Delhi.
|
|
|
|
|
Cairney JWG, Meharg AA (2002). Interactions between ectomycorrhizal fungi and soil saprotrophs: implications for decomposition of organic matter in soils and degradation of organic pollutants in the rhizosphere. Can. J. Bot. 80:803-809.
Crossref
|
|
|
|
|
Casieri L, Anastasi A, Prigione V, Varese GC (2010). Survey of ectomycorrhizal, litter-degrading, and wood-degrading Basidiomycetes for dye decolorization and ligninolytic enzyme activity. Antonie van Leeuwenhoek 98:483-504.
Crossref
|
|
|
|
|
Clarke KR, Warwick RM (1998). Taxonomic distinctness index and its statistical properties. J. Appl. Ecol. 35(4):523-531.
Crossref
|
|
|
|
|
Courty PE, Buée M, Diedhiou AG, Frey-Klett P, Le Tacon F, Rineau F, Turpaultd MP, Uroza S, Garbaye J (2010). The role of ectomycorrhizal communities in forest ecosystem processes: new perspectives and emerging concepts. Soil Biol. Biochem. 42:679-698.
Crossref
|
|
|
|
|
Dahlberg A, Jonsson L, Nylund JE (1997). Species diversity and distribution of biomass above and below ground among ectomycorrhizal fungi in an old-growth Norway spruce forest in south Sweden. Can. J. Bot. 75(8):1323-1335.
Crossref
|
|
|
|
|
Dutta AK, Pradhan P, Basu SK, Acharya K (2013). Macrofungal diversity and ecology of the mangrove ecosystem in the Indian part of Sundarbans. Biodiversity 14:196-206.
Crossref
|
|
|
|
|
Gogoi G, Parkash V (2015). A checklist of gilled mushrooms (Basidiomycota: Agaricomycetes) with diversity analysis in Hollongapar Gibbon Wildlife Sanctuary, Assam, India. J. Threat. Taxa 7:8272-8287.
Crossref
|
|
|
|
|
Hammer Ø, Harper DAT, Ryan PD (2001). PAST: Paleontological statistics software package for education and data analysis. Palaeontol. Electron. 4:1-9
|
|
|
|
|
Henkel TW, Aime MC, Chin MML, Miller SL, Vilgalys R, Smith ME (2012). Ectomycorrhizal fungal sporocarp diversity and discovery of new taxa in Dicymbe monodominant forests of the Guiana Shield. Biodivers. Conserv. 21:2195-2220.
Crossref
|
|
|
|
|
Jost L (2007). Partitioning diversity into independent alpha and beta components. Ecology 88:2427-2439.
Crossref
|
|
|
|
|
Jost L (2010). Independence of alpha and beta diversities. Ecology 91:1969-1974.
Crossref
|
|
|
|
|
Koleff P, Gaston KJ, Lennon JJ (2003). Measuring beta diversity for presence–absence data. J. Anim. Ecol. 72(3):367-382
Crossref
|
|
|
|
|
Liers C, Pecyna MJ, Kellner H, Worrich A, Zorn H, Steffen KT, Hofrichter M, Ullrich R (2013). Substrate oxidation by dye-decolorizing peroxidases (DyPs) from wood-and litter-degrading agaricomycetes compared to other fungal and plant heme-peroxidases. Appl. Microbiol. Biotechnol. 97:5839-5849.
Crossref
|
|
|
|
|
Manoharachary C, Sridhar K, Singh R, Adholeya A, Suryanarayanan TS, Rawat S, Johri BN (2005). Fungal biodiversity: distribution, conservation and prospecting of fungi from India. Curr. Sci. 89:58-71.
|
|
|
|
|
Matsuda Y, Hijii N (1998). Spatiotemporal distribution of fruitbodies of ectomycorrhizal fungi in an Abies firma forest. Mycorrhiza 8:131-138.
Crossref
|
|
|
|
|
Minter D (2011). Fungal conservation needs help from botanists. Plant. Biosyst. 145:945-949.
Crossref
|
|
|
|
|
Osono T (2015). Diversity, resource utilization, and phenology of fruiting bodies of litter-decomposing macrofungi in subtropical, temperate, and subalpine forests. J. For. Res. 20:60-68.
Crossref
|
|
|
|
|
Pielou EC (1966). Shannon's formula as a measure of specific diversity: its use and misuse. Am. Nat. 100:463-465.
Crossref
|
|
|
|
|
Pielou EC (1975). Ecological diversity. Wiley, New York.
|
|
|
|
|
Pradhan P, Dutta AK, Paloi S, Roy A, Acharya K (2016). Diversity and distribution of macrofungi in the Eastern Himalayan ecosystem. Eurasia J. Biosci. 10:1-12.
|
|
|
|
|
Rhodes CJ (2012). Feeding and healing the world: through regenerative agriculture and permaculture. Sci. Prog. 95:345-446.
Crossref
|
|
|
|
|
Simard S, Austin M (2010). The Role of Mycorrhizas in Forest Soil Stability with Climate Change. In. Simard S, editor. Climate Change and Variability, INTECH Open Access Publisher.
Crossref
|
|
|
|
|
Slik JWF, Raes N, Aiba SI, Brearley FQ, Cannon CH, Meijaard E, Nagamasu H, Nilus R, Paoli GD, Poulsen AD, Sheil D, Suzuki E, Van-Valkenburg JLCH, Webb CO, Wilkie P, Wulffraat S (2009). Environmental correlates for tropical tree diversity and distribution patterns in Borneo. Divers. Distrib. 15:523-532.
Crossref
|
|
|
|
|
State Forest Report (2011-2012 Internet). Government of West Bengal. [cited 2016 April 25].
|
|
|
|
|
Tapwal A, Kumar R, Pandey S (2013). Diversity and frequency of macrofungi associated with wet ever green tropical forest in Assam, India. Biodiversitas 14:73-78.
Crossref
|
|
|
|
|
Usha N, Janardhana GR (2014). Diversity of Macrofungi in the Western Ghats of Karnataka (India). Indian Forester 140:531-536.
|
|
|
|
|
Whittaker RH (1960). Vegetation of the Siskiyou mountains, Oregon and California. Ecol. Monogr. 30:279-338.
Crossref
|
|
|
|
|
Yamashita S, Hijii N (2006). Spatial distribution of the fruiting bodies of Agaricales in a Japanese red pine (Pinus densiflora) forest. J. For. Res. 11:181-189.
Crossref
|
|