A more sensitive and accurate high-performance liquid chromatography/electrospray ionization tandem mass spectrometry (HPLC-ESI-MS) method has been developed and validated simultaneously for analysis of three analytes. The method is sensitive, enough for the study of analyte pharmacokinetics and metabolic pathways of drugs. The current method includes a simple reversed-phase Liquid chromatography–mass spectrometry (LC-MS) assay in determining the plasma concentrations of dextromethorphan, dextrorphan, and midazolam. Analytes were extracted simply via liquid-liquid extraction with methyl-tert-butyl ether (MTBE). Separation and analysis was done through an Eclipse- XDB® C-8 (150 x 2.1 mm, 3.5 µm particle size, Agilent, Wilmington, DE, USA) analytical column. Analytes were eluted using a mobile phase gradient with good separation and peak shape within 10 min. Using a small sample volume as low as 50 µL of plasma, assay sensitivity was found to be lower limit of quantitation (LLOQ) as low as 0.5 ngmL−1 and the linearity range of 0.5 to 500 ngmL−1 has been achieved for each compound. The limit of quantitation (LOQ) is 0.5 ngmL−1. The Intra- and inter-day precision was less than 4.0 and 7.0%, respectively. The within and between day accuracies were between 94.3 and 111.4% with a mean of 101.5%. This method is beneficial in the clinical and research evaluation of drug metabolizing enzyme activity for CYP1A2 and CYP3A4.
Dextromethorphan (DM; 3-methoxy-17-methylmorphinan; Figure 1a) is found in many over-the-counter cough and cold preparations and used as an antitussive (Chyka et al., 2007; Trevor et al., 2007; Rang et al., 2007). Since DM is present and obtainable in many medicine products, particularly over-the-counter cough and cold formulations, patients may attempt to misuse or abuse it. In many cases, patients may also get exposed to toxic quantities of co-ingestants, such as acetaminophen, antihistamines, and decongestants (Chyka et al., 2007). Toxicity of DM is a major factor affecting severe central nervous system (CNS) or respiratory depression. The antitussive effect of DM is due to its actions at sigma receptors. Structurally, DM is an opioid (d-3-methoxy-N-methylmorphine), and its active metabolite is a dextro isomer of levorphanol (Chyka et al., 2007). Intentional mishandling of DM to hallucinate is commonly referred to as "robo-tripping", "tussing", and "dexing" (Trevor et al., 2007).

Large DM exposures commonly occur differently among healthy teens and young adults. Mechanism of toxicity of DM is due to CYP 2D6 mediated metabolism to dextrorphan, leading to development of hallucinations and dysphoria (Rang et al., 2007). The commonly used antitussive agent is also used to simultaneously assess cytochrome P450 during drug development. It is considered as a popular biomarker used to quantitate, or phenotype, the activity of the Cytochrome CYP2D6 enzyme (Chyka et al., 2007; Rang et al., 2007). Cytochrome CYP2D6 metabolism of DM results in the primary metabolite dextrorphan (DX) (Chyka et al., 2007; Cook et al., 2007) (DX; 3-hydroxy-17-methylmorphinan; Figure 1a). To phenotype CYP2D6 enzyme activity, DM is orally administered. Since CYP2D6 is a polymorphic enzyme, plasma or urine DM and DX exposure can be used to classify individuals as “poor metabolizers” (having low enzyme activity and high DM exposures) for example “extensive metabolizers” (having normal enzyme activity and moderate DM exposures), or “ultra-extensive metabolizers” (having high enzyme activity and low DM exposures) (Chyka et al., 2007; Cook et al., 2007).
Midazolam (MDZ, 8-chloro-6-(2-fluorophenyl)-1-methyl-4H-imidazol; Figure 1b) is a synthetic benzodiazepine with short half-life. It is among the most important benzodiazepine derivatives used as anxiolytic, sedative or hypnotic or sedative-hypnotic drugs. Midazolam is used on a wide-scale as premedicate medicine before surgery (Chyka et al., 2007; Trevor et al., 2007; Rang et al., 2007). It is considered the most commonly prescribed drug worldwide for the treatment of anxiety and insomnia, particularly for elderly patients (Cook et al., 2007). These facts lend importance to study MDZ pharmacokinetics and bioavailability and its concentration in serum in cases of abuse: forensic cases, drug poisoning or suicidal doses (Hirda et al., 1998; Ferslew et al., 1989; Shenkman et al., 1995). Majority of MDZ (70%) is metabolized to 1-hydroxymidazolam by CYP3A (Nordt et al., 1997). Several analytical assays have been developed to measure the concentrations of dextromethorphan, dextrophan, and/or midazolam.

Many High-performance liquid chromatography (HPLC) (Samanidou et al., 2007; El Mahjoub and Staub, 2000; Bugey et al., 2004; Zevzikoviene et al., 2003) Liquid chromatography–mass spectrometry (LC-MS) (Moore et al., 2007) and GC-MS methods (Aebi et al., 2002; Unger and Watterson, 2016) were published. In addition to assaying each drug individually and because of the P450 metabolizing activity in measuring these drugs, simultaneous quantification of each drug is useful. As a “cocktail” in approach phenotyping for studying disparate drugs pharmacokinetics (Fuhr et al., 2007), the analytical method is very convenient for Pharmacokinetics (PK) study due to its high sensitivity. In this article, the development and validation of the simultaneous determination of dextromethorphan, dextrorphan, and midazolam have been summarized.
Chemicals and supplies
Dextromethorphan, dextrorphan, midazolam, and diazepam were purchased from Sigma chemical company (St. Louis, MO, USA). Ammonium format, acetonitrile, and HPLC-grade water was purchased from Fisher Scientific (Fair Lawn, NJ, USA). Purified compressed nitrogen gas used was obtained from National Welders Supply (Charlotte, NC, USA) while multiple lots of individual and pooled human drug-free plasma were also obtained from whole blood anticoagulated with sodium EDTA (Biological Specialty Corporation, Colmar, PA, USA).
Equipment
High-performance liquid chromatography (UHPLC) system consisting of Agilent Technologies (Wilmington, DE, USA) HP1200 binary pump, degasser, thermostated autosampler, and MSD-detector were used in this study. Data analysis was accomplished using HP ChemStation software (Version A.09.03).
Preparation of standards
Master stock solution preparation
Individual clear stock solutions of dextromethorphan, dextrorphan, and midazolam were separately prepared at a concentration of 1 mg/mL. One milligram of each analyte was accurately weighed and dissolved in 10 mL of 50% methanol using 10 mL volumetric flask. A master stock solution was prepared as a composite for the three analytes. For each analyte, 200 mL of concentrated stock solution was pipetted into 2 mL volumetric flask. A 50% methanol solution was used to adjust the final volume to 2 mL. The final concentration of master stock is 100 mg/mL for each analyte. From the 100 mg/mL stock solution, eight intermediate calibration solutions were prepared 10000, 5000, 1000, 500, 100, 50, 10 and 5 ng/mL in 50% methanol.
Final calibration concentrations in pooled human drug-free plasma were 1000, 500, 100, 50, 10, 5.0, 1.0, and 0.5 ng/mL for all three analytes. The plasma calibration curve was made using a 1:10 dilution of the intermediate calibration solutions. A separately prepared 10000 ngmL−1 intermediate stock solution was used to make up the intermediate quality control (QC) calibration concentrations of 3000, 300, and 30 ngmL−1. These QC standards were prepared in 50% methanol in HPLC water. Quality control working standards with final concentrations of 300, 30, and 3.0 ngmL−1 were prepared in pooled human drug-free plasma using 1:10 dilution of the quality control intermediate solutions.
Internal standard (IS) preparation
The internal standard stock solution was prepared by accurately weighing 5 mg of diazepam, dissolving in 50% methanol to achieve a final concentration of 1.0 mgmL−1. The internal standard working solution was prepared by diluting 10 µL of this solution in 200 mL of water to achieve a final concentration of 50 ngmL−1.
Samples and pre-treatment
This method was used to determine the concentrations of dextromethorphan, dextrorphan, and midazolam in clinical samples. These samples were collected from healthy volunteer subjects following the administering of a drug metabolizing enzyme phenotyping cocktail. Measures of dextromethorphan and dextrorphan were used to phenotype hepatic CYP2D6 activity, and midazolam was used to phenotype intestinal and hepatic CYP3A activity. Subjects received 30 mg of dextromethorphan orally and 1 to 2 mg of midazolam orally or intravenously. Blood samples were collected in 3.0 mL vacutainer tubes containing 8.55 mg tripotassium ethylenediaminetetraacetic acid (K3EDTA) (15% additive solution) as an anticoagulant which is kept in ice bath after collection for a maximum of 15 min. Blood plasma was separated by centrifugation at 2800 rpm for 15 min at 4°C. Plasma samples were aliquoted and transferred to -80°C temperature-monitored freezer for storage until analysis. Prior to extraction, all plasma samples were brought to room temperature then gently mixed.
Extraction procedure
On the day of analysis, 50 μL of the internal standard was placed into 2.0 mL labeled conical plastic Eppendorf tube, followed by 50 μL of plasma (blank samples, calibrators, quality control samples or patient samples). To each tube, 1.5 mL of methyl tertiary butyl ether was added. The solutions were vertically vortexed for 10 min and centrifuged at 12,000 rpm for 5 min. Following centrifugation, the tubes are submerged into a dry ice-acetone bath. After 45 s the aqueous layer is frozen, and the organic layer was decanted into a clean labeled 1.5 mL Eppendorf tube, and evaporated to dryness at 40°C under a gentle nitrogen stream. The residue was reconstituted with 50 µL of mobile phase solution. These reconstituted solutions were carefully vortexed for 2 min and centrifuged at 12,000 rpm for 5 min. The supernatant was transferred to 100 µL HPLC microvials (Agilent Technologies) and 10 µL was injected onto the analytical column.
High performance liquid chromatographic conditions and mass spectrometry
Chromatographic separation of analytes and internal standard was achieved at 40°C. The analytical column Eclipse- XDB® C-8 (150 x 2.1 mm, 3.5 µm particle size, Agilent, Wilmington, DE, USA) with a Security Guard® C-8 (4.0 x 3.0 mm, Phenomenex, Torrance, CA, USA) guard column were used for separation and analysis. Separation performed with gradient elution is shown in Table 1. Mobile phase A was 20.0 mM ammonium format, adjusted to pH of 4.0 with formic acid while mobile phase B was 95:5 composite of Acetonitrile: HPLC-grade. Each mobile phase solution was prepared thorough by mixing and filtering using a 0.45 µm membrane filter (Millipore, Milford, MA, USA). Mass spectral analysis was performed on an Agilent 1100 mass spectrometer, fitted with electrospray ionization (ESI) source. The MS detector was set on single ion monitoring (SIM) on masses 272.2 (dextromethorphan), 258.1 (dextrorphan), 326.1 (midazolam), and 285.1 (diazepam). The fragmentor and gain were set at 140 and 1, respectively. Each injection required 20 min of analysis time, including 5 min for re-equilibration. The autosampler temperature was set to 4 (±2)°C, and the analysis performed at 40°C.

Specificity and selectivity
Interference from endogenous compounds was investigated by analysis of blank plasma samples from six different lots of drug free plasma. These lots were pooled from different male and female volunteers. Possible interference from other dextromethorphan metabolites; 3-hydroxymorphinan, 3-methoxymorphinan and midazolam 1 and 4-hydroxy were investigated. These four compounds were prepared as a composite at concentration 300 ngmL−1each injected separately and compared with the method system suitability.
Limit of detection and limit of quantification
The upper limit of quantitation (ULOQ) is defined as the concentration for which both the relative standard deviation and the percent deviation from the nominal concentration were less than 15% (Food and Drug Administration, 2001). The lower limit of quantitation (LLOQ) is defined as the concentration for which both the relative standard deviation (RSD) and the percent deviation from the nominal concentration were less than 20% (Food and Drug Administration, 2001). The detection limit was defined as a signal to noise ratio 3:1.
Extraction recovery
The recovery (extraction efficiency %) of the three analyts after the optimized liquid-liquid extraction procedure was determined by comparing peak areas of each compound in extracted plasma to those of non-processed standard solutions. The quality control aliquots of 3.0, 30.0 and 300.0 ngmL−1 were used for recovery study and matrix effect.
Stability
To test, stability samples were left at room temperature for 4 to 8 h, subjected samples to three freeze-thaw cycles, stored for 3 days in the refrigerator at 4°C prior to analysis. In addition, the untreated quality control (QC) analyzed with the above samples was left in the instrument auto-sampler at 4°C for 24 h then re-injected to address the samples stability in the reconstitution solution following extraction. QC samples at three concentrations 3.0, 30 and 300 ngmL−1 were utilized for this purpose.
Linearity
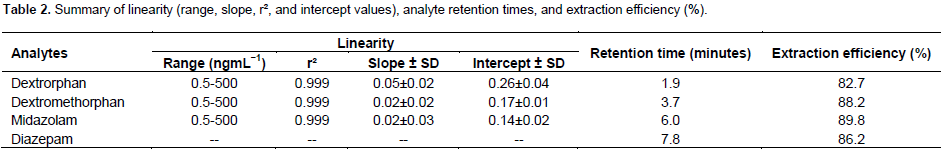
The calibration curve was calculated using peak height ratio values at seven standard concentration levels. The peak height ratios were proportional to the concentration of each analyte in plasma over the tested range. A summary of three calibration curves are shown in Table 2, along with the mean ± SD of the standard curve slopes and intercepts, and correlation coefficients (r²). The concentration range was linear from 0.5 to 500 ngmL−1 for all analytes. The regression coefficient (r²) for all calibration curves is 0.999 or greater.
Selectivity
Investigation of six blank plasma chromatograms with internal standard was indicative that is no endogenous interference occurred from the matrix. A representative chromatogram of the extracted IS in blank plasma is illustrated in Figure 2. The approximate retention times for all three compounds and internal standard are listed in Table 2. No interference was observed from other tested metabolites. Also, no effect of the matrix on all analysts was found.
The limit of quantification
The LLOQ for all compounds was 0.5 ngmL−1, and ULOQ was 500 ngmL−1. Chromatograms from standard curves at 100 and 0.5 ngmL−1are shown in Figures 3 and 4.
Accuracy and precision
The results for accuracy and precision experiments are shown in Table 3. Accuracy of all analytes ranged from 94 to 111% with a mean of 101.6%. Within-and between, day precision varied from 2.0 to 3.6%, and 3.0 to 8.4%, respectively. The mean intra-day precision was always less than 4.0%. The results indicate that, the method is accurate which precise for each compound.

Stability
DM, DX, and MDZ were tested for stability under three conditions: room temperature, multiple freeze thaws, and refrigeration for three days. After 6 h at room temperature, the three compounds were stable in plasma,presence at least 83% of the initial concentration. In three freeze-thaw cycles, the three compounds were stable in plasma with concentrations of at least 87% of the initial concentration. After refrigeration for days, the three compounds proved to be stable with concentrations of at least 80% of the initial concentration.
Analysis of patient samples
The described method was utilized to analyze plasma samples collected from healthy volunteers. The subjects were given a single 30 mg doses of dextromethorphan and 1 to 2 mg of midazolam orally or intravenously. A representative volunteer chromatogram is shown in Figure 5 and the calculated concentrations are 3.6 ngmL−1 for dextrorphan, 1.4 ngmL−1 for dextromethorphan and 14.9 ngmL−1 for midazolam.

Our goal was, to develop and validate a sensitive method for analyzing three analytes in human plasma using LC-MS single quad mass spectrometry. LC-MS single quad is relatively less expensive than triple quad (LC-MS/MS). At present, two important LC-MS/MS methods of cocktail cytochrome P450 substrate drugs have been published (Shimako et al., 2014; Yang et al., 2013). Though, both methods which include more analytes and sample volumes were relatively high (300 and 450 µL). In this process, the analysis was performed using only 50 µL plasma samples. Sample preparation and chromatographic conditions were optimized for sensitive, simple and practical quantitative analysis. The sensitivity of these methods was 5 and 10 ngmL−1, respectively (Yang et al., 2013; Shimako et al., 2014). In this method LLOQ was very low; we were able to reach as low as 0.5 ngmL−1.
This method relied on a well optimized extraction method, good chromatographic column separation (particle size 3.5 µm and ID 2.1 mm) and small amounts of solvent. Several analytical columns were tested. Eclipse- XDB® C-8 (150 x 2.1mm, 3.5 µm particle sizes, Agilent, Wilmington, DE, USA) was the chosen one due to good separation and best peak shape. Electrospray ionization (ESI) was conducted in positive ion mode. The mobile gradient (Table 1) and composition at pH 4.0 were also tested against other mobile phase combination. The current mobile phase elution method gave the best result. As detected, LCMS is a useful tool in the simultaneous determination of dextromethorphan, dextrophan, and midazolam in human plasma. This method has been utilized to analyze samples obtained from healthy volunteers. In upcoming, this method will be beneficial in further understanding of drug metabolism and drug-drug interactions in individuals. At the time of developing this assay, there will not be access to other cytochrome P450 substrate drugs. It is believe that, good separation method conditions could be revalidated incase where other drugs are available and needed for analysis.
To our understanding, there are no published analytical methods with sensitivity as low as 0.5 ng/mL for three analytes, which is considered to be 200 times lesser than the therapeutic level of these drugs. Therefore, the proposed bioanalytical methods in this study are qualify to be considered for PK studies and therapeutic drug monitoring (TDM). Obtained data during the validation of the assay demonstrated high sensitivity, good precision, accuracy and specificity. Additionally, these results proved that both sample preparation is simple and robust over time. The method has been applied for clinical study in which dextromethorphan was a substrate for both 3A and 2D6 and midazolam was a substrate for 3A. Chromatogram of one volunteer was presented with the calculated concentrations.
We have successfully developed and validated an LC-MS bioanalytical method for three analytes (dextromethorphan, dextrorphan and midazolam). The method proved to be highly sensitive and accurate, using a biological matrix volume as low as 50 µL. Our method exhibits good linearity, precision and accuracy over a wide range of drug concentrations (0.5 to 500 ngmL−1). The method’s sample preparation, extraction, and powerful liquid chromatography and single quad mass spectrometry can be readily used for accurate quantification of any of the drugs or as a cocktail for PK studies.