Full Length Research Paper

ABSTRACT
The purpose of the study is to develop and validate method for assay of Aceclofenac in tablet dosage forms using ultra violet spectrophotometry (UV) and high performance liquid chromatography (HPLC) techniques. A method was developed and validated for analysis of Aceclofenac using UV technique with methanol and phosphate buffer 7.4 as solvent. The HPLC analysis was conducted using two mobile phases, that is, “A” as Acetonitrile: Methanol (80:20 v/v) and “B” as Acetonitrile: methanol: NH3 solution (225:50:1 v/v/v). The method was used for assay determination for tablets dosage forms and results were found to be in compliance with official standards. Validation studies were also carried out for both methods. Linearity, LOD, single point calibration, precision and accuracy and % RSD were calculated. Aceclofenac standard was analysed with UV Spectrophotometer in the concentration ranges of 0.5-50 and 0.4-50 mg/L for each solvent and results showed good linearity with R2 = 0.9998 and 0.9999. The method was also specific that verifies the absence of interference at the ï¬max of Aceclofenac. UV analysis was precise with % RSD falling within 2% and LOD as 0.5 and 0.4 mg/L for methanol and PBS 7.4, respectively. The tablets of three brands showed assay percentages within specified limits in methanol (109.33, 103.90 and 105.61%) and PBS 7.4 (108.70, 100.69 and 106.60%). In HPLC analysis, mobile phase ‘B’ showed more sharp peaks with lesser HETP and Tf compared to mobile phase ‘A’. The method was checked for reliability and efficiency for assay and some of the parameters like height efficiency to theoretical plates (HETP), tailing factor, peak heights, peak widths along with validation studies (Linearity range 0.1-50 mg/L, specificity, precision, and limit of detection and single point calibration). The more basic mobile phase B using NH3 solution produced more sharp peaks as compared to less basic mobile phase A.
Key words: Aceclofenac, UV-Visible spectrophotometry, high performance liquid chromatography (HPLC), validation.
Abbreviation: UV, Ultraviolet; HPLC, high performance liquid chromatography; PBS, phosphate buffer 7.4 solution; LOD, limit of detection; HETP, height equivalent to the theoretical plate.
INTRODUCTION
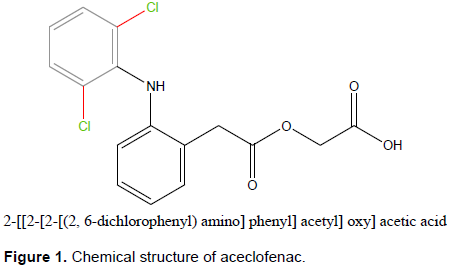
Aceclofenac belongs to NSAID’s group and is chemically phenyl acetic acid. It is used for treatment of diseases like osteoarthritis, rheumatoid arthritis, and ankylosing spondylitis (Dooley et al., 2001). Chemically, it is [[[2-[(2, 6-Dichlorophenyl) amino] phenyl] acetyl] oxy] acetic acid (Legrand, 2004).
Aceclofenac is white powder having a specific crystalline structure. It is soluble in various organic solvents like acetone and alcohol but insoluble in water. Its molecular weight is 354.18 and melting point is 149-153°C (Kale et al., 2014).
Aceclofenac assay has been determined using variety of methods and techniques such as colorimetric, spectroflourimeteric, densitometeric, stripping voltammetry, etc. Derivatization method with p-dimethylaminocinnamaldehyde or 3-Methyl2-benzothiazolinone hydrazine hydrochloride has also been used for assay determination (Bose et al., 2010). In a study, aceclofenac and indapamide were quantified simultaneously in tablet dosage forms using Folin-Ciocalteu reagent which produced blue chromogen (Aceclofenac) with lmax at 642.6 nm and linearity at 80 to 160 µg/ml. Indapamide forms a green chromogen at lmax 783.2 nm and 2 to 12 µg/ml (Singhvi and Goyal, 2007). UV-Visible method has also been applied for simultaneous determination of Diacerein and Aceclofenac (Saurabh and Dharamveer, 2010), Aceclofenac and paracetamol using methanol: glass distilled water (VT et al.,2020) In the present study, methanol and PBS were used for aceclofenac alone which produced desired results for pharmaceutical assay determination. Various mixtures of mobile phases have been studied and validated using HPLC technique for aceclofenac in combination with other drugs. A study in 2012 revealed that phosphate buffer of pH 6.0: methanol 40: 60 (v/v) was used for the assay calculation of aceclofenac, paracetamol and tramadol hydrochloride in pharmaceutical dosage form (Chandra et al., 2012). Drotaverine and aceclofenac have also been quantified using Qualisil BDS C8 column with mobile phase methanol: THF: acetate buffer (68:12:20 v/v) pH 5.0 with acetic acid at Rt 4.23 min (Choudhari et al., 2010). Methanol and water (70:30 v/v) had been used in RP-HPLC method for aceclofenac and paracetamol assay in 2 to 50 µg/mL concentration range for Aceclofenac (Godse et al., 2009).
This technique has also been applied for assay calculation of aceclofenac, paracetamol and tizanidine with mobile phase as phosphate buffer pH 7.0: acetonitrile (40:60 v/v) at 0.7 mL/min flow rateand UV detection at 230 nm (Vaidya et al., 2010). In another study, acetonitrile: water: 0.025 M buffer of potassium dihydrogen orthophosphate (70:10:20% v/v/v) having pH 3.0 stabilized by orthophosphoric acid was used for assay of aceclofenac and thiocolchicoside using spectrophotometry and liquid chromatography. Aceclofenac was eluted at 4.7 min on C-18 column with linearity range of 25 to 150 µg/mL at 260 nm on UV detector (Chitlange et al., 2010). Other mobile phase combinations like methanol, acetonitrile and water (60:30:10), pH adjusted to 3.0 for Drotaverine hydrochloride (Jain et al., 2011)and double distilled water (pH 2.7 with glacial acetic acid)-acetonitrile (45:55 v/v) for diacerein (Shaikh et al., 2012)with aceclofenac in their respective tablet dosage forms have simultaneously been studied using RP-HPLC.
The official compendiums like British Pharmacopeia (BP) and United States Pharmacopeia (USP) have no assay method for aceclofenac although other methods and solvents combinations have been reported and validated. The aforementioned methods primarily focussed on simultaneous assay determination of aceclofenac with other drug moieties. Contrary to that, in the current study method was developed and validated for assay of aceclofenac alone in pharmaceutical dosage forms during product formulation following ICH recommended guideline for pharmaceutical dosage forms.
MATERIALS AND METHODS
Aceclofenac API (Highnoon Laboratories Lahore), Acetonitrile (Sigma Aldrich), NH4OH (BDH, United Kingdom), Water (De-ionized), Methyl Alcohol (Fisher Scientific), Potassium Phosphate Monobasic (Sigma Aldrich), and NaOH (RDH-Sigma Aldrich, UK). Analytical/HPLC grade solvents were used for study.
The standard aceclofenac was verified by various parameters like appearance, solubility, UV-Visible spectrum scanning at lmax 275 and confirmed by FT-IR spectrum thus complying with official standards.
Aceclofenac standard preparation
Weighed aceclofenac exactly 25 mg and dissolved in solvents (methanol and PBS separately) to produce stock solution (250 mg/L). The working dilutions of 0.5, 1.0, 2.0, 4.0, 5.0, 10, 15, 20, 25, 30, 40, and 50 mg/L in methanol and 0.4, 0.8, 1.2, 1.6, 2.0, 4.0, 8.0, 10.0, 20, 30, 40, and 50 mg/L in PBS were prepared accordingly for linearity determination.
Phosphate buffer (pH 7.4)
Fifty millilitres of Potassium Phosphate Monobasic solution (0.2 M) was added volumetric flask to make 200 mL and pH was adjusted to 7.4 by slowly adding 0.2 M NaOH (Mondal et al., 2015).
UV-Visible spectrophotometric method
Aceclofenac three of its tablet dosage forms, that is, Alkeris®, Airtal® and Acenac® (100 mg tablets in Pakistan) were analysed using UV Spectrophotometer. Validation studies were conducted for determination of linearity, specificity, precision (repeatability and intermediate precision), and limit of detection (Sebaiy et al., 2020).
Various statistical parameters like standard deviation, % relative standard deviation, equation of straight line and regression coefficient (R2) for linear regression and assays were also calculated (Rapalli et al., 2020).
Detection method
The samples and standard working solutions were subjected to UV scan (200-400 nm) to determine the lmax for validation and assay determination (Vita et al., 2004).
Validation parameters
Following validation parameters (McPolin, 2009)were studied using UV-Visible spectrophotometric technique: Linearity and Single Point Calibration, Specificity, Precision, Repeatability (Intra-Day Precision), Intermediate Precision (Interday precision), Accuracy, and Limit of Detection.
HPLC Chromatographic System
The samples of aceclofenac and tablets were analyzed on HPLC using two different mobile phases, that is, Acetonitrile: Methanol (80:20 v/v) and Acetonitrile: Methanol: Ammonia Solution (225:50:1 v/v/v). The Lichrospher C-8 column was used as stationary phase with specifications as 5 µ, 4.6 × 150 mm, Merck Germany. The samples were injected with 10 µL syringe using automated injector, flow rate adjusted to 1.0 ± 0.2 ml/min with a total run time 7 ± 0.5 min, temperature 40 ± 5°C and UV-detection at 273 nm.
Mobile phases
Two mobile phases were prepared as Mobile Phase “A” with composition of Acetonitrile: Methanol (80: 20 v/v) and Mobile phase “B” as Acetonitrile: Methanol: Ammonia (225:50:1 v/v/v). The pH of mobile phases was determined to be 5.5 for Mobile Phase A and 9 for mobile phase B with pH meter. The tablet samples were prepared in methanol (30 mg/L) and injected in column with Aceclofenac standard (30 mg/L) on HPLC system to obtain peak area for assay determination. The acceptable assay limit used was 90 to 110% of the labelled amount (official compendium). Efficiency of HPLC system was also assessed by calculating some of the system suitability parameters such as height equivalent to theoretical plates (HETP) (Nováková et al., 2006).
Sample preparation for HPLC analysis
Aceclofenac standard
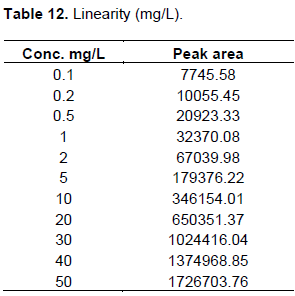
Accurately weighed 25 mg of aceclofenac dissolved in about 20 mL of methanol. After sonication, the final volume was made up to 100 mL to obtain 250 mg/L stock solution. Furthermore, dilutions were made as 0.1, 0.2, 0.5, 1, 2, 5, 10, 20, 30, 40 and 50 mg/L of working solutions.
Aceclofenac commercial tablets formulations
Twenty tablets from each commercial sample (Airtal, Alkeris, and Acenac) were weighed for calculation of average weight and then ground in clean dried pestle mortar to obtain fine powder. The powder equivalent to 25 mg aceclofenac from each brand was dissolved in separate 100 mL volumetric flask and made volume up to 100 mL with respective solvent resulting in 250 mg/L (Stock Solution). The portion of stock solution (3 mL) was diluted in 25 mL flask to obtain 30 mg/L final working concentration.
HPLC efficiency parameters
Various HPLC efficiency parameters were determined using both mobile phases. Peak height, half peak width, width at 10% from base line (both a0.1 and b0.1) and peak area were determined using scientific scale. Then this data was used in calculation of number of theoretical plates (by half peak, area height, tangent line, area height EMG methods), HETP, tailing factor, peak asymmetry factor, etc.
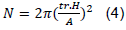
Number of Theoretical Plates (N)
It is calculated to determine efficiency of columns. It is calculated using the following equation:

where tr = retention time and w: peak width (Copyright © Shimadzu.com, 2012).
Tangent line method
This method uses the peak width of the sample peak which is calculated by drawing tangent line points to the peak's left and right inflection that intersects the baseline (The United States Pharmacopeia method).

Half peak height method
It is the most commonly used method referred to as W0.5. German Pharmacopeia, British Pharmacopeia, and European Pharmacopeia used this method. It is determined by width at half the peak.

Area height method
Peak area and height may be used to establish peak width that is relatively accurate and reproducible but not used for overlapped peaks.
where A: Area, H: Height.
Exponentially modified Gaussian method (EMG)
The N for asymmetric peaks often are calculated using this method.
The peak width at 10% of the peak height (W0.1) is used in this method (Shimadzu.com, Shimadzu Corporation, 2012):
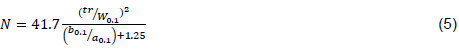
where a0.1: Width of first half of peak at 10% height, b0.1: Width of second half of peak at 10% height.
Height equivalent to a theoretical plate (HETP/H)
Height equivalent to theoretical plate can be calculated as (Theoretical plates counts. Chem.agilent.com, 1-4):

where L= Length of column (mm) and N= number of theoretical plates.
Calculation of peak Asymmetry Factor (used by Tosoh)

where As = asymmetry factor, b = distance from the point at peak midpoint to the trailing edge (measured at 10% of peak height), a = distance from the leading edge of peak to the midpoint (measured at 10% of peak height).
Calculation of Tailing Factor (USP method)

where T = tailing factor which is peak height 5%), b = peak mid to the trailing edge distance, a = distance from the leading edge of the peak to the midpoint.
Validation
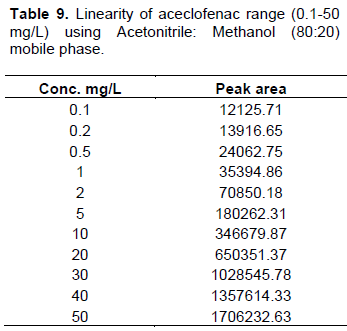
The methanolic solution of aceclofenac standard in the range 0.1, 0.2, 0.5, 1, 2, 5, 10, 20, 30, 40, and 50 mg/L was run using mobile phase “A” and “B”, respectively and the corresponding peak area was recorded for linearity. Single point calibration using aceclofenac standard (50 mg/L) and each tablet (30 mg/L) samples were also run accordingly. Precision (both interday and intraday) was also calculated using 30 mg/L standard aceclofenac solution and % relative standard deviation was calculated. Intermediate precision for both mobile phases was evaluated for 30 mg/L aceclofenac standard solution daily for six days and the results were expressed as % RSD (intraday precision). LOD’s was calculated according to formula:

where Sy is standard deviation of the response (Sy) of the curve and S is the slope of the calibration curve (S) at levels approximating the LOD. Sy and S were determined by using Microsoft Excel software.
RESULTS
Various physicochemical tests like as appearance, solubility, chemical identification test, E1%-1cm and IR spectrum mentioned in BP were used for standardization of Aceclofenac in order to use for UV and HPLC analysis. The standard complied with official limits.
UV visible method
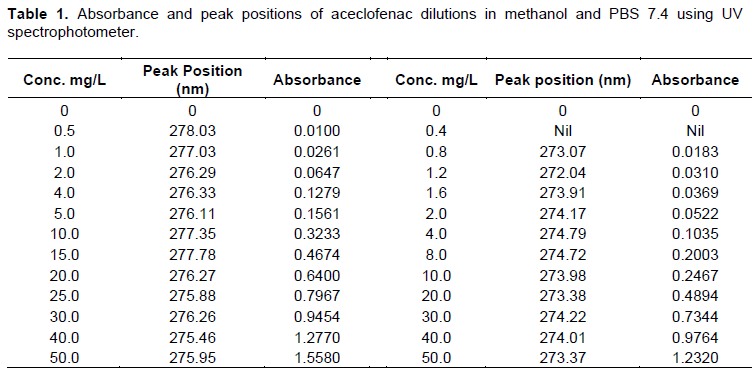
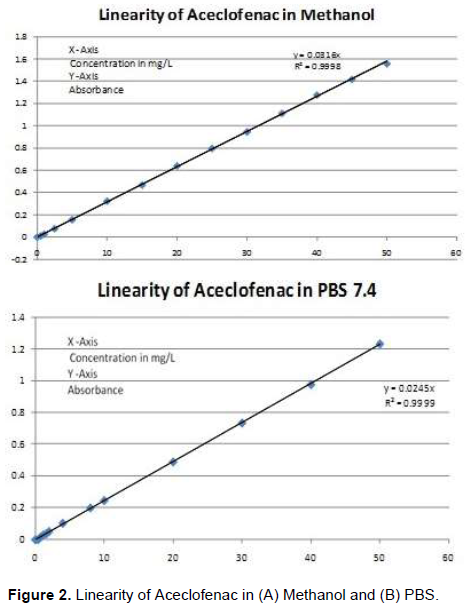
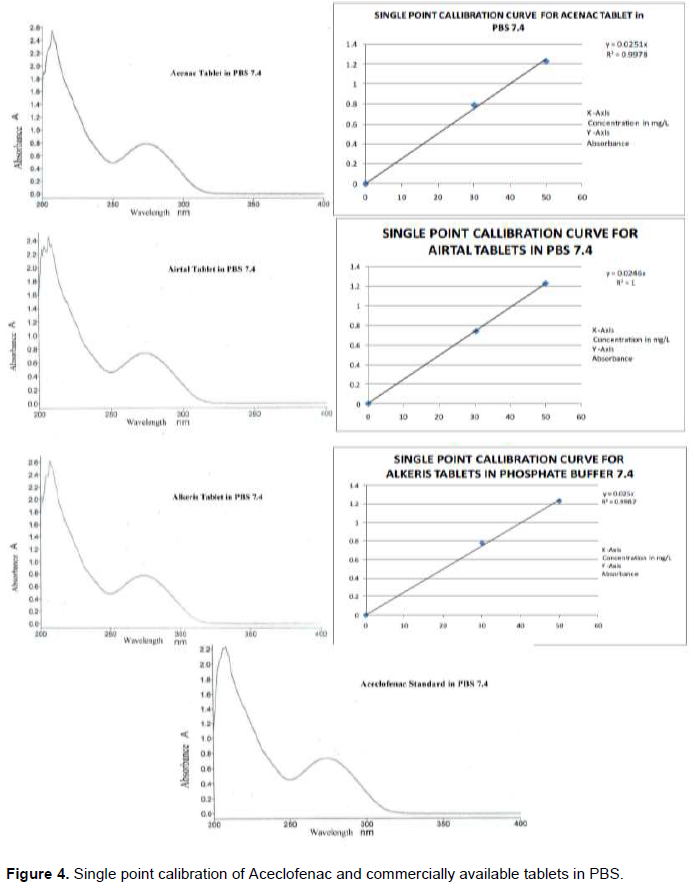
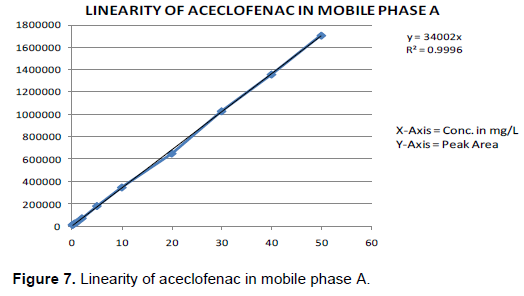
The UV Spectrophotometer was used to analyse samples in methanol and PBS that were scanned for each concentration showing absorbance at lmax = 273-275 approximately (275 in methanol and 273 in PBS). The samples prepared for linearity determination showed good linearity (Table 1 and Figure 1) with R2 0.9998 and 0.9999, respectively and regression lines passing through the origin. The method was also tested for specificity by measuring blanks. The blanks showed no absorbance in this wavelength range.
Two solvent systems, that is, methanol and PBS for aceclofenac and its commercially available tablet brands in Pakistan that is, Airtal, Acenac and Alkeris were used to produce an efficient, reliable and fast method using spectrophotometric analytical procedure by the application of linearity, specificity, precision, accuracy/recovery and limit of detection/quantification. International Conference on Harmonisation (ICH) guidelines recommend that the linearity be evaluated across the range of drug substance directly and/or on the synthetic mixtures of the drug product components. In this study, the linearity in methanol and PBS was evaluated directly on the drug substance aceclofenac standard. The following parameters were evaluated for the current study.
Linearity
According to International Conference on Harmonisation guidelines (ICH), linearity may be defined as “The linearity of analytical procedure is its ability within a given set of range to obtain test results which are directly proportional to the concentration or amount of analyte in the given sample”. Linearity of the aceclofenac is shown in Table 2 and Figure 2.
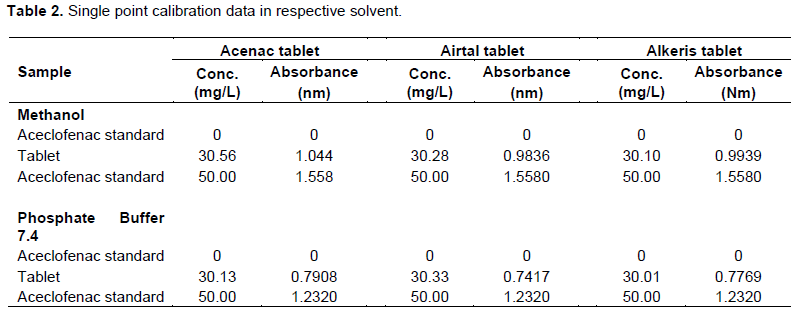
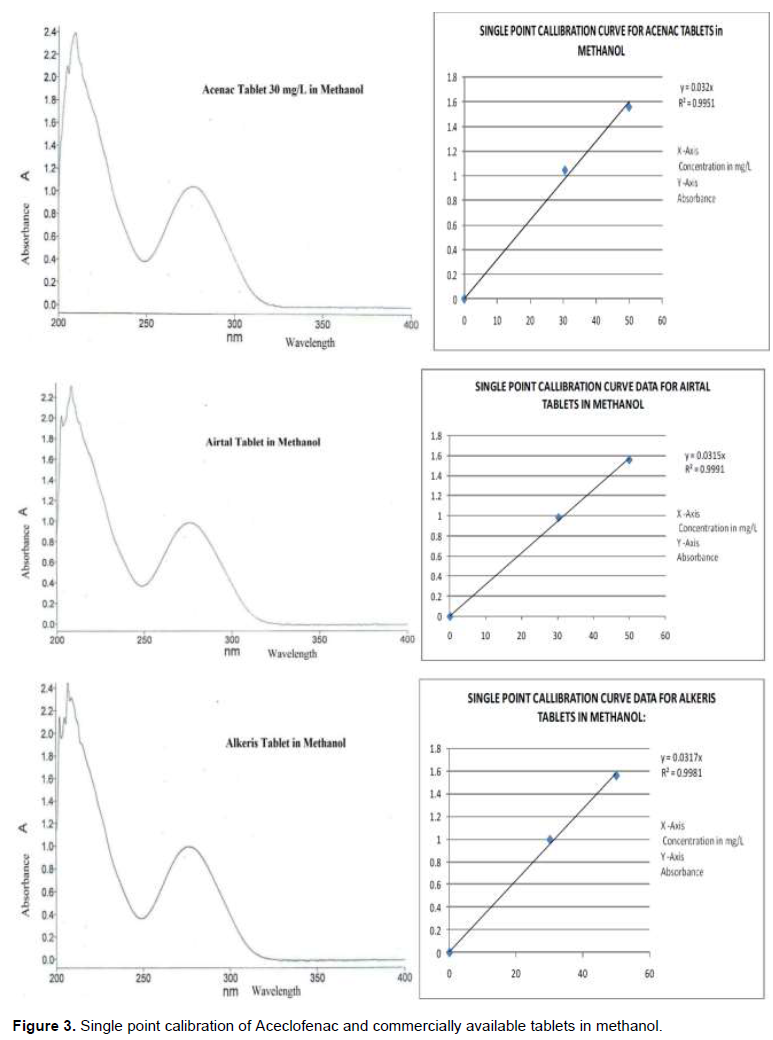
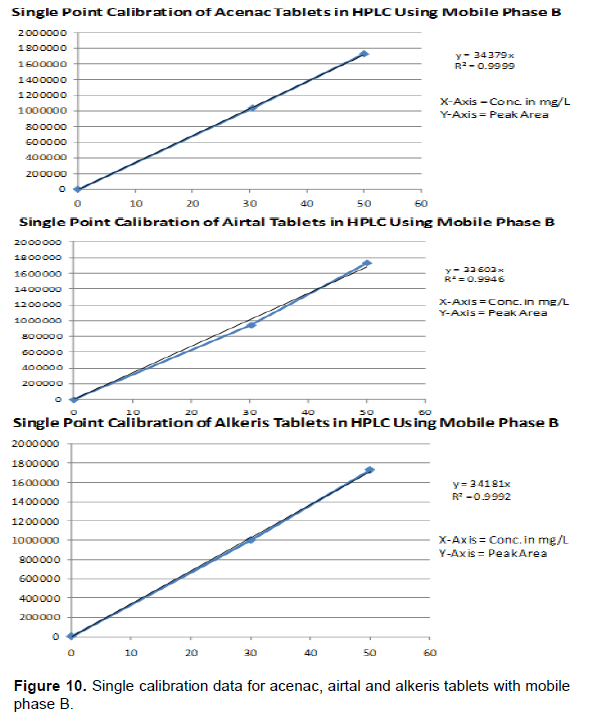
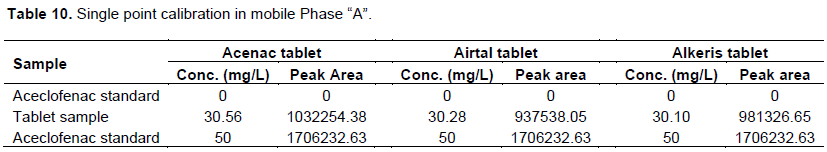
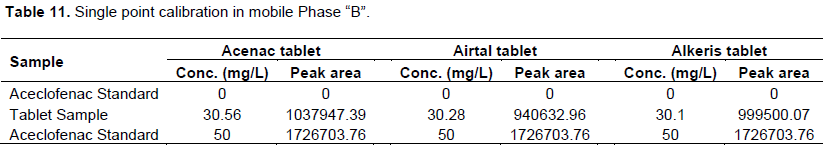
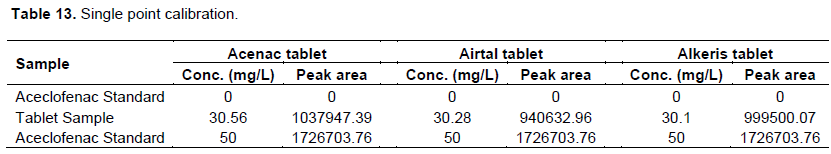
Single point calibration
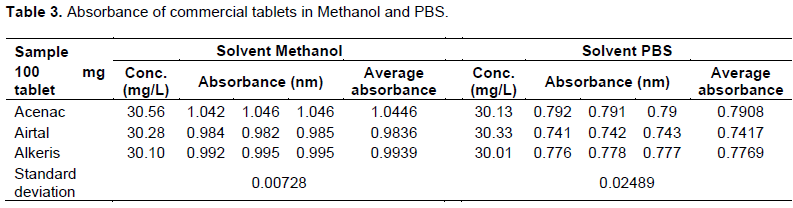
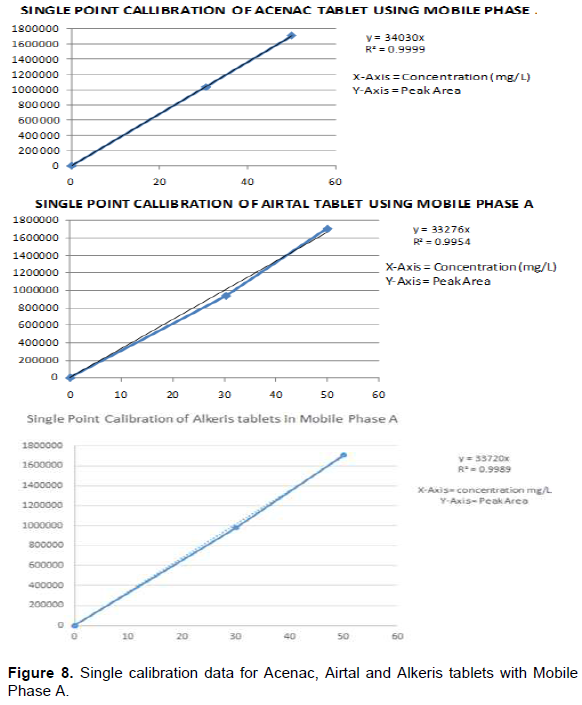
Single point calibration was calculated by taking minimum (sample blank) and maximum (50 mg/L Aceclofenac standard) absorbance and the sample tablet (30 mg/L) was extrapolated in the excel graph resulting in linear regression. This method for theoretical value 30 mg/L was then used to determine assay of respective tablet (Table 3 and Figures 3 and 4).
Specificity
Specificity for the method was recorded for reference sample, sample blank and assay calculation by alternative scientific technique, that is, HPLC.
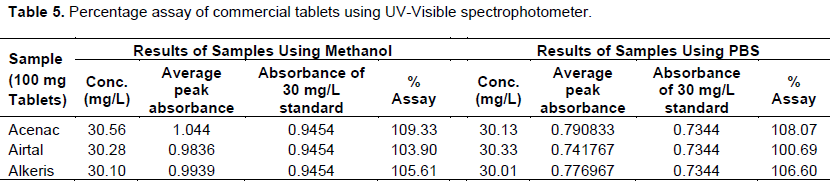
The absorbance (lmax) of aceclofenac standard appeared at the identical point of active ingredient. The solvent system methanol and PBS showed no absorbance at lmax of reference sample. The reference sample, sample blank and assay calculation was done by alternative scientific technique, that is, High Performance Liquid Chromatography (Tables 5 and 6) (ICH Recommended guidelines).
Precision
The precision was assessed at two level, that is, repeatability and intermediate precision (Table 4).
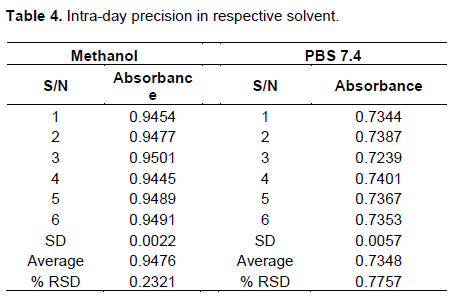
Repeatability (intra-day precision)
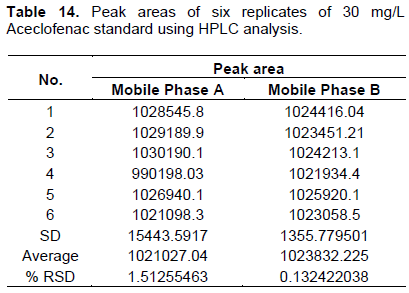
Six replicates of standard solution at concentration (30 mg/L were subjected to analysis and response of each replicated was observed).
The precision was expressed as % relative standard deviation.
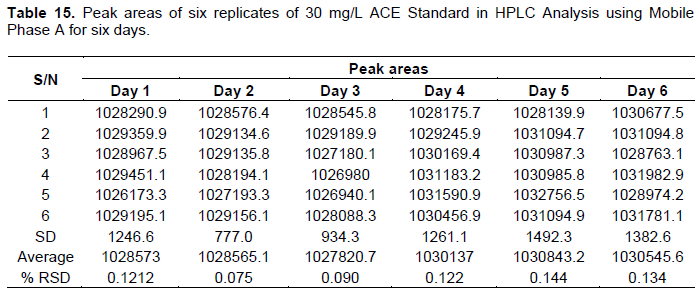
Intermediate precision (Interday precision)
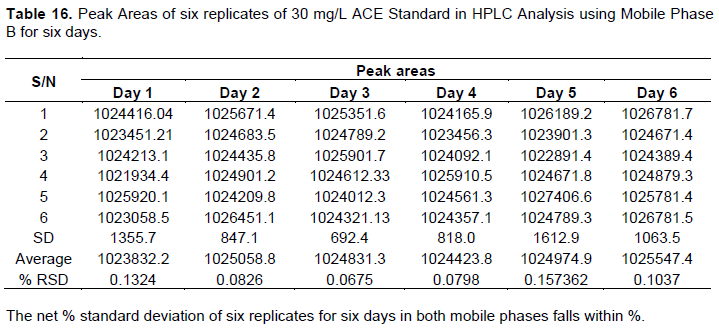
Intermediate precision was evaluated for 30 mg/L aceclofenac standard solution daily for six days and the results were expressed as % RSD for both solvents.
Accuracy
Accuracy of the method was evaluated by recovery studies at three levels (80, 100 and 120%). This was done by analysing a sample of known concentration and comparing the measured value to the ‘true’ value. A well characterize sample (e.g., reference standard) was also used. The assay for commercial samples was calculated by using modified formula (Naveed and Qamar, 2014).

The percentage purity of standard as specified by provider was also multiplied to get accurate results shown in Table 2.
HPLC analysis
Following results were obtain by HPLC analysis using following formula (Ermer et al., 2005):
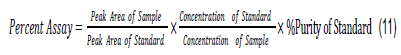
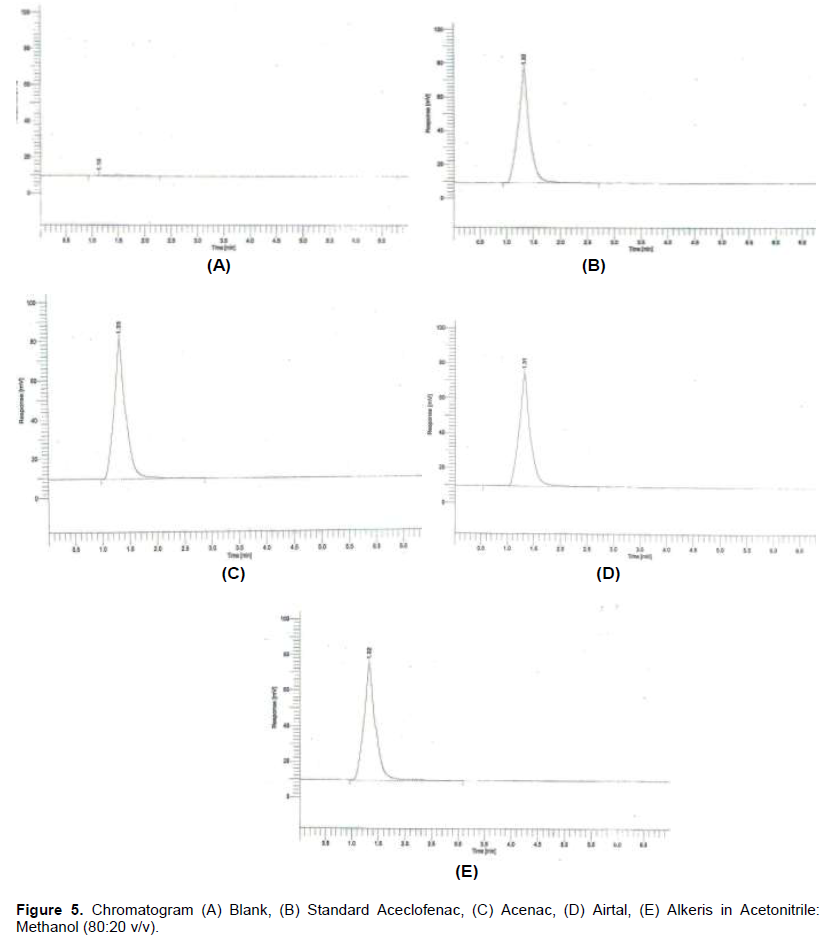
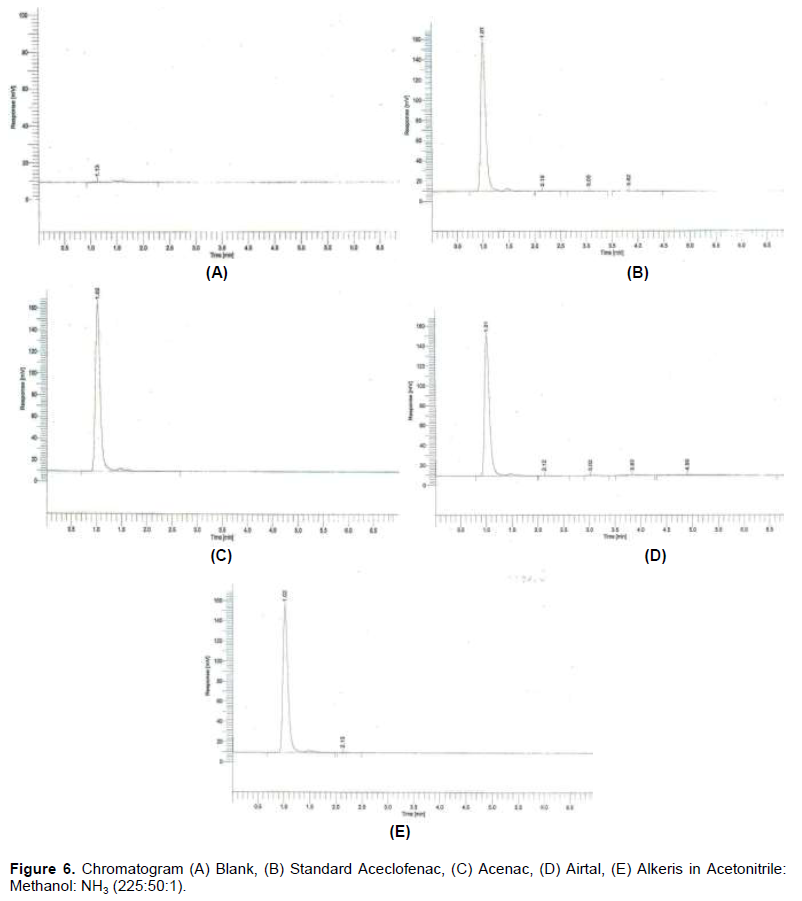
The percentage purity of standard as specified by provider was also multiplied to get accurate results (Olson et al., 1997). Percentage assay of HPLC are shown in Table 6. Chromatogram of HPLC for both mobile phases is shown in Figures 5 and 6.
Calculation of HPLC efficiency parameters
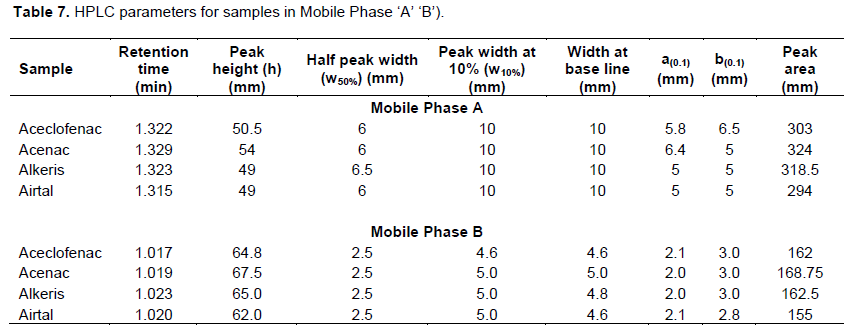
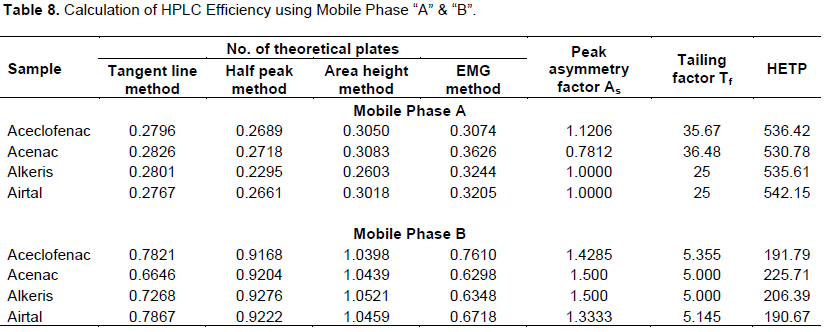
HPLC data was elucidated through some parameters for comparison of efficiency of method in both mobile phases. Peak height, half peak width, width at 10% from base line (both a0.1 and b0.1) and peak area were determined using scientific scale. Then this data was used in calculation of number of theoretical plates (Tangent line, half peak, area height and EMG methods), peak asymmetry factor, tailing factor and HETP. These parameters determined the comparable efficiency of both mobile phases for aceclofenac and commercial samples shown in Tables 7 and 8.
Validation results for HPLC
The following results were obtained and described briefly using HPLC system for aceclofenac in both mobile phases.
Acetonitrile: Methanol: NH3 (225:50:1) mobile phase
Other parameters like specificity, precision and limit of detection were also calculated and results are shown here:
Specificity: Specificity for aceclofenac using HPLC method was determined by:
Reference sample: The standard aceclofenac showed peak area identical to active ingredient in the tablet dosage form.
Solvent System: The mobile phases A and B as blank showed no absorbance at retention time of reference sample and the blank was acceptable.
Repeatability/precision (intra-day precision): The net % standard deviation of six replicates in both mobile phases falls within 2% thus justifying the findings of results.
(1) Intermediate precision (interday precision): Intermediate precision for both mobile phases was evaluated for 30 mg/L aceclofenac standard solution daily for six days and the results were expressed as % RSD.
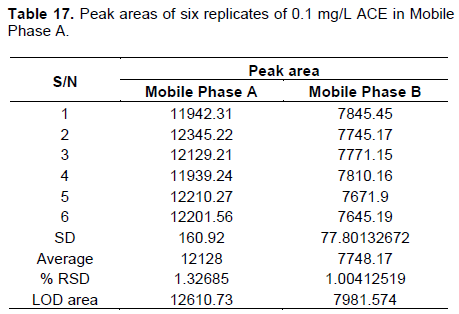
(2) Limit of detection: Limit of detection (LOD) was calculated using Equation 9.
DISCUSSION
Aceclofenac is an anti-inflammatory drug prescribed for various pain related issues (Hinz et al., 2003). Various analytical techniques are available for its assay determination and validation. UV-Vis Spectrophotometry and HPLC are the techniques commonly applied in pharmaceutical analysis of such drugs (Khan et al., 2016). Aceclofenac commercials samples were analysed in the current study for development and validation. In UV analysis, methanol and PBS 7.4 as solvents were used, while in HPLC analysis, Acetonitrile: Methanol (80:20 v/v) and Acetonitrile: Methanol: NH3 (225:50:1 v/v) mobile phases were used. The official method available for assay determination of aceclofenac active and its commercial dosage forms is by potentiometric titration (Aderibigbe et al., 2012). This method is strenuous and less sensitive as compared to this developed method.
The aceclofenac that was standardized using various official standards (Sherikar et al., 2011)complied with the official standards. The method used for UV-Visible analysis produced linearity over 0.5-50 and 0.4-50 mg/L in methanol and PBS 7.4 with R2 0.9998 and 0.9999 at lmax 275 ± 3 and 273 ± 2 nm, respectively (Table 1 and Figure 2). The sample blanks were tested in order to find any interferences of matrix and the method appeared to be specific showing no absorbance in this wavelength range. The method was precise (at 30 mg/L) for both solvents with net % RSD less than 2%, that is, 0.2321 and 0.7757. Statistical analysis using SD and % RSD was used for Limit of Detection (LOD) of aceclofenac and calculated to be 0.5 and 0.8 mg/L, respectively. The assay was calculated for Acenac, Airtal and Alkeris commercial samples as 109.33, 103.90 and 105.61% using methanol and 108.07, 100.69 and 106.60% using PBS 7.4, respectively complying with the official range (90-110% USP).
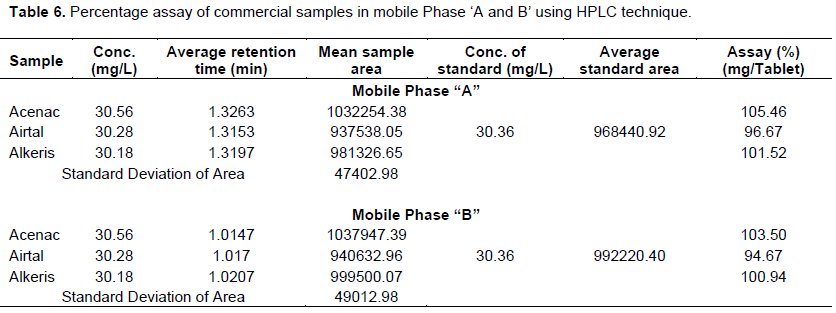
Different types of solvent combinations (Rao et al., 2011)were developed for assay determination and validation studies for aceclofenac combined with other drugs. In HPLC analysis, mobile phase “A” & “B” produced comparable results. The method for HPLC was checked for validity, reliability and efficiency. The mobile phase “B” was made more basic as compared to “A” by adding ammonia solution resulting in sharper peaks. The assay for each tablet commercial sample (Acenac, Airtal and Alkeris) was calculated to be 105.46, 96.67 and 101.52% in mobile phase “A” and 103.50, 94.67 and 100.94% in “B” (Table 6). The retention time of aceclofenac was recorded nearly 1.31± 0.2 min both mobile phases as compared to reported 2 to 14 min in literature.
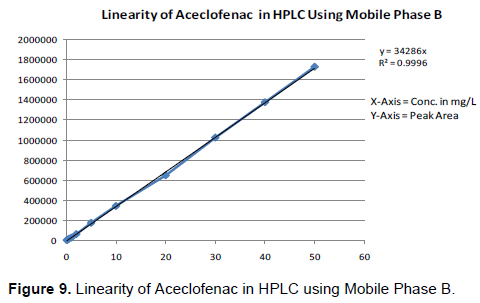
The efficiency of HPLC method for both mobile phases (Liang et al., 2007)was determined. It is well established fact that the lower are HETP, the more efficient is chromatographic system, thus enabling the detection of lower concentrations due to the enhanced signal-to-noise ratio of all the peaks in the chromatogram (Kraiczek et al., 2013). Using mobile phase ‘A’, the samples (both standard and commercial) HETPs were calculated to be in the range of 530 to 543, while using mobile phase B, HETPs were evaluated to be in range of 190 to 226. Similarly, the tailing factor for peaks was also less in mobile phase B as compared to A. Other parameters were also comparable for samples in a particular mobile phase (Tables 7 and 8). Mobile phase B produced lesser HETP’s as compared to mobile phase A. The peaks are sharper and pointed with lesser base line width using mobile phase B as compared to mobile phase A. Hence the mobile phase can be made basic to enhance the efficiency of the HPLC system. The method was also validated using various parameters as linearity (0.1-50 mg/L with R2 0.9996), single point calibration, specificity, precision of % RSD below 2% (1.51 and 0.13%) with inter and intra-day precision below 2% and accuracy and LOD determination the results of which are shown in Figures 7 to 10 and Tables 9 to 17. The LOD was determined statistically using equation of straight line from regression line for both mobile phases and found to be 0.1 mg/L. The 0.1 mg/L concentration was also analysed for six replicates and % RSD was calculated to be below 2%. These validation parameters suggested that the method for both mobile phases is precise and linear over the range.
The method used for UV Analysis was found to be simple, effective and reliable for both methanol and PBS 7.4 in pharmaceutical assay determination. On the other hand, mobile phase ‘A’ and ‘B’ produced efficient results in HPLC analysis for aceclofenac attaining rapid elution as compared to other methods in literatures. But as far as the efficiency of both mobile phases is concerned, mobile phase ‘B’ was found to be more efficient as compared to mobile phase ‘A’ for aceclofenac on the basis of efficiency parameters for HPLC technique. More basic mobile phase, that is, mobile phase ‘B’ produced more efficient results because increasing the pH above pKa of aceclofenac (4.7) increases solubility of drug in mobile phase (Musmade et al., 2007).
CONCLUSION
Utilization of UV-Visible and HPLC methods was found to produce desired results within the range and may be useful tools for the assay of aceclofenac alone at industrial level as compared to the reported methods. Therefore, it is concluded that both types of solvents, that is, methanol and PBS 7.4 in UV-Vis spectrophotometry and mobile phases A and B in HPLC can be used for the analysis of aceclofenac active as well as commercially available tablet formulations.
CONFLICT OF INTERESTS
The authors have not declared any conflict of interests.
ACKNOWLEDGEMENT
The authors appreciate the support provided by Mr. Tariq Jamshaid (B.Pharm: R & D / Production Manager, Surge Laboratories Sheikhupura Pakistan) and Ms Tayyaab (M.Phil Chemistry) in conducting scientific and technical matters related to this study.
REFERENCES
|
Aderibigbe SA, Adegoke OA, Idowu OS, Olaleye SO (2012). Sensitive spectrophotometric determination of Aceclofenac following azo dye formation with 4-carboxyl-2, 6-dinitrobenzene diazonium ion. Acta Poloniae Pharmaceutica 69(2):203-211. |
|
|
Bose A, Dash P, Sahoo M (2010). Simple spectrophotometric methods for estimation of Aceclofenac from bulk and formulations. Pharmaceutical Methods 1(1):57-60. |
|
|
Chandra P, Rathore AS, Lohidasan S, Mahadik KR (2012). Application of HPLC for the simultaneous determination of Aceclofenac, paracetamol and tramadol hydrochloride in pharmaceutical dosage form. Scientia Pharmaceutica 80(2):337-352. |
|
|
Chitlange SS, Shinde PS, Pawbake GR, Wankhede SB (2010). Simultaneous estimation of Thiocolchicoside and Aceclofenac in pharmaceutical dosage form by spectrophotometric and LC method. Der Pharmacia Lettre 2(2):86-93. |
|
|
Choudhari V, Ingale K, Sahoo M, Syal P, Ingale S, Shinde S, Kuchekar B (2010). Development and validation of a RP-HPLC-PDA method for simultaneous estimation of Drotaverine and Aceclofenac in a combined dosage form. International Journal of Research in Pharmaceutical Sciences 1(3):253-258. |
|
|
Compatibility Study of Aceclofenac and Tablet Disintegrants by Thermal and Nonthermal Methods. Research Journal of Pharmacy and Technology 4(3):423-427. |
|
|
Dooley M, Spencer CM, Dunn CJ (2001). Aceclofenac. Drugs 61(9):1351-1378. |
|
|
Ermer J, Arth C, De Raeve P, Dill D, Friedel HD, Höwer-Fritzen H, Kramer M (2005). Precision from drug stability studies: Investigation of reliable repeatability and intermediate precision of HPLC assay procedures. Journal of Pharmaceutical and Biomedical Analysis 38(4):653-663. |
|
|
Godse V, Deodhar M, Bhosale A, Sonawane R, Sakpal P, Borkar D, Bafana Y (2009). Reverse phase HPLC method for determination of Aceclofenac and paracetamol in tablet dosage form. Asian Journal of Research in Chemistry 2(1):37-40. |
|
|
Hinz B, Rau T, Auge D, Werner U, Ramer R, Rietbrock S, Brune K (2003). Aceclofenac spares cyclooxygenase 1 as a result of limited but sustained biotransformation to diclofenac. Clinical Pharmacology and Therapeutics 74(3):222-235. |
|
|
Jain JR, Shah DR, Shah SA, Chauhan RS (2011). RP-HPLC method for simultaneous estimation of Drotaverine hydrochloride and Aceclofenac in their combined tablet dosage form. Der Pharma Chemica 3(4):245-252. |
|
|
Kale AM, Shelke R, Nawale BR (2014). Zinc-Aceclofenac complex: Synthesis, hydrolysis study and antiinflammatory studies. Anti-Inflammatory and Anti-Allergy Agents in Medicinal Chemistry (Formerly Current Medicinal Chemistry-Anti-Inflammatory and Anti-Allergy Agents) 13(1):36-44. |
|
|
Khan A, Iqbal Z, Khadra I, Ahmad L, Khan A, Khan MI, Ullah Z (2016). Simultaneous determination of domperidone and Itopride in pharmaceuticals and human plasma using RP-HPLC/UV detection: Method development, validation and application of the method in in-vivo evaluation of fast dispersible tablets. Journal of Pharmaceutical and Biomedical Analysis 121:6-12. |
|
|
Kraiczek KG, Rozing GP, Zengerle R (2013). Relation between chromatographic resolution and signal-to-noise ratio in spectrophotometric HPLC detection. Analytical Chemistry 85(10):4829-4835. |
|
|
Legrand E (2004). Aceclofenac in the management of inflammatory pain. Expert Opinion on Pharmacotherapy 5(6):1347-1357. |
|
|
Liang D, Peng Q, Mitchelson K, Guan X, Xing W, Cheng J (2007). A simple and efficient approach for calculating permeability coefficients and HETP for rectangular columns. Lab on a Chip 7(8):1062-1073. |
|
|
McPolin O (2009). Validation of Analytical Methods for Pharmaceutica l Analysis, Mourne Training Services, 14 Burren Road, Warren point Co. Down BT34 3SA. |
|
|
Mondal S, Das S, Ghosh S (2015). Interaction of myoglobin with cationic gemini surfactants in phosphate buffer at pH 7.4. Journal of Surfactants and Detergents 18(3):471-476. |
|
|
Musmade P, Subramanian G, Srinivasan K (2007). High-performance liquid chromatography and pharmacokinetics of Aceclofenac in rats. Analytica Chimica Acta 585(1):103-109. |
|
|
Naveed S, Qamar F (2014). UV spectrophotometric assay of diclofenac sodium available brands. Journal of Innovation in Pharmaceuticals and Biological Science 1(3):92-96. |
|
|
Nováková L, Matysová L, Solich P (2006). Advantages of application of UPLC in pharmaceutical analysis. Talanta 68(3):908-918. |
|
|
Olson LL, Pick J, Ellis WY, Lim P (1997). A chemical assessment and HPLC assay validation of bulk paromomycin sulfate. Journal of Pharmaceutical and Biomedical Analysis 15(6):783-793. |
|
|
Rao MR, Bachhav DG, Rode RB, Nikam KR, Pathade ND (2011). |
|
|
Rapalli VK, Kaul V, Gorantla S, Waghule T, Dubey SK, Pandey MM, Singhvi G (2020). UV Spectrophotometric method for characterization of curcumin loaded nanostructured lipid nanocarriers in simulated conditions: Method development, in-vitro and ex-vivo applications in topical delivery. Spectrochimica Acta Part A: Molecular and Biomolecular Spectroscopy 224:117392. |
|
|
Saurabh K, Dharamveer K (2010). Development and Validation of analytical methods for Simultaneous Estimation of Diacerein and Aceclofenac in Bulk and Tablets using UV-visible spectroscopy. International Journal of ChemTech Research 2(3):1816-1822. |
|
|
Sebaiy MM, Sobhy M, Mattar AA (2020). Different techniques for overlapped UV spectra resolution of some co-administered drugs with paracetamol in their combined pharmaceutical dosage forms. Spectrochimica Acta Part A: Molecular and Biomolecular Spectroscopy 224:117429. |
|
|
Shaikh KA, Patil AT, Ingole AB (2012). Sensitive LC method for the simultaneous determination of diacerein and Aceclofenac in tablet dosage form. International Journal of Industrial Chemistry 3(1):3. |
|
|
Sherikar OD, Puranik MP, Yeole P (2011). A Validated Reversed Phase-High Performance Liquid Chromatographic (RP-HPLC) Method for Simultaneous Estimation of Aceclofenac Drug Substance and Its Related Traces Impurities In The Solid dosage form. International Journal of ChemTech Research 3(2):547-554. |
|
|
Singhvi I, Goyal A (2007). Visible spectrophotometric estimation of Aceclofenac and indapamide from tablets using Folin-Ciocalteu reagent. Indian Journal of Pharmaceutical Sciences 69(1):164. |
|
|
Vaidya V, Singh G, Choukekar M, Kekare M (2010). Simultaneous RP HPLC determination of Aceclofenac, paracetamol and tizanidine in pharmaceutical preparations. Journal of Chemistry 7(1):260-264. |
|
|
Vita M, Meurling L, Pettersson T, Cruz-Sidén M, Sidén Å, Hassan M (2004). Analysis of roscovitine using novel high performance liquid chromatography and UV-detection method: Pharmacokinetics of roscovitine in rat. Journal of Pharmaceutical and Biomedical Analysis 34(2):425-431. |
|
|
VT P, Pishawikar S, More H (2010). Spectrophotometric estimation of aceclofenac and paracetamol from tablet dosage form. Journal of Current Pharma Research 1(1):25. |
|
Copyright © 2024 Author(s) retain the copyright of this article.
This article is published under the terms of the Creative Commons Attribution License 4.0


