Full Length Research Paper
ABSTRACT
Poor prescribing pattern is observed and become a serious problem in the world including developing countries. In Ethiopia, several studies showed that health care institutions did not meet WHO prescribing indicators and the prescribing pattern is not satisfactory in the health care institutions. This study aimsto review the prescribing pattern of medications prescribed to outpatients based on WHO prescribing indicators in Ethiopia. Literature search was performed through PubMed/MEDLINE, Google Scholar, and Research Gate from July 5-30, 2019. A standard data extraction format was used to collect important data from the included studies. Open meta analyst advanced software was used for analyses of the pooled estimate of outcome measures and subgroup analysis. Der Simonian and Laird’s random-effect models were applied for the analyses at 95% confidence level. I2 statistics were used to assess heterogeneity of studies. The presence of publication bias was assessed with comprehensive meta-analysis version 3 software and presented with a funnel plot. P-value of less than 0.05 was considered as statistically significant. The results revealed that a total of 13 studies with 33,567 drugs from 15,305 prescriptions were included for systematic review and meta-analysis. The results of prescribing indicators were 1.96, 93.0, 36.2, 18.3 and 94.8% for average number of drugs per prescription, percentage of drugs prescribed by generic name, percentage of drugs encounter with antibiotics, percentage of drugs encounter with injection and for the percentage of medicines prescribed from essential drug list respectively. Therefore, the prescribing pattern of Ethiopia is below WHO standard level.
Key words: Prescribing pattern, prescribing indicators, Ethiopia.
Abbreviation: CI, Confidence Interval; CMA, Comprehensive Meta-Analysis; CS, Crossectional study; EDL, Essential Drug List; FMHACA, Food Medicine and Health Care Administration and Control Authority; PRISMA, Preferred Reporting Items for Systematic Review and Meta-Analysis; WHO, World Health Organization.
INTRODUCTION
“Rational drug use is a condition of appropriate drug utilization in which patients receive medications appropriate to their clinical needs, in doses that meet their own individual requirements for an adequate period of time, at the lowest cost to them and their community”(Butler, 1958). Even though rational use of drugs in health care institutions is fulfilled when there is rational prescribing, rational dispensing and when patients adhere to their treatment, a WHO report indicated that more than 50% of all medicines are prescribed or dispensed inappropriately, about 50% of all patients take them correctly and about 50% of the drugs in the world wasted due to irrational use(World Health Organization, 2002).
In the clinical setting, prescribing patterns do not always meet the criteria of rational drug use. Because of this, poor prescribing pattern is observed and irrational prescribing has become a serious problem in the world including developing countries. The irrational prescribing of medications leads to unsafeand ineffective treatment, disease prolongation and exacerbation,harm and distress to the users. It also imposes high cost to users(FMHACA, 2012).
As a result, WHO developed medication use indicators to promote rational drug use and to evaluate drug prescribing pattern, including prescribing indicators in order to evaluate medication-related services provided to the population. It sets the standard level of prescribing indicators as: the average number of per prescription to be ≤2, the percentage of drugs prescribed by generic name to be 100%, the percentage of prescriptions with an antibiotic encountered to be 25%, the percentage of prescriptions with an injection encountered to be between 13.4 and 24.1%, and the percentage of drugs from essential drug list to be 100%(World Health Organization, 2006).
Prescribing indicators allow the therapeutic actions taken in similar institutions to be ascertained, enabling subsequent comparison of parameters between them, and to evaluate the population’s medication needs and determine the most frequently used medications in a given place. In addition, these indicators enable the investigator to identify the prescription profile and quality of services offered to the population(Vooss and Diefenthaeler, 2011).In Ethiopia, several studies showed health care institutions didnot meet WHO prescribing indicators and the prescribing pattern isnot satisfactory in the health care institutions(Desalegn, 2013; Sisay et al., 2017).Therefore, this systematic review and meta-analysis aim to review the prescribing pattern of medications prescribed to outpatients based on WHO prescribing indicators in Ethiopia.
METHODS
Study protocol
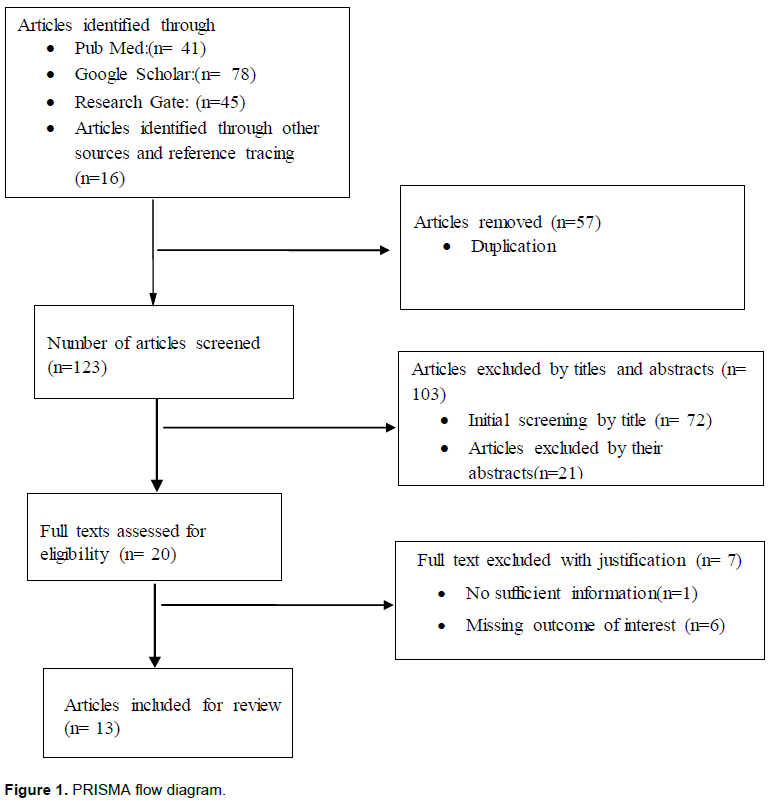
Preferred Reporting Items for Systematic Review and Meta-analysis (PRISMA) flow diagram were used to identify study records, screen titles, and abstracts and to evaluate the eligibility of full texts for final inclusion. In this review and meta-analysis, PRISMA checklist was followed (Liberati, 2009;Table 1).
Data sources and search strategy
Articles were searched from legitimate databases and indexing services like PubMed/MEDLINE and from Google Scholar and Research Gate. HINARI and Science-Direct were also accessed to obtain articles needed for this review and meta-analysis. Appropriately selected search words were used to access articles. “Physician prescribing pattern”, “drug use pattern”, “WHO prescribing indicators”, “drug prescription” and “Ethiopia” were the words used as a search strategy. AND/OR Boolean operators were used for the systematic identification of articles. The search was conducted from July 5-30, 2019.
Screening and eligibility of studies
The title and abstracts of the studies were screened based on the inclusion and exclusion criteria, the full text were collected and the eligibility of the studies was evaluated for final inclusion. Thereafter, likely discrepancies are solved and agreement reached.
Inclusion and exclusion criteria
Inclusion criteria
i) Observational studies addressing drug prescribing pattern of medications prescribed to outpatients based on WHO prescribing indicators and conducted in Ethiopia.
ii) All male and female patients in any age (pediatrics, adults, and geriatric) who visited the outpatient department were included.
iii) All published articles without time limit were included.
iv) Studies which were published in English language and provided sufficient data for the review were included.
Exclusion criteria
i) Studies that are studied in the inpatient department were excluded during initial screening.
ii) Studies with unrelated outcome measures, missing or insufficient outcomes were excluded.
Data extraction
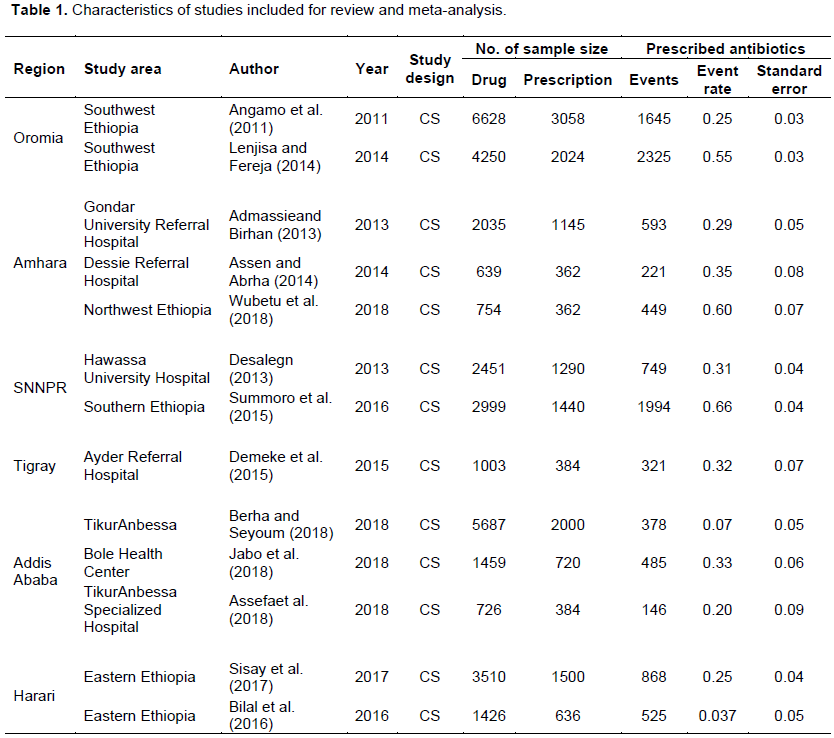
A standardized data extraction form was prepared in Microsoft Excel. Thereafter, the relevant data which is related to the study characteristics (region and study area, first author, year of publication, study design, population characteristics, and sample size) and our outcome interest (drug prescribing pattern including average number of drugs per prescription, percentage of drugs prescribed by generic name, percentage of encounters with an antibiotic prescribed, percentage of encounters with an injection prescribed and percentage of drugs prescribed from essential drug list or formulary) were extracted. Characteristics of studies included for review is attached in Table 1.
Articles identified through the major data base and indexing services
The articles identified, screened, assessed, and included for the review and meta-analysis were observed in Figure 1.
Quality assessment of studies
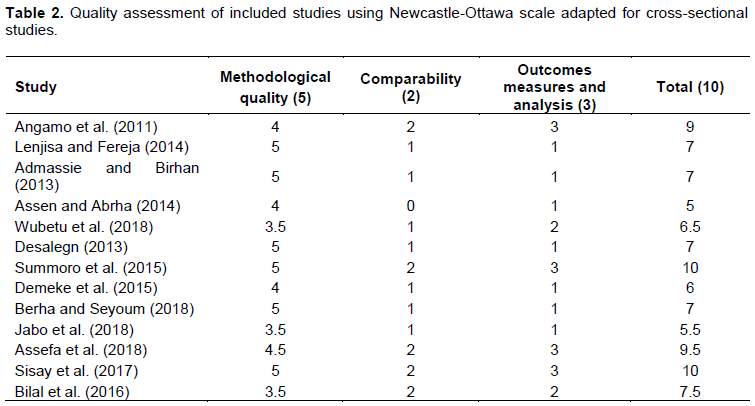
The quality of each study was assessed to ensure the internal and external validity of the study and to minimize the risk of bias. It was assessed based on Newcastle-Ottawa quality assessment scale adapted for cross-sectional studies (Wells, 2013)and graded out of 10 points. The assessment scale contains indicators that are grouped into three sections:
i) The methodological quality of each study and weighs a maximum of five points,
ii) Comparability of the study and takes 2 points,
iii) Outcomes measure of interest.
Each study which has a score ≥ five was included for review and meta-analysis.
Outcome measurements
This review and meta-analysis has a primary outcome, that is, the drug prescribing pattern of medications in Ethiopia which is expressed by prescribing indicators (Average number of drugs per medical prescription, Percentage of drugs prescribed by generic name, Percentage of drugs prescribed from essential drug list or formulary, Percentage of encounters with an antibiotic prescribed and Percentage of prescribed injectable drugs).
Data processing and statistical analysis
The relevant data were entered into the Open Meta Analystadvanced software. Then, the pooled estimate of outcome measures and subgroup analysis were analyzed by this software. By considering clinical heterogeneity in the studies, Der Simonianand Laird’s random-effects model was applied for the analyses at 95% confidence level. I2 statistics was used to assess heterogeneity across the studies. CMA version-3 software was used for publication bias assessment. The presence of publication bias was evaluated and presented with funnel plots of standard error and precision with Logit event rate (Begg and Mazumdar, 1994; Egger et al., 1997). P-value < 0.05 was considered as statistically significant.
RESULTS
Search results
A total of 180 records were identified from several sources. From these, 57 duplicate articles were removed and the remaining 123 records were screened using their titles and abstracts and 103 of them were excluded. Then, about 20 articles were evaluated based on the inclusion criteria. Seven articles were excluded because the outcome of interest was found missing and had insufficient information. Finally, 13 articles passed the quality assessment and eligibility criteria. So the 13 articles were included in the study (Figure 1).
Study characteristics
A total of 13 studies with 33,567 drugs from 15,305 prescriptions were included for systematic review and meta-analysis (Table 1). About 11 studies employed retrospective cross-sectional study design in common and the other 2 studies employed retrospective and prospective cross-sectional study design. The year of publication of included studies ranges from 2000 to 2018. The study included a wide range of population characteristics. The adjusted sample size ranged from 639 (Demeke et al., 2015)to 6628 drug samples in four randomly selected health facilities in southwest Ethiopia (Angamo et al., 2011). Regarding geographic distribution, 13 studies were obtained from five regions and one city administration (Addis Ababa). There is no study that was done in Somali, Gambela, Benshangul and Afar regions and Dire Dawa city administration. The average quality scores of studies assessed were ranges from five to ten based on the Newcastle-Ottawa assessment scale (Table 2).
Study outcome measures
The average number of drugs per prescriptions
From the 13 studies describing drug prescription pattern by WHO prescribing indicators, the pooled estimate the mean number of drugs per prescriptions in Ethiopia were found to be 1.96% with 95% confidence interval between 1.152 and 2.771.
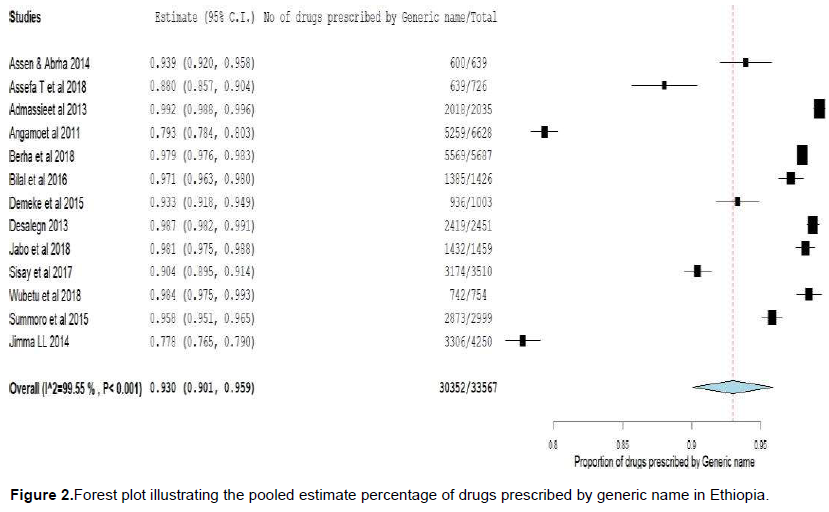
Percentage of drugs prescribed by generic name
The pooled estimate percentage of drugs prescribed by generic name in Ethiopia was found to be 93.0% with 95% confidence interval between 90.1 and 95.9%). Figure 2 showed heterogeneity across studies were high (I2 = 99.55%, p < 0.001).
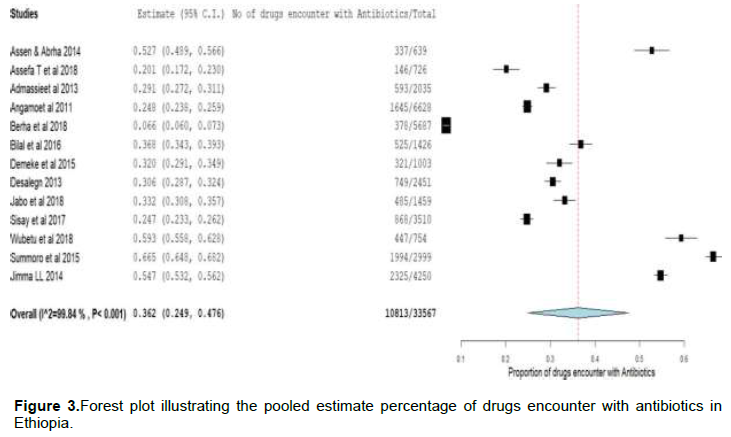
Percentage of drugs encounter with antibiotics
The pooled estimate percentage of drugs encounter with antibiotics in Ethiopia was found to be 36.2% with 95% confidence interval between 24.9 and 47.6%). Figure 3 showed heterogeneity across studies were high (I2 = 99.84%, p < 0.001).
Percentage of drugs encounter with injection
The pooled estimate percentage of drugs encounter with injection in Ethiopia was found to be 18.3% with 95% confidence interval between 13.1 and 23.6%).
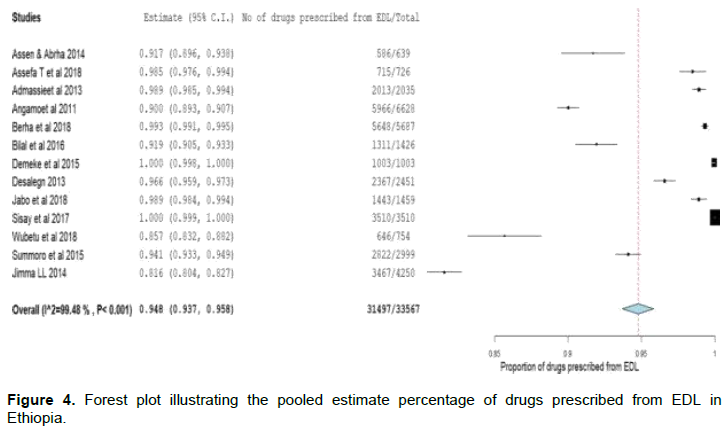
Percentage of drugs prescribed from Essential drug list (EDL)
The pooled estimate percentage of drugs prescribed from EDL in Ethiopia was found to be 94.8% with 95% confidence interval between 93.7 and 95.8%). Figure 4 showed heterogeneity across studies were high (I2 = 99.48%, p < 0.001).
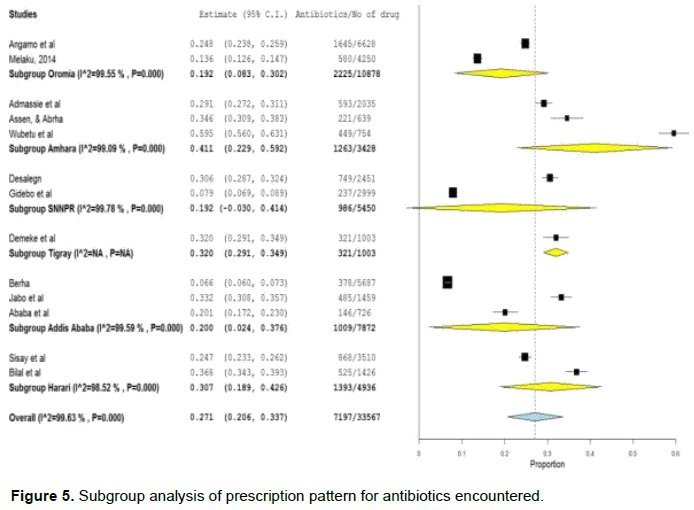
Sensitivity and subgroup analyses
Even though the outliers or one or more of the studies were excluded from the analysis, there was no significant change in the degree of heterogeneity (p < 0.001). So, all the studies were included for this review and meta-analysis. Subgroup analysis based on geographical distribution also performed. Subgroup analysis based on region revealed that the highest percentage of drugs encounter with antibiotics was observed at Amhara region, 41.1% (95% CI: 22.9 to 59.2%) followed by Tigray region with the prevalence of 32.0% (95% CI: 29.1 to 34.9%) (Figure 5).
Subgroup analysis based on region revealed that the highest percentage of drugs encounter with injection was observed at SNNPR region, 28.9% (95% CI: 11.5 to 46.2%) followed by Tigray region of 23.6% (95% CI: 21.1 to 26.3%).
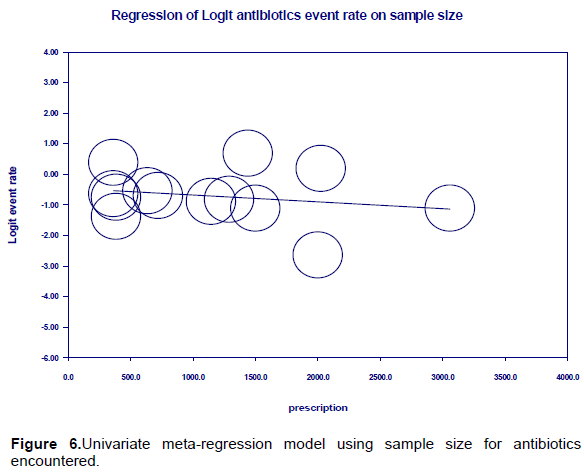
Univariate meta-regression for antibiotics and injectable drugs revealed that sampling distribution is not a source of heterogeneity (regression coefficient =0.0004;-0.000; p-value =0.4789; 0.9014 respectively) (Figure 6).
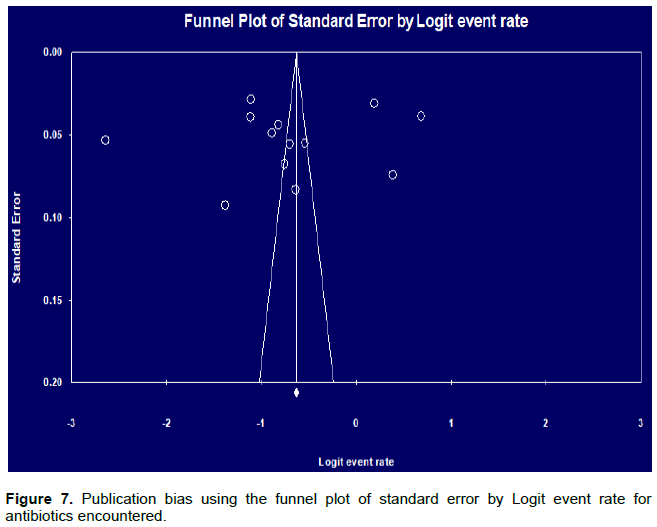
Publication bias
Funnel plots of standard error with logit effect size (event rate in this case) supplemented by statistical tests confirmed that there is no evidence of publication bias on studies reporting prescription patterns using WHO prescribing indicators in Ethiopia (Figure 7).
DISCUSSION
The results of this review and analysis showed that the average number of drugs per prescription was 1.96 which is in the optimal levels recommended by the WHO (100%) (World Health Organization, 2006).This indicates that poly pharmacy is not a problem in the country in general but in Harar region and Addis Ababa average number of drugs per prescription was higher than levels recommended by WHO (Berha and Seyoum, 2018; Bilal et al., 2016). This review and analysis showed that average number of drugs per prescription in Ethiopia was lower than that reported by the WHO fact book for the African region, European and Southeast Asia regions but it was lower than the American regions(Holloway and Verica, 2009). This review showed that the average number of drugs per prescription was lower than a review done in African region which was done in 11 African countries primary health care centers including Ethiopia (Ofori-Asenso et al.,2016).Drugs that were prescribed by their generic name in this study were 93.3% which is lower than that recommended by the WHO (100%) (World Health Organization, 2006). This review showed that drugs which were prescribed by their generic name was higher than a review done in African region (68.0%) which was done in 11 African countries primary health care centers including Ethiopia (Ofori-Asenso et al., 2016). This review suggest that there is a better generic prescribing rate than that reported by the WHO factbook for the African, European, American and Southeast Asian regions (Holloway and Verica, 2009).
In this review, percentage of drugs encounter with antibiotics in Ethiopia was 36.2% which exceeds the optimum value recommended by WHO (World Health Organization, 2006). The higher antibiotic prescribing rate reported for this review may indicate that antibiotic use is higher in Ethiopia. This higher antibiotic use may have a higher probability of the development of antibiotic resistance. Based on the region, this review revealed that the highest percentage of drugs encounter with antibiotics was observed at Amhara region, 41.1% (95% CI: 22.9 to 59.2%) followed by Tigray region of 32.0% (95% CI: 29.1 to 34.9%). This review showed that the percentage of drugs encounter with antibiotics was lower than a review done in the African region (46.8%) which was done in 11 African countries primary health care centers including Ethiopia (Ofori-Asenso et al., 2016). This review was higher when compared to estimates reported by the WHO fact book for the European regions but lower than Eastern Mediterranean region and American regions (Holloway and Verica, 2009).
In this review, the percentage of drugs encounter with injection in Ethiopia was found to be 18.3% which is in accordance with the recommended reference value of WHO (World Health Organization, 2006). Our review showed that the percentage of drugs encounter with injection was lower than a review done in African region (25.0%) which was done in 11 African countries primary health care centers including Ethiopia (Ofori-Asenso et al., 2016). This review was lower than the WHO fact book reported in which an injection use rate was 27.5%. The result also showed that there is a lower use of injectable medications when compared to results reported for West Pacific, American and Eastern Mediterranean regions but higher than European regions (Holloway and Verica, 2009).
In Ethiopia based on region, this review revealed that the highest percentage of drugs encounter with injection was observed at SNNPR region, 28.9% (95% CI: 11.5 to 46.2%) followed by Tigray region of 23.6% (95% CI: 21.1 to 26.3%).
The percentage of drugs prescribed from EDL in Ethiopia was found to be 94.8% which almost similar to the recommended reference value of WHO (World Health Organization, 2006). This review showed that EDL prescribing habit was higher than African regions (88.0%) which were done in 11 African countries primary health care centers including Ethiopia (Ofori-Asenso et al., 2016). It was also higher when compared to estimates reported by the WHO fact book for European, American, and the South East Asia regions (Holloway and Verica, 2009). The result showed that there is better adherence to EDL during prescribing in Ethiopia.
There is considerable heterogeneity among studies so this is one limitation of this review and meta-analysis. Another limitation is Egger’s test funnel plot detected no evidence of publication bias in this review and meta-analysis, but that estimation may not be sufficiently accurate because the number of included studies is small and some of the studies had relatively small sample size.
CONCLUSION
This systematic review and meta-analysis showed that the average number of drugs per prescription and percentage of drugs encounter with injection meet WHO prescribing indicators standard value whereas the percentage of drugs encounter with antibiotics, drugs prescribed by their generic name and drugs prescribed from EDL in Ethiopia are below WHO standard level. But this review and meta-analysis had considerable heterogeneity so it should be observed in caution. National research should be conducted to observe the prescribing pattern of medications in the country and to take possible action.
CONFLICT OF INTERESTS
The authors declared no conflict of interest.
REFERENCES
|
Angamo MT, Wabe NT, Raju NJ (2011). Assessment of patterns of drug use by using world health organization's prescribing, patient care and health facility indicators in selected health facilities in southwest Ethiopia. Journal of Applied Pharmaceutical Science1(7):62-66. |
|
|
Assefa T, Birhanu A, Tiya BGB (2018).Prescription Completeness and Drug Use Pattern in the University Teaching Hospital, Addis Ababa, Ethiopia. Journal of Basic and Clinical Pharmacy 9(4). |
|
|
Assen A, Abrha S (2014). Assessment of Drug Prescribing Pattern in. International Journal of Pharma Sciences and Research 5(11):777-781. |
|
|
Begg CB, Mazumdar M (1994).Operating characteristics of a rank correlation test for publication bias. Biometrics 1088-1101. |
|
|
Berha AB, Seyoum N (2018). Evaluation of drug prescription pattern using World Health Organization prescribing indicators in Tikur Anbessa Specialized Hospital: A cross-sectional study. Journal of Drug Delivery and Therapeutics 8(1). |
|
|
Bilal AI, Osman ED, Mulugeta A (2016). Assessment of medicines use pattern using World Health Organization's Prescribing, Patient Care and Health facility indicators in selected health facilities in eastern Ethiopia. BMC Health Services Research 16(1):144. |
|
|
Butler MB (1958). Rational Use of Drugs. BMJ 2(5111):1536-1536. |
|
|
Demeke B, Molla F, Assen A, Melkam W, Abrha S, Masresha B, Course T (2015). Evaluation of Drugs Utilization Pattern Using Who Prescribing Indicators in Ayder Referral Hospital , Northern. International Journal of Pharma Sciences and Research 6(2):343-347. |
|
|
Desalegn AA (2013). Assessment of drug use pattern using WHO prescribing indicators at Hawassa University teaching and referral hospital, south Ethiopia: a cross-sectional study. BMC Health Services Research13(1):170. |
|
|
Egger M, Davey Smith G, Schneider MMC (1997). Bias in Meta-Analysis Detected by a Simple, Graphical Test. BMJ (Clinical Research Ed), 315(7109). |
|
|
Admassie E, Birhan BWH (2013). Assessment of drug use practices and completeness of prescriptions in Gondar University Teaching Referral Hospital. International Journal of Pharmaceutical Sciences and Research 4(1):265-275. |
|
|
FMHACA (2012). Manual for Medicines Good Dispensing Practice. |
|
|
Lenjisa JL, Fereja TH (2014).A retrospective analysis of prescribing practices through WHO prescribing indicators at four selected hospitals of West Ethiopia. Journal of Bioanalysis and Biomedicine 6(2):29. |
|
|
Holloway K, Verica I (2009). Medicines use in primary care in developing and transitional countries; World health Organisation. 3. Retrieved from WHO/EMP/MAR/2009.3 |
|
|
Jabo SA, Tebeka AG, Asebe DS, Beri FZ, Temesgen DM, Beyene AT, Yilma FN (2018). Assessment of medication prescription pattern at bole health center, Ethiopia. International Journal 4(1):15. |
|
|
Liberati A, Altman DG, Tetzlaff J, Mulrow C, Gøtzsche PC, Ioannidis JP, Moher D (2009).The PRISMA statement for reporting systematic reviews and meta-analyses of studies that evaluate health care interventions: explanation and elaboration. Annals of Internal Medicine 151(4):65. |
|
|
Ofori-Asenso R, Brhlikova P, Pollock AM (2016). Prescribing indicators at primary health care centers within the WHO African region: a systematic analysis (1995-2015). BMC Public Health16(1):724. |
|
|
Sisay M, Mengistu G, Molla B, Amare F, Gabriel T (2017). Evaluation of rational drug use based on World Health Organization core drug use indicators in selected public hospitals of eastern Ethiopia: a cross sectional study. BMC Health Services Research17(1):161. |
|
|
Summoro TS, Gidebo KD, Kanche ZZ, Woticha EW (2015). Evaluation of trends of drug-prescribing patterns based on WHO prescribing indicators at outpatient departments of four hospitals in southern Ethiopia. Drug Design, Development and Therapy 9:4551. |
|
|
Well G, Shea B, O'Connell D, Peterson J, Welch V, Losos M, Tugwell P (2013). The Newcastle -Ottawa Scale (NOS) for assessing the quality of nonrandomized studies in meta analysis. |
|
|
Vooss AT, Diefenthaeler HS (2011). Evaluation of prescription indicators established by the WHO in Getúlio Vargas - RS. Brazilian Journal of Pharmaceutical Sciences 47(2):385-390. |
|
|
World Health Organization. (2002). Promoting rational use of medicines: core components. WHO Policy Perspectives on Medicines, pp. 1-6. |
|
|
World Health Organization. (2006). Using indicators to measure country pharmaceutical situations. |
|
|
Wubetu M, Derebe D, Mulaw T, Yimer T, Hailu G (2018). Assessment of Drug Prescription Pattern in Two District Hospitals, Northwest Ethiopia. Journal of Health Education Research and Development 06(01). |
|
Copyright © 2024 Author(s) retain the copyright of this article.
This article is published under the terms of the Creative Commons Attribution License 4.0


