Full Length Research Paper
ABSTRACT
Analysis of pepper genetic diversity and genetic relationship is important in selecting genetically diverse parental lines drawn from several genetic populations, and also helps to implement effective conservation strategies. For this purpose, 25 pepper genotypes comprising both accessions and improved varieties were examined using 16 SSR markers. The markers were polymorphic and showed a mean
Key words: Capsicum annum, genetic diversity, hybridization, pepper, SSR markers.
INTRODUCTION
Pepper (Capsicum annum L.) is one of the species from the Solanaceae family and genus Capsicum. Capsicum comprises around 38 recognized species believed to have originated in the tropical South American Regions, of which only five are domesticated and cultivated, namely C. annum, C. baccatum, C. chinense, C. frutescens and C. pubescent (Bosland et al., 2012; Moscone et al., 2007). C. annum is a self-pollinating diploid crop having a varied chromosome number of pungent type (2n=2x=24 and non-pungent (2n=2x=26) with comparatively large genome size (Moscone et al., 2007; Kim et al., 2014). The Pungent (chilli or hot pepper) and non-pungent (sweet pepper) variants of Capsicum annuum L. are the most popular vegetable and spices, with worldwide commercial distribution. Pepper is one of the ancient crops which has been domesticated for thousands of years contributing great importance to human welfare (Bosland et al., 2012).
In Ethiopia, it was first introduced by the Portuguese in the 17th century and subsequently from all over the world and it has since been cultivated for centuries and adapted to varied agro-ecological regions in the country (Geleta et al., 2005). The complex geographic environment and climatic conditions helped abundant germplasms of pepper to be evolved with different features, such as fruit type, pungency, and pests and disease resistance (Marame et al., 2009). For instance, there are reports on which Ethiopian origin small-fruited and pungent C. annum to be the most important and persistent source of powdery mildew (Leveillula taurica) (Jo et al., 2017)and wilt disease resistance (Woubit et al., 2021). Pepper in Ethiopia is grown in different agro-ecologies at altitudinal range from 1400 to 2120 m under rained and irrigated conditions mainly in South Nation Nationalities and Peoples, central (Eastern and Southern Shoa), western, north-western (Wellega, Gojjam) (Nigussie and Zewdia, 2021). According to the FAOSTAT report, Ethiopia produces 4511 metric tons regarded as one of the top five pepper (hot Pepper) producing country in Africa (FAOSTAT, 2016). The total estimated area covered under green pepper and red pepper is 11,409 and 174,463.62 ha, respectively, which is about 73% of the total vegetable production of the country (CSA, 2019), contributing an important role in the national economy. Pepper is a popular vegetable and spice crop in Ethiopia, and it is consumed in different forms. It is widely used in the Ethiopian diet, mainly used in traditional foods known locally as “Karia’’ the green fruit, eaten raw as a salad and dried red fruit grounded into powder, named ‘‘berbere” added as a sauce to “wot”. Pepper consumption is strongly ingrained in Ethiopian dietary habits, with an average daily consumption of 15 g by Ethiopian adults, which is higher than eating of other vegetable crops (Woubit et al., 2021). It is an excellent source for bioactive compounds, vitamins, dietary fibers and some essential minerals (Bosland et al., 2012). In addition, pepper has a wide variety of uses in pharmaceuticals, cosmetics, natural coloring agents, and as an ornamental plant. Despite its wide range of possible applications, Ethiopia's average pepper yield is low as compared to the global scenario (CSA, 2019). The scarcity of appropriate high-yielding varieties, the use of unknown seed sources and low-quality seeds, a poor irrigation system, insufficient knowledge about soil fertility, and the prevalence of fungal, bacterial, and viral diseases are some of the yield-limiting factors (Belay et al., 2019). As a result, pepper breeding goals are focused on overcoming those constraints in order to enhance national production and productivity. In Ethiopia, promising efforts are made to develop improved varieties, and some enhanced cultivars are under production (MANR, 2016).
Crop improvement heavily relies on a comprehensive understanding of the genetic variability and their genetic relationships, which could then be used in breeding programs. The information on genetic relationships has been used to estimate the genetic distance between the genotypes/species evaluated, allowing the species to be classified into distinct groups based on their genetic similarity (Ve and Palloix, 2013). This in turn necessitates the selection of genetically diverse parental lines drawn from several genetic populations and the varietal identification and purity test (Shapturenko et al., 2014). Whenever divergent parents are used in crossing programs, the progenies are expected to have a lot of heterosis (Jagosz, 2011)and increase the chance of obtaining superior segregants in advanced generations, and is important to enhance the genetic base. In addition, knowing the genetic resources of crops is crucial for implementing effective conservation strategies (Gollin, 2020).
The use of molecular markers for plant genetic diversity analysis is thought to be an appropriate tools (Collard and Mackill, 2008), because they are independent of environmental factors and can detect differences in alleles or changes in DNA sequence. Various molecular marker systems such as RAPD (Bhadragoudar and Patil, 2011; Devi et al., 2018), AFLP (Geleta et al., 2005; Aktas et al., 2009), ISSR (Patel et al., 2011; Alayachew et al., 2017; López Castilla et al., 2019)and SSR (Nagy et al., 2007; Dhaliwal et al., 2014; Christov et al., 2021; Woubit et al., 2021), have been utilized to examine the genetic diversity and phylogenetic relationships of pepper germplasms. The use of polymorphic, multi-allelic, reproducible, and widely distributed microsatellite markers in pepper accessions could assist in the selection of traits of interest and potential breeding materials for introgression through the use of molecular marker-assisted breeding and germplasm conservation (Mimura et al., 2012). Therefore, a more accurate analysis employing co-dominant microsatellite (SSR) markers is required to determine the genetic diversity and to infer the genetic relationship of Ethiopian peppers. To date, SSR markers have only been used in a few studies in Ethiopian pepper germplasms to assess the genetic diversity (Rabuma et al., 2020; Woubit et al., 2021)and the improved pepper cultivars have not been studied using SSR markers. Thus, the study aims are to identify and characterize Capsicum spp., as well as to capture the potential genetic divergence and genetic relationships among pepper accessions along with the improved varieties.
MATERIALS AND METHODS
Plant materials
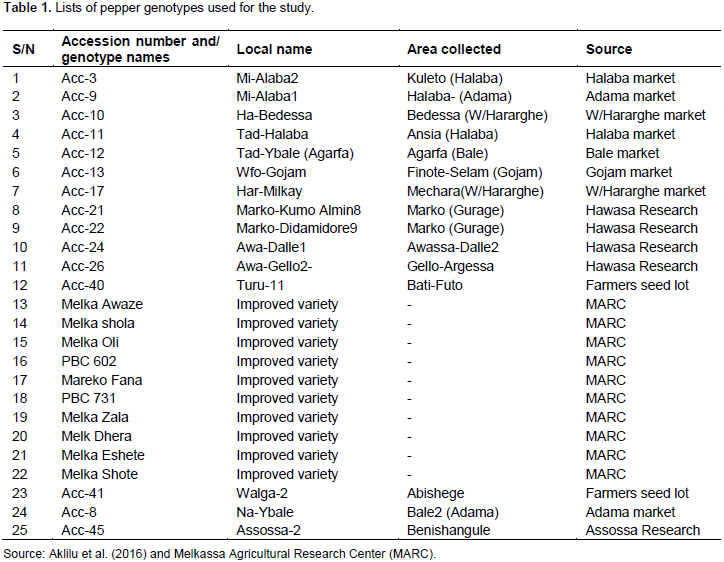
A total of twenty-five (25) pepper genotypes (Capsicum annum L.) were used for this study, which comprises of fifteen (15) accessions and ten (10) improved varieties (Table 1). Seed samples were obtained from Melkassa Agricultural Research Center (MARC).
Genotyping
Seeds from each genotype were sown in seedling raising tray in the greenhouse at National Agricultural Biotechnology Research Center (NABRC), Holeta. Young healthy leaves from a single seedling at the 2 to 3 leaf stage were collected in an Eppendorf tube and immediately dried using liquid nitrogen. The dried leaves were then pulverized using a Geno grinder (MM-200, Retsch) at 25 rpm for 3 min. Genomic DNA was extracted following plant DNA extraction protocol (DARTs, 2000)with minor modifications. The quality and quantity of the isolated DNA were checked by gel-electrophoresis using 0.8% agarose at 100 constant voltages for 45 min. The gels were visualized under UV light and photographed with a camera mounted on the UV Transilluminator. The quality and concentration of the DNA were further confirmed by a spectrophotometer (8 pedestal, Nano drop) at 260/280 nm wavelength absorbance. Good-quality DNA from each sample was used for PCR analysis after normalization to approximately 50 ng/µl (the normalization was carried out based on the concentration of each sample from Nano drop result).
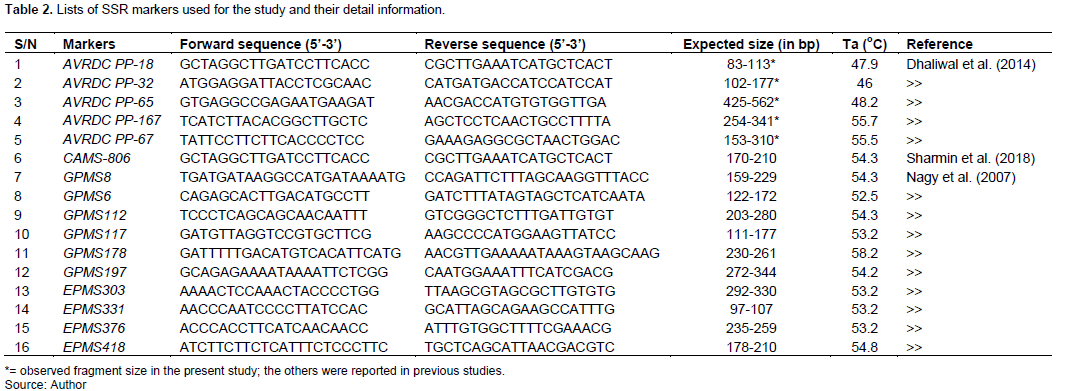
A set of 16 SSR markers previously reported by Nagy et al. (2007), Dhaliwal et al. (2014) and Sharmin et al. (2018)were obtained and used for the final genotyping of pepper collections (Table 2). Prior to whole sample amplification, gradient PCR was applied to each primer pair on BIO-RAD T100TM thermal cycler to get an optimum annealing temperature and other PCR setup. The polymerase chain reaction (PCR) was then carried out in a 12.5 µl final reaction volume containing 6.25 µl of Taq DNA polymerase, 0.5 µl of each forward and reverse primers, 3.25 µl of nuclease-free water, and finally 2 µl of gDNA. The PCR condition was adjusted at initial denaturation of 95°C for 5 min, 36 cycles of denaturation 94°C for 45 s, annealing varied with the primers (Table 2) for 45 s, extension 72°C for 90 s, and final extension 72°C for 10 min.
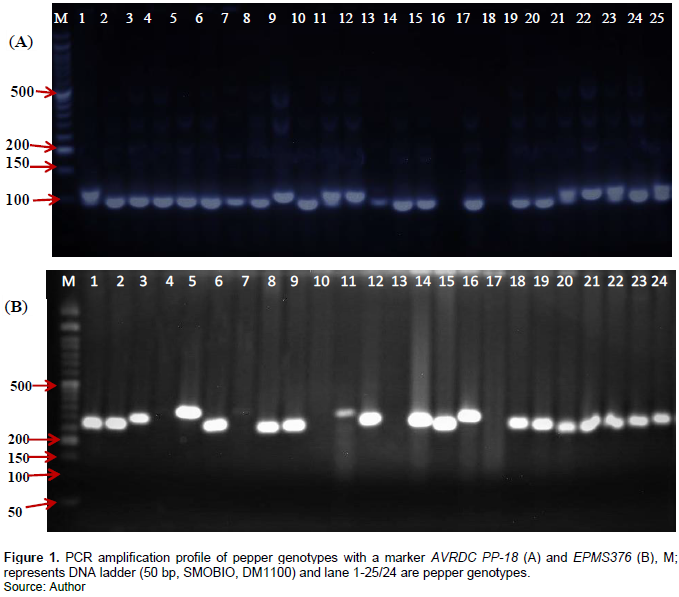
The amplified products stained with 6X loading dye-containing gel red, were separated by 3% agarose gel electrophoresis with 1×TAE buffer at 100v constant voltage run for 2:30 hrs. A 100 and 50 bp DNA ladder (SMOBIO, DM2100 and DM1100) was used to estimate the molecular weight of the fragments. The gels were visualized under UV light and image capture was done by a gel documentation system (UV Transilluminator).
Data scoring and analysis
The fragment sizes detected by each SSR region were scored using PyElph 1.4 software package (Pavel and Vasile, 2012) with respect to the size marker. For a single locus, fragments with the same mobility were treated as the same fragment size and treated as the same allele, while bands of differing molecular weight were treated as distinct alleles. To determine gene diversity (GD), observed heterozygosity (Ho), the number of alleles (Na), and polymorphic information content (PIC) in each marker, Power marker v3.25 software (Liu and Muse, 2005) was used. The PIC value for each primer was estimated using the formula:
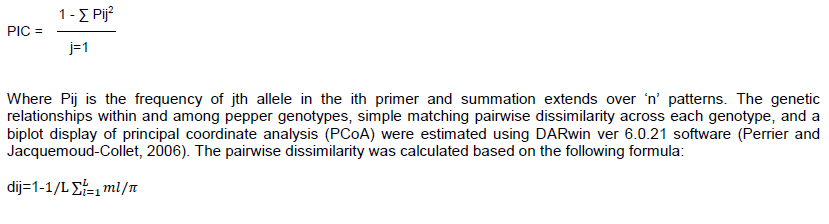
Where, dij=dissimilarity between units i and j, L=number of loci, π= ploidy level, ml= number of matching alleles for locus L.
Analysis of molecular variance (AMOVA) to estimate population genetic differentiation of among and within pepper accessions and improved varieties were computed by GenAlex 6.5 software (Peakall and Smouse, 2012).
A model-based population structure analysis was carried out with STRUCTURE ver.2.3.1 Software (Pritchard et al., 2000) using the admixture model with correlated allele frequencies. The number of possible K was set from 1 to 10 with 20 runs for each K, and each run had a burn-in period of 250,000 and 500,000 MCMC iterations. The optimum value of K was determined using ΔK simulation (Evanno et al., 2005) implemented in the web-based Analysis tool STRUCTURE HARVESTER v6.93 (Earl and vonHoldt, 2012).
RESULTS AND DISCUSSION
Gene diversity and markers polymorphism
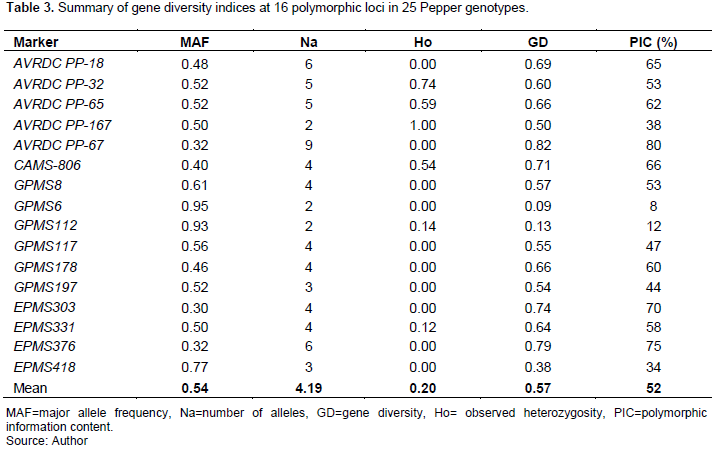
16 SSR markers were successfully implemented in 25 pepper genotypes to evaluate the gene diversity and levels of polymorphism within and among the accessions and improved varieties. The gene diversity indices varied across the entire markers in tested genotypes. The 16 SSR markers generated a total of 67 alleles, ranging from 9 for marker AVRDC PP-67 to 2 for markers AVRDC PP-167, GPMS6, and GPMS112 with a mean of 4.19 alleles per marker (Table 3).
Various results have been reported from similar studies on varying number of genotypes and markers. For instance, Rabuma et al. (2020)reported a lower mean number of alleles (2.2) in 32 Ethiopian and Indian accessions using 14 SSR markers. In contrast, a higher number of alleles were reported by Woubit et al. (2021)that identified a mean of 8.54 alleles in 75 Ethiopian pepper germplasms using 13 SSR markers. Similarly, a mean number of alleles of 6.9 are reported from a large Capsicum annum collection in 179 individuals from six countries, other than Ethiopian origins using 21 SSR markers (Christov et al., 2021). A relatively lower (2.7) mean number of alleles were reported in 64 Indian pepper accessions using 27 polymorphic SSR markers. Obviously, the number of alleles detected in the germplasm or population is influenced by the species' genetic backgrounds and the molecular markers difference deployed.
The major allele frequency (MAF) ranged from 30 to 95% with a mean of 54%. A mean value of 0.20 was obtained for observed heterozygosity (Ho) with the highest record (1.00) was attained by marker AVRDC PP-167 and no (0.00) observed heterozygosity by the ten markers (Table 3). The lowest Ho observed in most of the markers in our study is directly correlated with the fact that the majority of improved varieties and accessions are being homozygous. This can also be attributable to the high level of inbreeding that improved varieties are expected to exhibit. A variation in the levels of markers polymorphism has been observed (Figure 1), with a PIC value ranging from 8 to 80% and a mean of 52% (Table 3).
Molecular markers with PIC values of >0.50 (50%) are considered to be highly informative for genotyping studies (Botstein et al., 1980). Except for the two markers (GPMS6 and GPMS112), the others showed high PIC values, implying the presence of immense genetic diversity among studied genotypes and the very suitability of the markers for molecular characterization of pepper genotypes. Similar results were obtained with a mean PIC value of 0.57 using different SSR markers (Rabuma et al., 2020).
A gene diversity index is one of the most important measures of genetic divergence and is useful for determining the amount of diversity in the genotypes. The gene diversity (GD) in this study ranged from 0.09 to 0.82 with an average of 0.57 (Table 3), indicating the presence of high genetic diversity among Ethiopian pepper genotypes. The highest GD value (GD=0.82) was recorded for marker AVRDC PP-67 while the lowest (GD=0.09) was for marker GPMS6.
Genetic dissimilarity and phylogenetic relationship
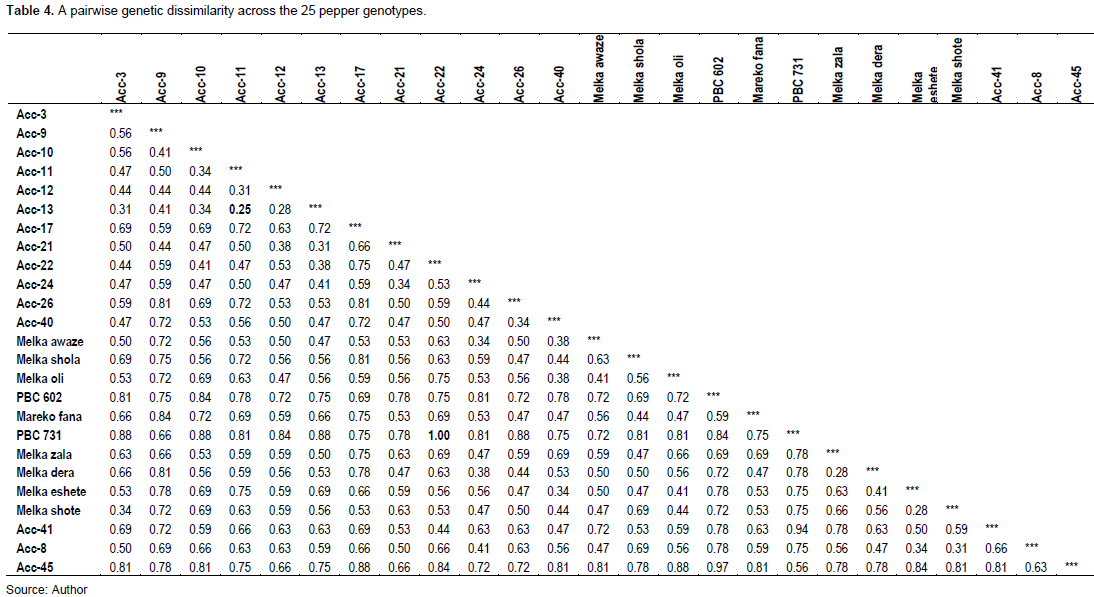
The pairwise genetic dissimilarity coefficient determines the genetic relatedness among the genotypes. The highest genetic distance value of 1.00 was observed between PBC-731 and Acc-22 and the lowest (0.25) was between Acc-13 and Acc-11 genotypes (Table 4). The dissimilarity coefficient value of 1.00 indicates that the two genotypes are genetically different; while, the the value 0.25 indicates that the two genotypes have a higher genetic similarity. In general, most of the pairwise dissimilarities obsereved were higher across the 25 genotypes implying a broad range of genetic variability basis among the tested pepper genotypes.
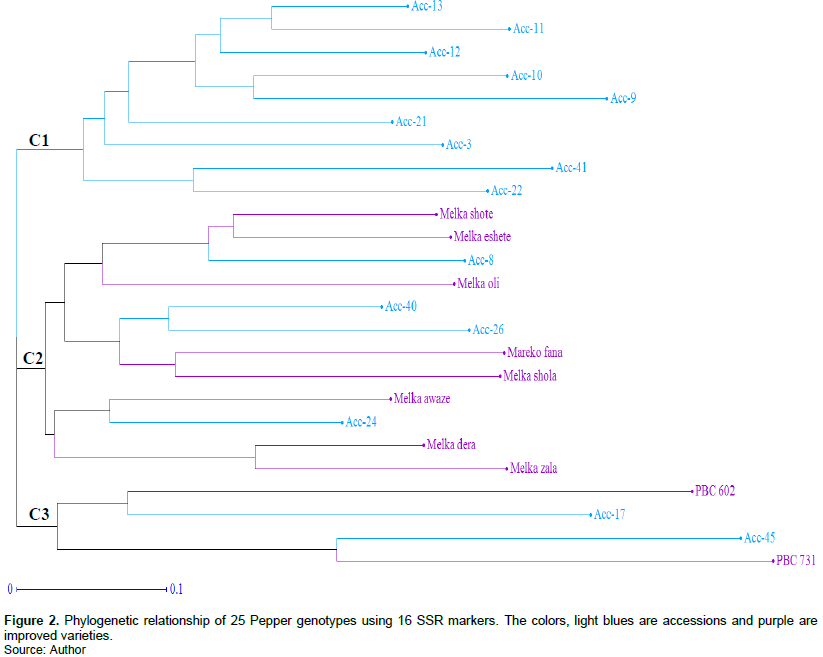
Several evolutionary factors influence genetic diversity among and within species, including seed dispersal, gene flow, natural selection, geographic range, and the diversity center (Sork, 2016). Cluster analysis was used to find the best possible grouping based on genetic distance. In the present study, a neighbor-joining (NJ) tree was built to determine the genetic relationship of the 25 pepper genotypes using 16 SSR markers, and the analysis deployed all of the genotypes into three major clusters and formed different sub-clusters (Figure 2). The first cluster (C1) comprised of 9 (100%) genotypes all of them are accessions, while the second cluster (C2) contained 12 genotypes of which 8 (67%) are improved varieties and 4 (33%) are accessions. The third cluster (C3) is composed of 4 genotypes, 2 (50%) are improved varieties while the other 2 (50%) are accessions. Although the first cluster comprises the majority of the accessions, some of the accessions were found dispersed in all of the other clusters, depicting the presence of a high genetic distance between accessions. Likewise, most of the improved varieties fell in the second cluster; while, some were in the third cluster, showing presence of considerable genetic distance between varieties though most seems relatively close. The current study did not split the genotypes in to only accessions and improved varieties. Besides, the cluster of the accessions was not based on their geographic proximity. Most likely, this could be due to seed mixture as some genotypes were collected from local markets (Aklilu et al., 2016). Additionally, lack of a formal seed system in the country (Abebe and Lijalem, 2011) may contribute to seed exchange across different geographic locations.
Phylogenetic analysis is useful not only for estimating the genetic distance of genotype collections but also for selecting crossing parental lines. Varieties with a greater genetic distance are generally recommended as parents to produce progeny with a heterosis effect. Indeed, the wide range of diversity in our tested genotypes could be important for broadening the genetic base because it enhances the chances of discovering more unique genes. Moreover, it provides the opportunity of hybridization between distant genotypes which helps in the production of heterozygous individuals with desirable traits.
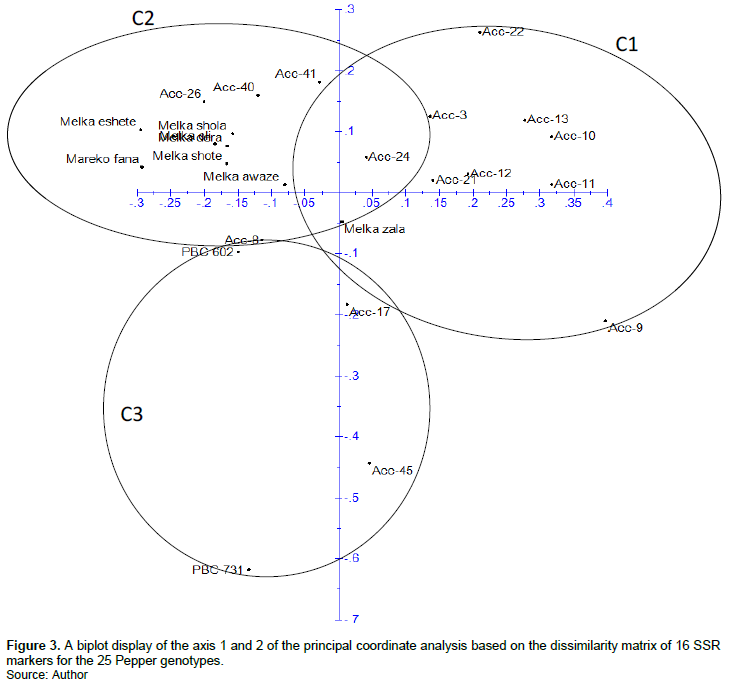
A two-dimensional display of principal coordinate analysis (PCoA) was also performed to further investigate the genetic relationship of pepper genotypes and the result showed the first three principal coordinate axes explained 44.33% of the total genotypic variation in the studied genotypes. The first and the second explained 17.01 and 16.06% of the total variation, respectively. The PCoA displayed a scatter plot with a wider dispersion of the genotypes in all the quadrants without forming a clear cluster, and some genotypes like PBC-731, Acc-45, Acc-9, and Acc-22 are plotted far from the central axis, indicating the individuals' genetic distance among pepper genotypes and such kind of genotypes are highly recommended for future pepper breeding (Figure 3). In most cases, even though the genotypes are displayed scattered across all quadrants in the PCoA, the majority of the accessions and improved varieties are somewhat separated and formed three clusters (C1, C2, and C3) based on their genetic background, as similar as the dendrogram.
Population structure and analysis of molecular variance
The population structure analysis was inferred on the 25 genotypes (15 accessions and 10 improved varieties).
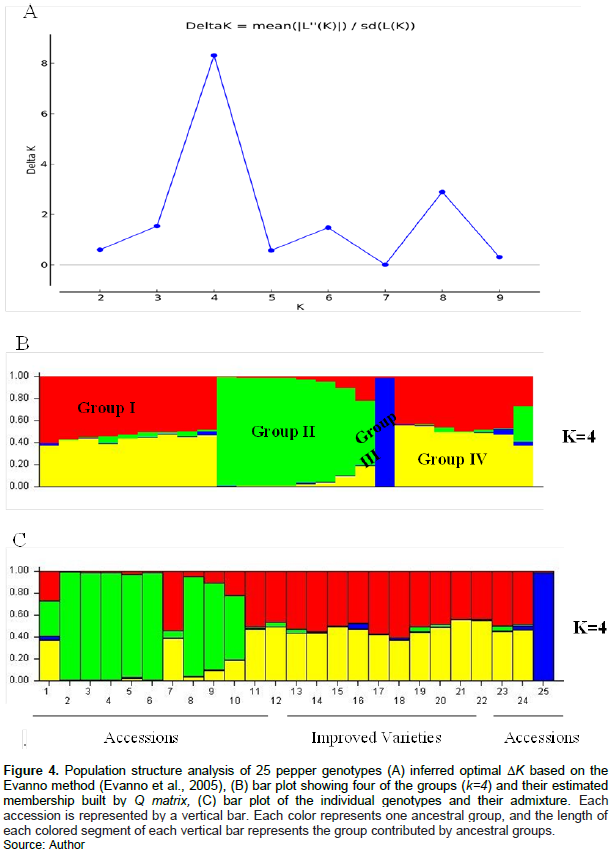
The highest value of delta K (?K) was obtained for K=4, revealing the existence of four genetic groups (Group I, Group II, Group III and Group IV) of pepper genotypes (Figure 4A and B). Group I comprised 9 genotypes, of which 5 were improved varieties and 4 were accessions. Group II and Group III consists of 8 and 1 accessions, respectively. Whereas Group IV constituted 7 genotypes, 5 of which are improved varieties while 2 are accessions. However, this structure analysis displayed that the group I and IV, and genotypes from the predicted genetic groups had a high level of admixture (Figure 4C). We speculate that the reason for this is maybe pepper genotypes were acquired from the different gene pools with a high-level of mixture, as reflected by a high level of gene flow (Nm=2.4) and low genetic differentiation between groups (Table 5). The grouping at K=4 showed less concordance with that of the dendrogram and PCoA, this is because the very few distantly related genotypes could have contributed for the less concordance. Reports from population structure analysis in other pepper diversity panel indicated the existence of well-differentiated population groups (Solomon et al., 2019; Rabuma et al., 2020). The same is true in the present study except we used relatively small number of genotypes.
Analysis of molecular variance (AMOVA) was used to quantify the genetic divergence within and among groups. We partitioned the total molecular variance based on the K=4 from STRUCTURE result and the priory grouping information into accessions and improved varieties (Table 5A and B). As a result, the total variation was partitioned in to 9% among the four groups, and 91% within groups.
Apparently, the high genetic differentiation has been demonstrated among individuals (Fis=1.00) as it is evident from Table 5. Almost the same result is obtained from the AMOVA based on the grouping with priory information in to improved varieties and accessions (Table 5B). Except for the negligible difference in estimated variance and F-statistics, exactly identical % of variations were found for among population (9%) and among individuals (91%) sources. This result may suggest that the ?K based grouping of the genotypes is somehow related to grouping in to the accessions and improved varieties which are genetical grouping as well.

Several variable results have been reported from previous studies conducted by various authors. Woubit et al. (2021) reported a partitioning of the total molecular variance in to 7% among eight-geographic groups, 63% among individuals, and 26% within individuals of Ethiopian pepper accessions. Similarly, in 32 Ethiopian and Indian accessions grouped in 9 populations by SSR markers, Rabuma et al. (2020)reported 32% of the total variation among populations and 68% within populations of the total variation. In another study conducted by SSR markers on Mexican pepper populations, of the total molecular variance among the population, 10% was among wild, landrace, and hybrids, 15% was among individuals within populations, and 74% was within individuals in the populations (Pacheco-Olvera et al., 2012). In a nut shell, levels of molecular variations explained by sources of variations in diversity studies are a function of the grouping compositions (varieties, landrace accessions, hybrids, advanced breeding lines etc.) the number of individuals, polymorphic power of the markers used etc.
CONCLUSION
Conclusively, the genetic diversity of Ethiopian pepper accessions and improved varieties are effectively investigated using SSR markers. Our result revealed that the SSR markers used were polymorphic suggesting their potential use for genetic studies of pepper collections. The markers detected a high genetic diversity in the studied pepper genotypes, which could be used as a source for breeding and genetic improvements. The results can aid breeders in effectively selecting genetically distant parents and applying hybridization. It is recommended that a large number of collections from all over the country have to be studied using efficient marker tools to generate more comprehensive information.
CONFLICT OF INTERESTS
The authors declare that they have no any conflict of interest.
ACKNOWLEDGMENT
The authors kindly acknowledge the Ethiopian Institute of Agricultural Research (EIAR), National Agricultural Biotechnology Research Center (NABRC) and Melkassa Agricultural Research Center (MARC) for the financial support, provision of pepper germplasms and allowing the lab facility.
REFERENCES
|
Abebe A, Lijalem K (2011). Recent development in seed systems of Ethiopia: Empowering Farmers' Innovation - Improving Farmers. International Conference on Sustainable Seed System in Ethiopia, Series No.(1): 1-93. |
|
|
Aklilu S, Abebie B, Wogari D, Tcklcwold A (2016). Analysis of morphological diversity among hot pepper (Capsicum annuum L.) collections in the Rift Valley area of Ethiopia. Tropical Agriculture 93(3):152-164. |
|
|
Aktas H, Abak K, Sensoy S (2009). Genetic diversity in some Turkish pepper (Capsicum annuum L.) genotypes revealed by AFLP analyses. African Journal of Biotechnology 8(18):4378-4386. |
|
|
Alayachew S, Atnafu D, Gedefa S (2017). Genetic diversity study of Ethiopian hot pepper cultivars (Capsicum spp.) using Inter Simple Sequence Repeat (ISSR) marker. Journal of Plant Molecular Breeding 5(2):27-37. |
|
|
Belay F, Abate B, Tsehaye Y (2019). Genetic diversity studies for morphological traits of hot pepper (Capsicum annuum L .) genotypes in Central Zone of Tigray Region, Northern Ethiopia. |
|
|
Bhadragoudar MR, Patil CG (2011). Assessment of genetic diversity among Capsicum annuum L. genotypes using RAPD markers. African Journal of Biotechnology 10(76):17477-17483. |
|
|
Bosland PW, Votava EJ, Votava EM (2012). Peppers: vegetable and spice capsicums (Volume 22). Cabi. |
|
|
Botstein D, White RL, Skolnick M, Davis RW (1980). Construction of a genetic linkage map in man using restriction fragment length polymorphisms. American Journal of Human Genetics 32(3):314-331. |
|
|
Christov NK, Tsonev S, Todorova V, Todorovska EG (2021). Genetic diversity and population structure analysis-a prerequisite for constructing a mini core collection of Balkan Capsicum annuum germplasm. Biotechnology and Biotechnological Equipment 35(1):1010-1023. |
|
|
Collard BC, Mackill DJ (2008). Marker-assisted selection: An approach for precision plant breeding in the twenty-first century. Philosophical Transactions of the Royal Society B: Biological Sciences 363(1491):557-572. |
|
|
CSA (Central Statistical Agency) (2019). Sample survey area and production of major crops (private peasant holdings, meher season). I:1-58. |
|
|
DARTs (2000). Plant DNA Extraction Protocol for DArT. Doc pp. 2-3. |
|
|
Devi AA, Brajendra N, Dinachandra M (2018). Genetic Diversity Analysis in Chilli (Capsicum annuum L.) Found in Manipur Using RAPD Markers. International Journal of Current Microbiology and Applied Sciences 7(10):257-262. |
|
|
Dhaliwal MS, Yadav A, Jindal SK (2014). Molecular characterization and diversity analysis in chilli pepper using simple sequence repeats (SSR ) markers. 13(31):3137-3143. |
|
|
Earl DA, vonHoldt BM (2012). Structure Harvester: A website and program for visualizing STRUCTURE output and implementing the Evanno method. Conservation Genetics Resources 4(2):359-361. |
|
|
Evanno G, Regnaut S, Goudet J (2005). Detecting the number of clusters of individuals using the software STRUCTURE: A simulation study. Molecular Ecology 14(8):2611-2620. |
|
|
FAOSTAT (2016). Crop production in Africa.Countries-select all; regions-Africa+(Total);elements-area and production quantity; items-pepper; Years-2010-2016. Avaliable at: |
|
|
Geleta LF, Labuschagne MT,Viljoen CD (2005). Genetic variability in pepper ( Capsicum annuum L.) estimated by morphological data and amplified fragment length polymorphism markers. pp. 2361-2375. |
|
|
Gollin D (2020). Conserving genetic resources for agriculture: economic implications of emerging science. Food Security 12(5):919-927. |
|
|
Jagosz B (2011). The relationship between heterosis and genetic distances based on RAPD and AFLP markers in carrot. Plant Breeding 130(5):574-579. |
|
|
Jo J, Venkatesh J, Han K, Lee HY, Choi GJ, Lee HJ, Choi D, Kang BC (2017). Molecular mapping of PMR1, a novel locus conferring resistance to powdery mildew in pepper (Capsicum annuum). Frontiers in Plant Science 8(December):1-11. |
|
|
Kim S, Park M, Yeom S, Kim Y, Lee JM, Lee H, Seo E, Choi J, Cheong K, Kim K, Jung K, Lee G, Oh S, Bae C, Kim S, Lee H, Kim S, Kim, M, Kang B, Ahn HK (2014). Genome sequence of the hot pepper provides insights into the evolution of pungency in Capsicum species. Nature Publishing Group 46(3):270-278. |
|
|
Liu K, Muse SV (2005). Power Maker: An integrated analysis environment for genetic maker analysis. Bioinformatics 21(9):2128-2129. |
|
|
López Castilla L del C, Garruña Hernández R, Castillo Aguilar C, de la C, Martínez-Hernández, A, Ortiz-García MM, Andueza-Noh RH (2019). Structure and genetic diversity of nine important landraces of Capsicum species cultivated in the Yucatan Peninsula, Mexico. Agronomy 9(7):376. |
|
|
MANR (2016). Plant Variety Release. Protection and Seed quality Control Directorate. Crop Variety Registered 19:330. |
|
|
Marame F, Dessalegne L, Fininsa C, Sigvald R (2009). Heterosis and heritability in crosses among Asian and Ethiopian parents of hot pepper genotypes. Euphytica 168(2):235-247. |
|
|
Mimura Y, Inoue T, Minamiyama Y, Kubo N (2012). An SSR-based genetic map of pepper (Capsicum annuum L.) serves as an anchor for the alignment of major pepper maps. Breeding science 62(1):93-98. |
|
|
Moscone EA, Scaldaferro MA, Grabiele M, Cecchini NM, García YS, Jarret R, Daviña JR, Ducasse DA, Barboza GE, Ehrendorfer F (2007). The evolution of chili peppers (Capsicum -Solanaceae): A cytogenetic perspective. Acta Horticulturae 745:137. |
|
|
Nagy I, Stágel A, Sasvári Z, Röder M, Ganal M (2007). Development, characterization, and transferability to other Solanaceae of microsatellite markers in pepper (Capsicum annuum L.). Genome 50(7):668-688. |
|
|
Nigussie G, Zewdia I (2021). Achievements of hot pepper and it agro-ecological requirements in Ethiopia?: A review paper 9(4):1-6. |
|
|
Pacheco-Olvera A, Hernández-Verdugo S, Rocha-Ramírez V, González-Rodríguez A, Oyama K (2012). Genetic diversity and structure of pepper (Capsicum annuum L.) from northwestern Mexico analyzed by microsatellite markers. Crop Science 52(1):231-241. |
|
|
Patel AS, Sasidharan N, Vala AG (2011). Genetic relation in Capcicum annum [ L .] cultivars through microsatellite markers: SSR and ISSR. 2(1):67-76. |
|
|
Pavel AB, Vasile CI (2012). PyElph - a software tool for gel images analysis and phylogenetics. BMC Bioinformatics 13(1). |
|
|
Peakall R, Smouse PE (2012). GenALEx 6.5: Genetic analysis in Excel. Population genetic software for teaching and research-an update. Bioinformatics 28(19):2537-2539. |
|
|
Perrier X, Jacquemoud-Collet JP (2006). DARwin software https://darwin.cirad.fr/ |
|
|
Pritchard JK, Stephens M, Donnelly P (2000). Inference of population structure using multilocus genotype data. Genetics 155(2):945-959. |
|
|
Rabuma T, Gupta OP, Chhokar V (2020). Phenotypic characterization of chili pepper (Capsicum annuum L.) under Phytophthora capsici infection and analysis of genetic diversity among identified resistance accessions using SSR markers. Physiological and Molecular Plant Pathology 112(April): 101539. |
|
|
Shapturenko MN, Tarutina LA, Mishin LA, Kilchevsky AV, Khotyleva LV (2014). DNA divergence as a criterion of a sweet pepper (Capsicum annuum L.) selection for heterosis. Russian Journal of Genetics 50(2):123-130. |
|
|
Sharmin A, Hoque E, Haque M, Khatun F (2018). Molecular Diversity Analysis of Some Chilli (Capsicum spp .) Genotypes Using SSR Markers 368-379. |
|
|
Solomon AM, Han K, Lee JH, Lee HY, Jang S, Kang BC (2019). Genetic diversity and population structure of Ethiopian Capsicum germplasms. PloS One 14(5):e0216886. |
|
|
Sork VL (2016). Gene flow and natural selection shape spatial patterns of genes in tree populations: Implications for evolutionary processes and applications. Evolutionary Applications 9(1):291-310. |
|
|
Ve C, Palloix AS (2013). Genotyping a large collection of pepper (Capsicum spp .) with SSR loci brings new evidence for the wild origin of cultivated C . annuum and the structuring of genetic diversity by human selection of cultivar types. pp. 2375-2390. |
|
|
Woubit DB, Eleni S, Fitsum S, Mekonnen A, Shimeles A (2021). Assessment of genetic diversity and wilt disease resistance in hot pepper (Capsicum annuum) germplasm from Ethiopia pp. 31-40. |
|
Copyright © 2024 Author(s) retain the copyright of this article.
This article is published under the terms of the Creative Commons Attribution License 4.0


