ABSTRACT
Principal component analysis is a multivariate statistical technique used to observe the variance and to assess the relative influence of various traits for aggregate variability. In this study, ten advance uniform rice lines were grown for two consecutive years and morphometric data on eight yield and yield related attributes were collected. The principle component analysis was performed on the means of two years’ agronomic data to identify the patterns of variation and to determine the selection criteria. The first five principle components accounted for 97.9% of total variation, with the first three components explaining the cumulative variability of 82.7%. The individual contribution of PC1, PC2 and PC3 were 46.8, 20.7 and 15.2%, respectively. The PC1 and PC2 projected more towards yield contributing traits such as panicle length, number of grains per panicle and 100 grain weight. Days to 50% flowering and days to maturity were grouped under PC3 which regarded as earliness component, as it had the traits which allowed for developing early and late maturing varieties. Panicle length & 100 grain weight showed negative direction to each other, however, both traits grouped under PC2 and genotype under this component were good for further yield improvement. Thus, the prominent traits grouped together in different principal components were causal to describe the variability and breeding consideration. The results of this study will be greatly helpful for the development of early maturing and higher yielding varieties in future breeding programs.
Key words: Oryza sativa, Principal Component Analysis (PCA), rotated component matrix, Biplot, Loading plot.
Rice (Oryza sativa L.) is an annual crop plant which belongs to the Poaceae (previously known as Gramineae) family. Rice is a major crop of world and have been grown in diverse ecological zones, with different response to disease, adaption, phenology and yield. It is the staple food of most of the developing countries and ranks second after wheat. Globally, it is cultivated on an area of ~154 million ha with an average yield of 400 million tons per year (Sohgaura et al., 2015). It contributes more than 20% of the daily calorie requirement. In Asia, more than 2 billion people fulfill their 60-70% calorie requirement from rice and its derivatives. Therefore, there is need to enhance the rice yield to meet the food demand of rapidly growing population. To overcome future food shortage, it is direly requisite to develop the high yielding varieties. The success of hybridization program depends upon the availability of genetic diversity in the germplasm of crop species (Tenorio et al., 2013). From beginning of crop improvement, evaluation of germplasm on basis of agronomic markers played an important role toward yield enhancement and to broaden the genetic variability for desired traits. For yield improvement in new breeding scheme, it is essential to study the yield and yield contributing traits in existing varieties and advance lines (Seyoum et al., 2012).
Multivariate analysis helps the plant breeders to formulate their selection approaches for improving the desired traits (Ravindra et al., 2012). Principal components analysis (PCA) is a multivariate statistical technique which is used to explore the variation among genotypes and remove redundancy in data sets when the variables are measured in different units (Maji and Shaibu, 2012). Therefore, it becomes appropriate to standardize the variables for relating the variation of a data set. It explores the resemblance among the variable and classify the genotypes on basis of inter-correlated dependent quantity variables (Idris and Khalid, 2013).
The core objective of the PCA is to drive the significant information from the variable data and describe it as new orthogonal variable sets to show the similarity behavior of observations and variables as points in graph. The Eigen value describes and measures the contribution of each component to the total variance while each coefficient of proper vector shows the percentage of participation of each original variable with that each principle component is related (Nachimuthu et al., 2014). The higher the coefficients value, either positive or negative, the more effective it will be in discriminating between entries. The variability among the genotypes of crop species should be uncover to develop new varieties with stability to tolerate severe abiotic and biotic factors (Bhakta and Das, 2008). Therefore, this study was conducted to exploit the genetic differences among the selected agronomic characters of rice advance lines for their possible use in future breeding programs.
This study was conducted at the experimental fields of Rice Research Institute, Kala Shah Kaku, Pakistan. The experimental material consisted of ten advance uniform lines with Basmati background and showing resistance to Bacterial Leaf Blight (BLB). These advance lines were grown in a randomized complete block design (RCBD) with three replications for two consecutive years (during kharif seasons 2015-2016 and 2016-2017). Thirty days old seedlings were transplanted in four rows of 5m length keeping plant to plant and row to row spacing 21 cm. Data were recorded on 10 randomly selected plants from two middle rows for these traits: Days to 50% flowering, days to maturity, plant height (cm), tillers per plant, panicle length (cm), grains per panicle, 100 grain weight (g) and grain yield (t/ha). The principle component analysis was performed on the means of two years’ agronomic data to identify the patterns of variation and determination of selection criteria. Those principle components (PCs) with Eigen values greater than one were selected as proposed by Jeffers (1967). Correlation matrix between observed traits were assessed and factor analysis was done using the MiniTab 15 software (Mohammadi et al., 2012).
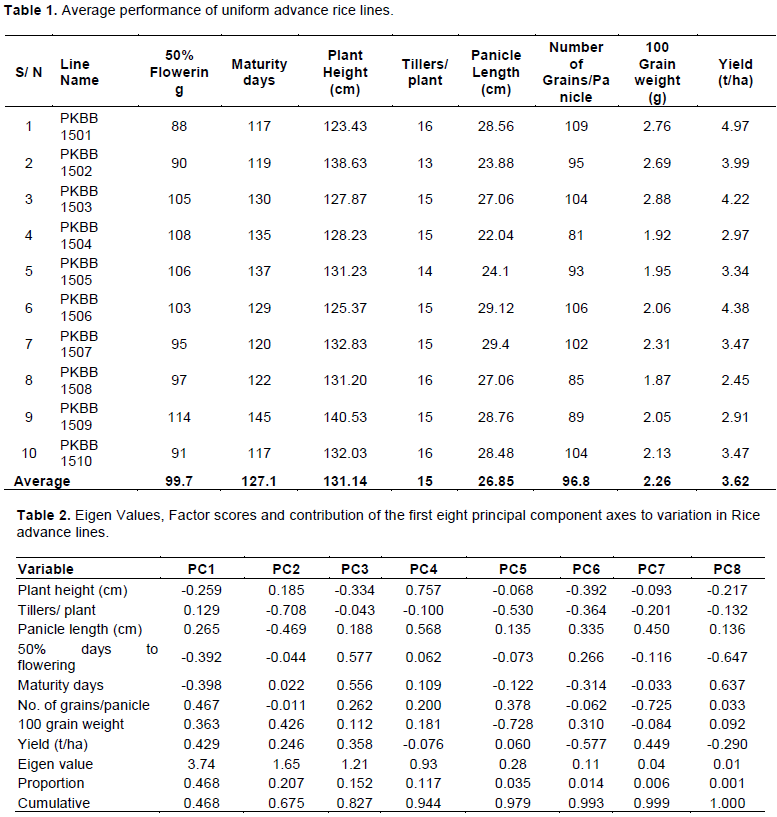
Analysis of variance (ANOVA) of all the traits under study was found to be highly significant. The days to 50% flowering ranged from 88 (PKBB 1501) to 114 (PKBB 1509) with a mean of 99 days. The days to maturity ranged from 117 (PKBB 1501 and PKBB 1510) to 145 (PKBB 1509) with a mean of 127 days. The lowest plant height (cm) was measured in PKBB 1501 (123 cm) and highest in PKBB 1509 (140 cm) with an average of 131 cm. The average tillers per plant were 15 with highest in PKBB 1508 (16) and lowest in PKBB 1502 (13). The maximum panicle length (29.4 cm) was measured in PKBB 1507 and minimum (22.04 cm) in PKBB 1504 with a mean of 26.8 cm. The number of grains per panicle (NGP) ranged from 109 (PKBB 1501) to 81 (PKBB 1504) with a mean of 96.8. The 100 grain weight (00 GW) ranged from 2.88 g (PKBB 1503) to 1.92 g (PKBB 1504) with a mean of 2.26 g. The maximum yield was measured in PKBB 1501 (4.97 t/ha) and minimum was measured in PKBB 1508 (2.45t/ha) with a mean of 3.62 t/ha (Table 1).
Principal Component Analysis (PCA) was done on eight morphological traits of ten advance uniform rice lines. The first five principle components accounted for 97.9% of total variation with the first three factors explaining the cumulative variability of 82.7%. The individual contribution of PC1, PC2 and PC3 were 46.8, 20.7 and 15.2%, respectively. Only the first three PCs had Eigen values greater than one, 3.74, 1.65 and 1.21 times the variance of original variables and selected for further studies (Table 2).
PC1 contributed 46.85% of the total variation and traits that positively contributed to variation included number of grains per panicle (0.467), yield (0.429), 100 grain weight (0.363), panicle length (0.265) and tillers per plant (0.129). All other characters contributed negatively to the first component. The second principal component (PC2) contributed 20.7% of the total variation. Traits that positively contributed in PC2 includes 100 grain weight (0.426), yield (0.246), plant height (0.185) and maturity days (0.022). The third principal component (PC3) accounted for 15.2% of the total variability and positively contributed traits, included days to 50% flowering (0.577), days to maturity (0.556), yield (0.358), number of grains per panicle (0.262), panicle length (0.188) and 100 grain weight (0.112) (Table 2).

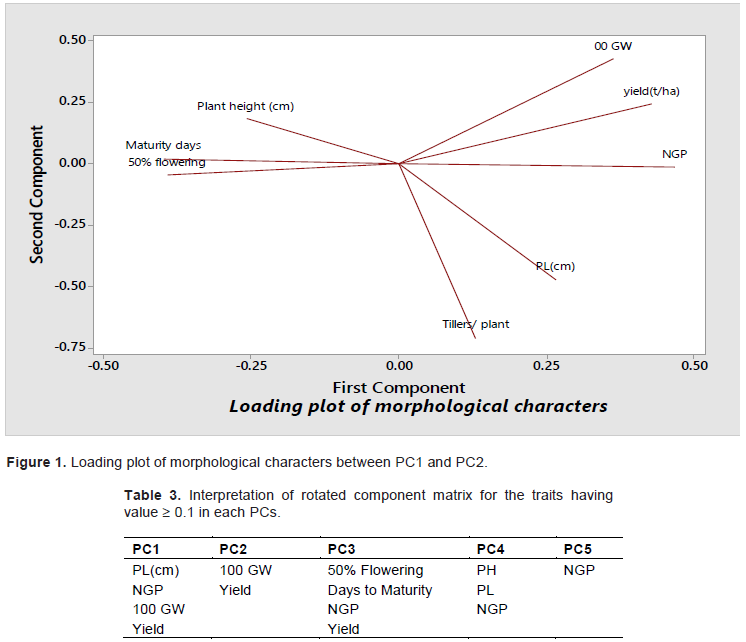
The loading plot between first (PC1) and second principal component (PC2) was constructed using variable observed traits. In PC1, 00 grain weight, yield and number of grains per panicle had more loaded score while panicle length and number of tiller per plant contributed to low variation in PC1 as compare to the other traits. In PC2, plant height, maturity days and days to 50% flowering score loaded heavily to the second component (Figure 1).
The rotated component matrix revealed that PC3 contributed to days to 50% flowering, days to maturity, yield and number of grains per panicle (Table 3). This component (PC3) is regarded as earliness factor as it has the traits which allow for development of early and late maturing varieties. Early varieties can escape abiotic and biotic stresses, however, Vishu et al. (2014) was not in agreement with this result. The PC1 and PC2 were also more prominent by yield contributed characters such as panicle length, number of grains per panicle and 100 grain weight (Table 3). Similar findings were reported by Kumar et al. (2012). Panicle length and 100 grain weight are characteristics which show negative direction to each other but both characteristics comes under PC2 simultaneously. This will be very helpful when selection is being carried out for those genotypes which comes under PC2. PC1 and PC3 can be subjected as yield factor and different selection schemes to bring rapid improvement of dependent variables. However, Sanni et al., (2012) and Nachimuthu et al., (2014) reported some contradictory results than our findings that PC3 related to earliness and yield contributed traits.
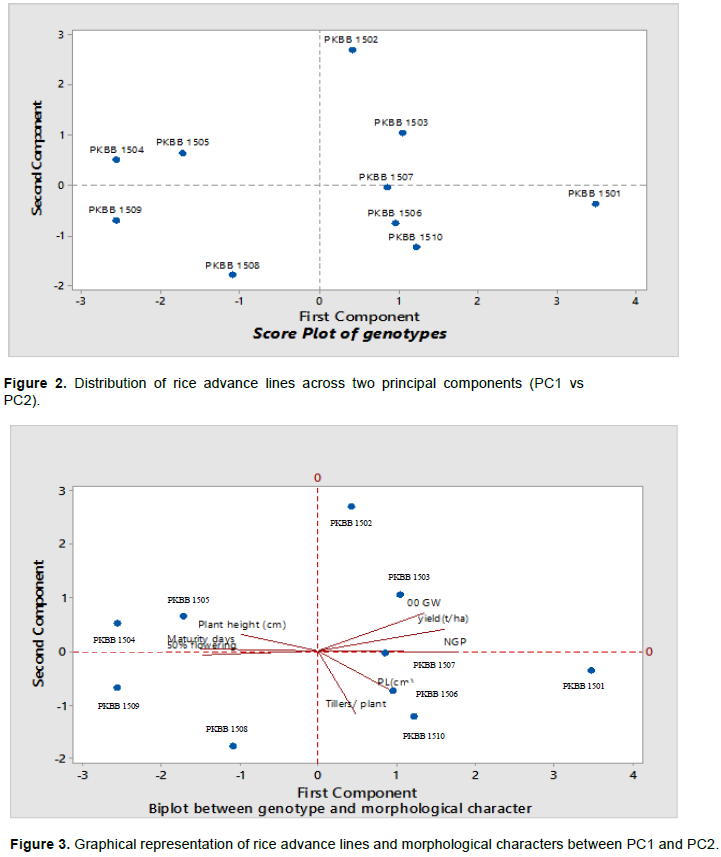
In PC1 vs PC2 score plot, rice lines in first quarter had high differences for characters contributing positively to PC1 and PC2. PKBB 1502 showed more diversity in this quarter than PKBB 1503 and PKBB 1507 and they are contributing more towards yield causal traits. The lines of quarter 2 showed much more variability for contributing traits having negative for PC1 and positive for PC2. PKBB 1504 exhibited more variation in this quarter than PKBB 1505. They are underlying more towards earliness characters. Lines at third quarter revealed that contributing traits were negative for PC1 and PC2.
Similarly, the fourth quarter had variability causative; negatively to PC2 and positively to PC1. PKBB 1501 exhibited more variation in the fourth quarter than PKBB 1506 and PKBB 1510. The lines located at far point of a quarter showed more variability compared to other lines present in the same quarter (Figure 2).
In order to determine the association between different measured characters of promising rice lines in differential display, it there need to subject them under biplot analysis. In this study, biplot of 10 advance rice lines was plotted along with their measured traits and biplot scattered all genotypes in their respective suitable response of traits (Figure 3). The biplot between PC1 and PC2 was ploted by using the variability among different earliness and yield contributing traits to identify relationship between these. In biplot, PKBB1502 and PKBB 1501 had longest vector towards yield contributing traits but was away from the late maturing vector. It showed that these lines were high yielding and earlier maturing.
The PK BB 1503 and PKBB 1507 were closely located to 100 GW and NGP vector, respectively. These vectors revealed that both lines had high value of yield contributing traits. But the PK1503 had longer vector as compared to PK1507 and showed more yielding potential than PKBB1507. On the other side, PKBB 1504, PKBB 1505, PKBB 1508 and PKBB 1509 had positive values toward days to maturity (late maturing) and negative towards the yield contributing vector which depicted that these lines are late maturing and lower yielding. The line PKBB 1510 had negative vector towards the late maturing vector and positive toward tillers/plant. Similarly, PKBB 1506 laid very closely to the panicle length vector. These results suggested that these rice genotypes are earlier maturing, have more tillering ability and are average yielding (Figure 3).
Our study will help plant breeders to evaluate advance uniform lines using multivariate analysis to characterize and evaluate the advance breeding materials accurately. The evaluated advance lines can also be used for the development of new lines for other important traits of interest such as tillering ability and disease resistance. The lines that are grouped under the same PC may share some underlying biological relationship, and their associations are often useful for generating hypothesis for better understanding of behaviour of complex traits that would allow breeders to maximize their knowledge. Thus, the prominent traits coming together in different principal components are causal towards clarifying the variability and have the trend to remain together. This may be kept into consideration during utilization of these characters in hybridization program.
The authors have not declared any conflict of interests.
REFERENCES
|
Bhakta N, Das SR (2008). Phenotypic stability for grain yield in rice. Crop correlation coefficient and path analysis for yield and yield related traits in upland rice (Oryza sativa L.). Journal of Plant Science 7(1):13-22.
|
|
|
|
Idris AE, Khalid AM (2013). Estimation of genetic variability and correlation for grain yield components in rice (Oryza sativa L.). Global Journal of Plant Ecophysiology 3(1):1-6.
|
|
|
|
|
Jeffers JNR (1967). Two case studies in the application of principal component analysis. Applied Statistics 16:225-236.
Crossref
|
|
|
|
|
Kumar A, Verulkar SB, Mandal NP, Variar M, Shukla VD, Dwivedi JL, Singh BN, Singh ON, Swain P, Mall AK, Robin S (2012). High-yielding, drought-tolerant, stable rice genotypes for the shallow rainfed lowland drought-prone ecosystem. Field Crops Research. 133:37-47.
Crossref
|
|
|
|
|
Maji AT, Shaibu AA (2012). Application of principal component analysis for rice germplasm characterization and evaluation. Journal of Plant Breeding and Crop Science 4(6):87-93.
Crossref
|
|
|
|
|
Mohammadi M, Sharifi P, Karimizadeh R, Shefazadeh MK (2012). Relationships between grain yield and yield components in bread wheat under different water availability (dryland and supplemental irrigation conditions). Notulae Botanicae Horti Agrobotanici Cluj-Napoca 40(1):195-200.
Crossref
|
|
|
|
|
Nachimuthu VV, Robin S, Sudhakar D, Raveendran M, Rajeswari S, Manonmani S (2014). Evaluation of Rice Genetic Diversity and Variability in a Population Panel by Principal Component Analysis. Indian Journal of Science and Technology 7(10):1555-1562.
|
|
|
|
|
Ravindra BV, K Sherya, KS Dangi, G Usharani, AS Shankar (2012). Correlation and path analysis studies in popular rice hybrids of India. International Journal of Scientific and Research 2(3):1-5.
|
|
|
|
|
Sanni KA, Fawole I, Ogunbayo A, Tia D, Somado, Futakuchi EA, Guei RG (2012). Multivariate analysis of diversity of landrace rice germplasm. Crop Science (52):494-504.
Crossref
|
|
|
|
|
Seyoum M, Alamerew S, Bantte K (2012). Genetic variability, heritability, correlation coefficient and path analysis for yield and yield related traits in upland rice (Oryza sativa L.). Journal of plant sciences 7(1):13.
|
|
|
|
|
Sohgaura N, Mishra DK, Koutu GK, Singh SK, Kumar V, Singh P (2015). Evaluation of high yielding and better quality rice varieties using principal component analysis. Ecology, Environment and Conservation (21):187-195.
|
|
|
|
|
Tenorio FA, Ye C, Redona E, Sierra S, Laza M (2013). Screening rice genetic resources for heat tolerance. SABRAO Journal of Breeding and Genetics 45(3):371-381.
|
|