ABSTRACT
Twelve chickpea genotypes were tested to assess variability, heritability, correlations and direct and indirect effects between yield and yield components. Maximum phenotypic and genotypic coefficient of variation was recorded for number of seeds per plant (33.8, 32.4), number of secondary branches per plant (30.3, 29.6), number of pods per plant (25.6, 24.7) and 100 seed weight (23.0, 22.7) respectively . High heritability coupled with high expected genetic advance as percent of mean were estimated for number of secondary branches per plant, number of pods per plant and 100 seed. Path coefficient analysis (seed yield as a dependent variable) revealed that seeds per plant followed by biomass yield, days to maturity and 100 seed weight had exerted positive direct effect on seed yield. To conclude, number of seeds per plant, biomass yield, 100 seed weight and days to maturity are important parameters for selecting maximum yielding genotypes in chickpea.
Key words: Chickpea, genetic variability, path coefficient, heritability, correlation, genetic advance.
Chickpea ranks third among pulses, and it accounts for 12% of the world pulses production (Khan and Khan, 2011). In Ethiopia it accounts for about 14.31% (third) of the acreage and 17.28% (second) of the total production of all grain legumes grown in the country. Area of production has been increasing greatly in recent years. In the 2011 main (MEHER) season, about 232,000 ha of cultivated land is used for the production of 400,200 tons of chickpea (CSA, 2012). Chickpea, a multi-functional crop, has an important role in the diet of the Ethiopian small scale farmers’ households and also serves as protein source for the rural poor who cannot afford to buy animal products. The crop also serves as a source of cash income and plays a major role in Ethiopia’s foreign exchange earnings through export to Asia and Europe. Despite its nutritional values and economic importance, the average yield of chickpea is relatively low in the country. This is primarily due to poor genetic makeup of the cultivars available, excessive vegetative growth, low tolerance to diseases and non-availability of grains of improved varieties which need immediate attention of the breeders for the evolution of maximum yielding varieties which fulfill the requirements of ever increasing population.
Genetic variability is a prerequisite for any breeding program, which provides opportunity to a plant breeder for selection of high yielding genotypes. However information on the association between yield and its various components provide the basis for the selection of improved varieties (Saleem et al., 2005). Information on the relative magnitude of the different sources of variation particularity among different genotypes for several traits helps in measurement of their range of genetic diversity and may provide evidence for identification of their relationship. The variability of a biological population is an outcome of genetic constitution of the individuals and its interaction with the prevailing environment. A survey of genetic variability with the help of suitable parameters such as genetic coefficient of variation, heritability estimates and genetic advance are absolutely necessary to start an efficient breeding program. Some of the characters are highly associated among themselves and with seed yield. The analysis of the relationships among these characters and their associations with seed yield is essential to establish selection criteria (Atta et al., 2008). Progress in any breeding program depends upon the nature and magnitude of variability present in the base population. Assessment of the extent of genetic variability within chickpea is fundamental for chickpea breeding (Qureshi et al., 2004).
Chickpea breeders should consider heritability estimates along with genetic advance because heritability alone is not a good indicator of the amount of usable genetic variability (Noor et al., 2003). The concept of heritability explains whether the differences observed among individuals arose as a result of differences in genetic makeup or due to environmental forces. Genetic advance gives an idea of possible improvement of new population through selection, when compared to the original population. The genetic gain depends upon the amount of genetic variability and magnitude of the masking effect of the environment. Information of the genetic variability, heritability and association of various characters provides a basis to the plant breeders to breed the chickpea genotypes possessing higher yield potential. Selection on the basis of grain yield, a polygenic character, is usually not very efficient, but selection based on its component characters could be more efficient. The present study was initiated with the prime objective of finding the mutual relationships of different quantitative traits and the type and extent of their contribution to grain yield.
Description of the experimental site
The field experiment was conducted in Maichew Agricultural College which is located at 39°32´E and 12°47´N in the Tigray National Regional State, Ethiopia. Maichew is found 123 km far from mekelle the capital city of Tigray region and 662 km north of Addis Ababa the capital city of Ethiopia. It is located at 2396 m above sea level and receives an average annual rain fall of 758.7 mm and annual mean temperature of 16.4°C.
Experimental materials and procedures
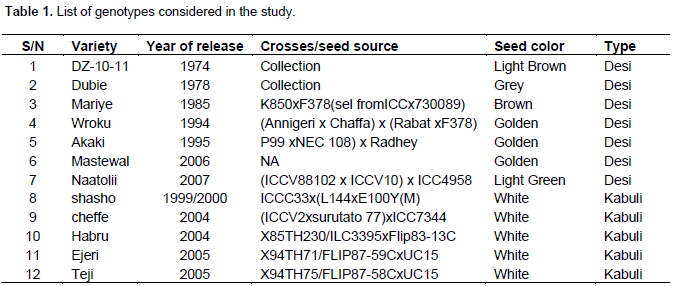
Twelve chickpea genotypes obtained from the High Land Pulse Research Program of Debre Zeit Agricultural Research Center (Table 1) were planted in a randomized complete block design with three replications. Each plot consisted of 4 lines of 4 m length by 1.2 m width (4.8 m2). The plant-to-plant and row-to-row distance was maintained at 10 and 30 cm, respectively. Agronomic practices were carried out as per recommendation.
Data collection
The following data were collected from the experiment both per plot and per plant basis.
Data recorded on plot basis
a) Days to 50% flowering (DF)
b) Days to 90% maturity (DM)
c) Grain filling period (GFP)
d) Hundred Seed weight (HSW)
e) Biomass yield (Biological yield) (BY)
f) Seed yield per hectare (SY)
Data recorded on plant basis
The data for the following characters were recorded from five randomly taken plants from each plot and the average value was considered per plant basis.
a) Plant height (PH)
b) Number of Primary Branches per Plant (NPB)
c) Number of Secondary Branches per Plant (NSB)
d) Number of Pods per Plant (PPt)
e) Number of Seeds per Pod (SPo)
F) Number of Seeds per Plant (SPt)
Statistical analysis
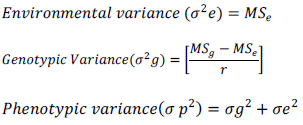
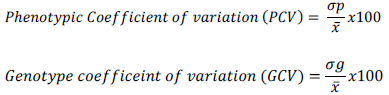
The phenotypic, genotypic and environmental variances and coefficient of variation is defined according to the formula suggested by Singh and Chaudhary (1985) as follows:
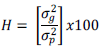
Where,  = grand mean of character. Broad sense heritability (H) expressed as the percentage of the ratio of the genotypic variance to the phenotypic variance will be computed on genotype mean basis as described by Allard (1960) as:
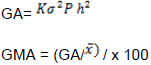
Genetic advance in absolute percent of the mean (GAM), assuming selection of superior 5% of the genotypes will be estimated in accordance with the methods illustrated by Johnson et al. (1955).
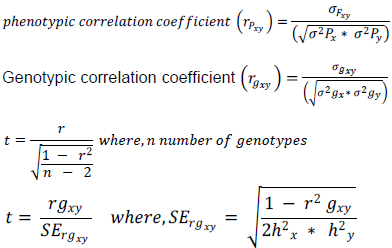
Phenotypic and genotypic correlation coefficients were estimated using the standard procedure suggested by Miller et al. (1958) from corresponding variance and covariance:
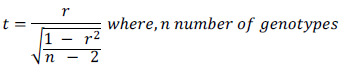
Phenotypic correlation coefficient was tested for their significance using the formula suggested by Sharma (1998).
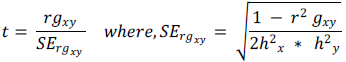
Genotypic correlation coefficient was tested with the following formula suggested by Robertson (1959):

SErgxy = Standard error of genotypic correlation coefficient between character X and Y h2x = heritability for character x and h2y = heritability for character y. The calculated absolute t value was tested against the tabulated t- value at g-2 degree of freedom for both phenotypic and genotypic correlations. Path coefficient analysis was estimated as suggested by Dewey and Lu (1959) using the phenotypic as well as genotypic correlation coefficients to determine the direct and indirect effects of yield components on seed yield based on the following relationship:
rij = Pij + Σ rik Pkj
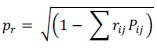
Where, rij = Mutual association between the independent character (i) and dependent character, grain yield (j) as measured by the correlation coefficients. Pij = Components of direct effects of the independent character (i) as measured by the path coefficients and Σ rik pkj = summation of components of indirect of a given independent character (i) on a given dependent character (j) via all other independent characters (k). The contribution of the remaining unknown factor was measured as the residual factor (PR), which is calculated as:

The magnitude of PR indicates how best the causal factors account for the variability of the dependent factor (Singh and Chaudhary, 1999).
It is clear from the Table 2 that The highest estimates for phenotypic coefficients of variation were recorded for number of seeds per plant (33.80), number of secondary branches per plant (30.28), number of pods per plant (25.64) and 100 seed weight (23.03). The higher phenotypic coefficients of variation values for number of pods per plant and 100 seed weight were in agreement with previous reports (Sharma and Saini, 2010). The highest genetic coefficients of variation were observed for number of seeds per plant (32.44), number of secondary branches per plant (29.56), number of pods per plant (24.67) and 100 seed weight (22.70). Similar results were reported (Sharma and Saini, 2010) who found high GCV values for secondary branches per plant, pods per plant and seeds per plant in chickpea genotypes. heritability estimate was high (>80%) for days to 50% flowering, grain filling period, 100 seed weight, number of secondary branches per plant, number of seeds per plant, number of pods per plant, seed yield, plant height, days to maturity and biomass yield. High heritability values for 100-seed weight, number of pods per plant, seed yield per plant, number of branches per plant and plant height were in accordance with previous reports by Sharma and Saini (2010).
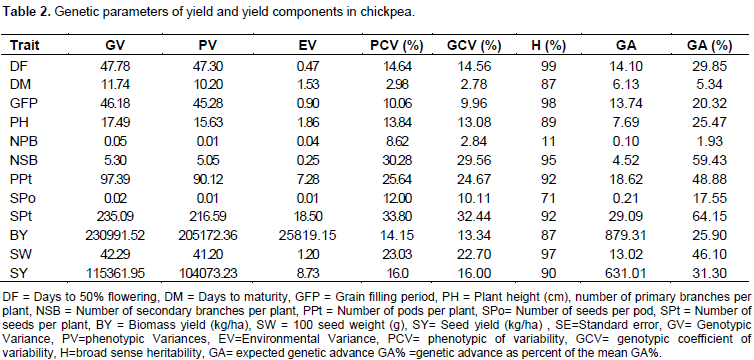
Genetic advance as percent of mean at 5% selection intensity was high for number of seeds per pod (64.2%) followed by number of secondary branches per plant (59.4%), number of pods per plant (48.9%) and 100 seed weight (46.1%). Ali et al. (2011) found higher values of genetic advance for number of pods per plant, plant height and grain filling period. The present study revealed that high heritability coupled with high expected genetic advance as percent of mean for number of secondary branches per plant, number of pods per plant and 100 seed weight. Therefore, these characters could be improved more easily than other characters measured in this study. Genotypic and phenotypic correlations among the characters are shown in Table 3. Seed yield showed positive and significant phenotypic association with biomass yield (0.75) and plant height (0.59) Therefore, any improvement of these characters would result a substantial increment in seed yield. Similar reports were observed by Vaghela et al. (2009), Malik et al. (2010) and Kobraee et al. (2010). The correlation coefficients of seed yield with hundred seed weight were positive at genotypic level and negative at phenotypic level. Biomass yield had significant positive genotypic and phenotypic correlation with seed yield. Similar results have been reported by Ali et al. (2011). Positive genotypic correlations of biomass yield with plant height (0.53), 100 seed weight (0.44) and number of primary branches per plant (0.32) have also been observed. Hundred seed weight had positive genotypic and phenotypic correlation with plant height. It had negative and significant genotypic and phenotypic correlation with number of secondary branches per plant (rg=0.83, rph= 0.81), seeds per pod (rg=0.87, rph= 0.73), pods per plant (rg=0.73, rph= 0.73) and seeds per plant (rg=0.84, rph= 0.79).
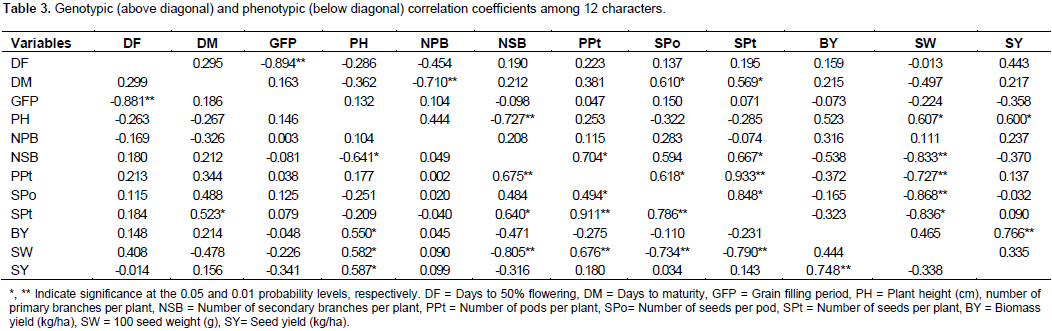
Negative association between 100 seed weight indicates a compensatory relationship between them. Pods per plant had positive and significant genotypic and phenotypic correlation with number of secondary branches per plant (rg=0.70, rph= 0.68) and seeds per plant (rg=0.93, rph= 0.91). A positive and significant genotypic and phenotypic correlation of number of pods per plant with number of secondary branches per plant agrees with the findings of Ali et al. (2011). Positive and significant genotypic and phenotypic correlation of seeds per plant with number of secondary branches per plant (rg=0.67, rph= 0.64), number of pods per plant (rg=0.93, rph= 0.91) and seeds per pod (rg=0.82, rph= 0.78) has been observed. Seeds per pod had significant positive genotypic and phenotypic correlation with seeds per plant (rg=0.85, rph= 0.79). Positive and significant correlation of number of secondary branches per plant with number of pods per plant (rg=0.70, rph= 0.68) and number of seeds per plant was observed at genotypic and phenotypic level. The positive and significant correlation of number of secondary branches per plant with number of pods per plant agrees with the findings of Malik et al. (2010). Plant height had positive and significant genotypic and phenotypic correlation with 100 seed weight (rg=0.61, rph= 0.58) and seed yield (rg=0.60, rph= 0.59), Plant height had positive genotypic correlation with biological yield and number of primary branches per plant. This is in line with the study by Ali et al. (2011) who found positive and non-significant genotypic correlation of plant height with number of primary branches per plant.
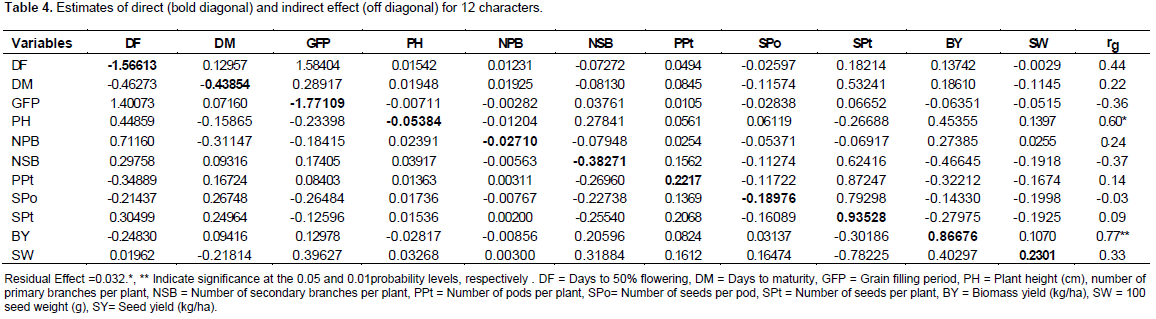
Generally, positive and significant association of pairs of characters at phenotypic level and positive and high correlation at genotypic level justified the possibility of correlated response to select. The negative correlations prohibit the simultaneous improvement of those traits. Thus, correlation analysis indicated that biomass yield and plant height were found to be important yield components and these traits can be used for yield improvement in chickpea (Table 3). Seeds per plant followed by biomass yield, days to maturity and 100 seed weight had exerted positive direct effect on seed yield. Deb and Khaleque (2005), Yucel et al. (2006) and Zali et al. (2011) reported similar results for seeds per plant. However, days to 50% flowering, grain filling period, number of secondary branches per plant, number of pods per plant, seeds per pod, plant height and number of primary branches per plant showed negative direct effect on seed yield. The high positive direct effect of 100 seed weight on seed yield was counterbalanced by its indirect effect via seeds per plant which finally resulted in positive and low genotypic correlation with seed yield. The residual (0.0315) indicates that characters which are included in the genotypic path analysis explained 96.85% of the total variation in seed yields (Table 4).

On the basis of these results it was suggested that pods per plant, primary branched per plant, secondary branches per plant and 100 seed weight may be given more importance while making selection for higher yield potential in chickpea.
The authors declare that there is no conflict of interests regarding the publication of this paper.
The author, Assefa Amare Hagos, would like to acknowledge Maichew agricultural college for financing the practical field expense of this study.
REFERENCES
|
Ali Q, Tahir MHN, Sadaqat HA, Arshad S, Farooq J, Ahsan M, Waseem M, Iqbal A (2011).Genetic variability and correlation analysis for quantitative traits in chickpea genotypes (Cicer arietinum L.). J. Bacteriol. Res. 3(1):6-9.
|
|
|
|
Allard RW (1960). Principles of plant breeding. John Wiley and Sons, Inc., New York.
|
|
|
|
Atta BM, Haq MA, Shah TM (2008). Variation and inter-relationships of quantitative traits in chickpea (Cicer arietinum L.). Pak. J. Bot. 40(2):637-647.
|
|
|
|
CSA (2012). The Federal Democratic Republic of Ethiopia, Central Statistical Agency, Agricultural Sample Survey 2011/2012 (2004 E.C.) (September – December 2011). Volume I. Report on Area and Production of Major crops (Private Peasant Holdings, MEHER season). Statistical Bulletin, May, 2012, Addis Ababa, Ethiopia.
|
|
|
|
Deb AC, Khaleque MA (2005). Path-coefficient analysis of yield and yield components in chickpea (Cicer arietinum L.). Indian Agric. 49(3&4):267-276.
|
|
|
|
Dewey DR, Lu KH (1959). A correlation and path coefficient analysis of components of crested wheat grass seed production. Agron. J. 51:515-518.
Crossref
|
|
|
|
Johnson HW, Robinson HF, Comstock RE (1955). Estimates of genetic and environmental variability in soybeans Agron. J. 47:314-318.
Crossref
|
|
|
|
Khan R, Khan H (2011). Dissection of genetic variability and heritability estimates of chickpea germplasm for various morphological markers and quantitative traits. Sarhad J. Agric. 27(1):67-72.
|
|
|
|
Kobraee S, Shamsi K, Rasekhi B, Kobraee S (2010). Investigation of correlation analysis and relationships between grain yield and other quantitative traits in chickpea (Cicer arietinum L.). Afr. J. Biotechnol. 9(16):2342-2348.
|
|
|
|
Malik SR, Bakhsh A, Asif MA, Iqbal U, Iqbal SM (2010). Assessment of genetic variability and interrelationship among some agronomic traits in chickpea. Int. J. Agric. Biol. 12:81-85.
|
|
|
|
Miller PA, William C, Robinson HF, Comstock RE (1958). Estimates of genotypic and environmental variances and co-variances in upland cotton and their implications in selection. Agron. J. 50:126-131.
Crossref
|
|
|
|
Noor F, Ashraf M, Ghafoor A (2003). Path analysis and relationship among quantitative traits in chickpea (Cicer arietinum L.). Pak. J. Biol. Sci. 6(6):551-555.
Crossref
|
|
|
|
Qureshi AS, Shaukat A, Bakhsh A, Arshad M, Ghafoor A (2004). An assessment of variability for economically important traits in chickpea. Pak. J. Bot. 36(4): 779-785.
|
|
|
|
Robertson A (1959). The sampling variance of the genetic correlation coefficient. Biometrics 15:469-485.
Crossref
|
|
|
|
Saleem MA, Zafar M, Ahsan M, Aslam M (2005). Interrelationships and variability studies for grain yield and its various components in chickpea (Cicer arietinum L.). J. Agric. Soc. Sci. 1(3):266-269.
|
|
|
|
Sharma JR (1998). Statistical and Biometrical Techniques in Plant Breeding. New Age International (P) Limited Publishers, New Delhi.432p.
|
|
|
|
Sharma LK, Saini DP (2010). Variability and Association Studies for Seed Yield and Yield Components in Chickpea (Cicer arietinum L.) Res. J. Agric. Sci. 1(3):209-21.
|
|
|
|
Singh RK, Chaudhary BD (1999). Biometrical Methods in Quantitative Genetic Analysis. Kalyani publishers, New Delhi. 318 p.
|
|
|
|
Singh RK, Chaundry BD (1985). Biometrical Methods in Quantitative Genetic Analysis. Kalayani Publishers, New Delhi-Ludhiana. 318p.
|
|
|
|
Vaghela MD, Poshiya VK, Savaliya JJ, Davada BK, Mungra KD (2009). Studies on character association and path analysis for seed yield and its components in chickpea (Cicer arietinum L.). Legume Res. 32(4): 245-249.
|
|
|
|
Yucel DO, Anlarsal AE, Yucel C (2006). Genetic Variability, Correlation and Path analysis of Yield and Yield Components in Chickpea (Cicer arietinum L.). Turk. J. Agric. For. 30:183-188.
|
|
|
|
Zali H, Farshadfar E, Sabaghpour SH (2011). Genetic Variability and interrelationships among agronomic traits in Chickpea (Cicer arietinum L.) genotypes. Crop Breed. J. 1(2):127-132.
|

 = grand mean of character. Broad sense heritability (H) expressed as the percentage of the ratio of the genotypic variance to the phenotypic variance will be computed on genotype mean basis as described by Allard (1960) as: