ABSTRACT
Fruit and vegetable maturity at harvest influences transportation and storage requirements as well as market value. However, small scale farmers in Uganda lack technologies for maturity assessment leading to high pre- and post-harvest losses and low financial returns from fruit and vegetable farms. This study, therefore, assessed the development of fruits (pineapple, passion fruit, watermelon) and vegetables (cabbage, egg plant, pumpkin and tomato), determined optimal maturity indices and fabricated and tested nondestructive tools for maturity assessment. Propagation trials and testing of tools were undertaken at Nangabo and Kangulumira sub counties in central Uganda. The findings show that eggplant, passion fruit, pineapple and pumpkin underwent 3 distinct development stages during which their diameter, length and outer colour changed. Cabbage remained green, but its bulb diameter and length varied with maturity. Watermelon had 4 development stages with significant (P≤0.05) changes in morphology and outer colour. Tomato fruits had 6 distinct outer colour changes. Age and colour were maturity indices for passion fruit. Fruit age and diameter were the maturity indices for watermelon. Age, diameter, length and colour were the maturity indices for pineapple, tomato and eggplant. Cabbage and pumpkin share indices including: age, diameter and length. A farm record book (FRB) was designed for documenting phenology and maturity stages of studied fruits and vegetables. A calibrated calliper (CC) and Calibrated tape (CT) were fabricated for assessing the morphological development in pineapple, tomato, eggplant, cabbage, pumpkin and watermelon. Customized colour charts (CCC) were designed for monitoring colour changes as passion fruits, pineapples, tomatoes and eggplants mature. On-farm trials show that CCCs were the most effective tools for monitoring passion fruit (80%), pineapple (64%), tomato (60%), eggplant (68%). Similar studies involving several cultivars and maturity determination tools are, therefore, recommended.
Key words: Fruit, Kangulumira, maturity index, maturity determination tools, Nangabo, vegetable.
Fruits and vegetables should be harvested with precision to ensure that their maturity meets or exceeds the minimum level acceptable to the consumer at the time they are consumed (Reid, 2002). According to Okiror et al. (2017b), development and use of non-destructive tools for monitoring the maturity of fruit and vegetable is a critical intervention towards determining optimal harvest time and minimizing pre-and postharvest losses. This is so because the maturity level at harvest is vital to the development of good flavor and taste quality in the fruit when fully ripe (Dadzie and Orchard, 1997). Xudong et al. (2009) assert that fruit and vegetable maturity influences market value, transportation and storage requirements. Thus, it is important for individuals harvesting fruit to have effective methods of determining maturity (Kader and Mitcham, 2008).
Several methods have been developed for the nondestructive determination of fruit and vegetable maturity (Slaughter, 2009). The nondestructive technologies are based on aroma, colour, defects, shape, size, firmness, composition and density (Chen, 1996; Abbott, 1999; Butz et al., 2005). Other destructive tools including laboratory determination of total soluble solids, total titrable acidity, starch content, moisture content and protein content were designed and evaluated for commercial manufacturers (Slaughter, 2009; AOAC, 2000).
The existing methods are expensive and technically robust and thus unapplicable to small-scale Ugandan farmers in the determination of the optimal time of fruit and vegetable harvest (Kato, 2011; Muzaale, 2014). This could be one of the key factors for increasing postharvest losses and food insecurity in Uganda (IPC, 2017). It is, therefore, critical to work with farmers to develop farmer low-cost and technologically adoptable maturity assessment tools that can minimize postharvest losses while at the same time ensuring financially sustainable returns for growers (Hanrahan and Röder, 2017).
This study was an attempt to fill a gap from previous scholars including Kader and Mitcham (2008), Slaughter (2009) and Zhang and McCarthy (2012) who focused on high cost technologies such as near infrared and magnetic resournance imaging, colorimeters and starch testers that may not be affordable to small scale farmers in Uganda. Hanrahan and Röder (2017), assert that for a technology to be useful for any operation, associated instruments should be accurate and reliable, especially when operated under field conditions by personnel with minimum training such as peasants in Uganda. In addition to the initial purchase price, the cost of labor (training, performing of task and maintenance) should be modest (Hanrahan and Röder, 2017).The specific objectives of this study were therefore to (i) investigate the development of fruits (pineapple, passion fruit and watermelon) and vegetables (cabbage, eggplant, pumpkin and tomato), (ii) determine the optimal maturity indices, and (iii) fabricate and test nondestructive tools for fruit and vegetable physical maturity assessment using low-skill and low-cost techniques in Uganda.
Description of study area
Study fruits (pineapple, passion fruit and watermelon) and vegetables (cabbage, eggplant, pumpkin and tomato) were propagated to determine maturity indices and design nondestructive maturity assessment tools, in Makerere University Agricultural Research Institute Kabanyolo (MUARIK), Nangabo Sub County, Wakiso district, central Uganda (Figure 1). MUARIK is located on coordinates 0°27’60’’N, 32°36’24’’E and at an altitudinal range of 1,250 to 1,320 m above mean sea level (Yost and Eswaran, 1990).

Komutunga and Musiitwa (2001) reported Kabanyolo to be part of the Lake Victoria basin that receives an average annual precipitation of 1,218 mm and slightly drier periods in June to July and December to February of the year. The average annual temperature is 21.5°C. Kabanyolo soils are formed on residuum and colluvium from quartzites, gneiss and basement complex rocks. A recent study by Okiror et al. (2017a) reported Kabanyolo soils to be acidic, with the pH ranging from 6.08-6.2, and deficient in organic matter and most essential minerals. The texture of MUARIK soil is predominantly clayey. On the side slopes, colluvium enriched with lateritic gravel is common (Yost and Eswaran, 1990). Training and research in agricultural sciences are the main activities conducted at MUARIK by the Makerere University College of Agricultural and Environmental Sciences and collaborating institutions (Okiror et al., 2017a ). However, as part of the Buganda surface, the predominant farming system around MUARIK is the banana-coffee system (Kisamba-Mugerwa, 2001).
On-farm testing of nondestructive maturity assessment tools was carried out with fruit and vegetable famers in Kangulumira Sub County, Kayunga district (Figure 1). Kagulumira is located on 0°34’54’’N, 33°1’46’’E within 1,070 m above mean sea level. Kangulumira sub county is part of Kayunga district that experiences a bimodal rainfall pattern with peaks between March and May and September to December of the year (NEMA, 2016). The rainfall is evenly distributed within the district. Subsistence agriculture employs almost 96% of the population (UBOS, 2016). The major food crops include bananas, sweet potatoes, cassava, maize, beans and ground nuts. Coffee is the main cash crop, but due to the coffee wilt disease, its production is declining. The farmers have opted for fruits (papaya, pineapples, watermelon, mangoes and passion fruit) and vegetables (amaranth, cabbages, eggplants, pumpkins, tomato) to diversify their sources of income and enhance household food security (UBOS, 2016).
Determination of maturity indices
The propagation trials were run between May and August 2015 at MUARIK. Save for pineapple that was propagated using suckers, other fruits (passion fruit and watermelon) and vegetables (cabbage, eggplant, pumpkin and tomato) seedlings were produced following procedures described by Pinho et al. (2011). The soils were ploughed and loosened using hand hoes. Manual watering was done on days in which the site did receive rains as done by most small-scale farmers in Uganda (Kato, 2011). The trials were run between May and August 2015. Seedlings were transplanted manually using hand hoes into pre-made holes in 3 randomized blocks on 26 May 2015. As is the case with most local small scale farmers (Muzaale, 2014), study fruits and vegetables were established in the field without application of any fertilization at transplanting. The cultivars that were studied are presented in Table 1.

Plants were tagged and data on leafing, root collar diameter, plant height, pest and disease incidence and weeding and pruning were recorded until flower emergence at 8 weeks (watermelon), 10 weeks (passionfruits), 13 weeks (pineapples), 14 weeks (eggplant and pumpkin) and 15 weeks after transplanting tomato. After flower emergence, fruit development was monitored as described by Pinho et al. (2011). On each study plant, randomly selectedfruits were tagged and fruit diameter, height, color and pest and disease incidence were recorded daily. Similar data was collected from cabbage samples.
Two (2) randomly selected fruits and vegetables were harvested from each of the respective maturity stages (Table 2) but in consideration of the three (3) slope positions in the three (3) propagation blocks, labelled and packed in a cool box (Marina 24S) to avoid manual contact. The harvest sampling of passion fruit (N=54), pineapple (N=54), watermelon (N=72), eggplant (N=54), pumpkin (N=54) and tomato (N=108) was based on outer colour, while cabbage (N=54) selection depended on the size of the bulb. Samples were harvested in the morning based on among other characteristics; (i) uniformity of color, (ii) size and (iii) absence of disease and injury (Pinho et al., 2011). The samples were labeled, packed in a cool box (Marina 24S) and delivered to Makerere University Food Science and Technology Laboratory for physico-chemical and nutritional analysis following Okia et al. (2013). The laboratory tests were undertaken to determine the morphological indicators that correlate with chemical parameters such as total soluble solids, protein content, total titrable acidity, pH and carbohydrate content.

Maturity assessment tools
Nondestructive and noninvasive tools were fabricated based on maturity indices for study fruits and vegetables. Local Artisans and Fine Artists in Nangabo Sub County were engaged to develop Farm Record Books (FRB), Calibrated Callipers (CC), Calibrated Tapes (CT) and Customized Colour Charts (CCC). The calibrations were based on fruit and vegetable development and maturation data (diameter, height, age and colour) and physico-chemical and nutritional analyses results on total soluble solids, carbohydrate content, total titrable acidity, pH and protein content. FRBs were designed to enhance farmers’ capacity to document and archive the planting or sowing dates, leafing, flowering, fruiting, maturity, quantity and quality of fruits and vegetables (Utegi and Utegi, 2014). While the CCs and CTs were fabricated using locally cut steel for assessing the morphological (diameter and length) development of pineapple, tomato, eggplant, cabbage and pumpkin (Muchui et al., 2010). Customized colour charts (CCC) were designed for monitoring colour changes in passion fruit, pineapple, tomato and eggplant (Dadzie and Orchard, 1997). Tools were calibrated using the fruit and vegetable planting or sowing dates, leafing, flowering, fruiting, diameters, lengths and colours. Thus, FRBs, CCCs, CTs and CTs were developed for each study fruit and vegetable.
On-farm validation of maturity assessment tools
To validate the non-destructive maturity assessment tools, on-farm tests were undertaken with 20 fruit and vegetable farmers in 4 villages in Kangulumira Sub County, Kayunga district in December 2016. Kangulumira sub county was selected because it is among the reknown areas for fruit and vegetable production in Uganda (Kato, 2011). The farmers were randomly selected from Kitabazi, Seeta, Soona and Wabukwa villages based on their Local Leaders’ lists as done by Agea (2010). Each farmer was tasked to use the tool and report whether it was effective or non-effective in determining fruit and/or vegetable maturity. Priority ranking was based on the number of farmers that cosidered the tool effective. A similar approach was used for farmer-led priority ranking in eastern and northern Uganda (Okia, 2010). The tools that were subjected to on-farm validation included FRB, CC, CT and CCC.
Data analysis
Data obtained from the monitoring of fruit and vegetable growth, physico-chemical and nutritional laboratory tests and on-farm validation of maturity assessment tools were entered in MS Excel (Vers. 2010) computer software. The Pearson’s correlations (r) were computed to determine the associations between morphological (age, diameter, length and colour) and nutritional maturity indices (total soluble solids, carbohydrate content, total titrable acidity, pH and protein content). Using MS Excel (Vers. 2010), analysis of variance (ANOVA) was run at 5% significance level to ascertain the most significant maturity indicators that were subsequently used to design the maturity assessment tools. Microsoft excel was used to generate frequencies and percentages that guided the priorititzation and ranking of maturity assessment tools.
Fruit and vegetable development
From the propagation experiment, three distinct development stages were observed for passion fruit during which its morphology (diameter and length) and outer colour changed (Table 2). The highest diameter (4.77 cm) was observed at green stage, followed by turning (4.35 cm) and the least was at purple passion fruits (4.20 cm). Fruit length also decreased with maturity of passion fruits, from 5.10 cm at green stage, 4.63 (turning) to 4.55 cm in purple samples. Watermelon had four (4) development stages with significant changes in the diameter, length and outer colour of the fruit. Fruit diameter and length increased as the fruit matured. The highest diameter of 16.60 cm was observed in the 4th stage (light yellow), followed by 13.30 cm in the 3rd stage (yellowish green) and the least (3.50 cm) was recorded in the 1st stage of fruit development. Fruit length increased from 5.60 cm at green stage, 21.20 (yellowish green) to 26.40 cm in light yellow watermelons (Table 2). The morphological changes in a watermelon are similar to what was observed in pineapple samples. Fruit diameter increased from 6.5 (purple), 6.8 (light purple) to 7.1 cm to yellow stage, while fruit length changed from 6.8, 7.1 to 7.8 in the purple, light purple and yellow pineapples, respectively.
Tomato fruit had six (6) highly ordered development stages during which its morphology (diameter and length) and outer colour changed (Table 2). The peak diameter (4.70 cm) was at turning, followed by 4.65 cm at pink stage and the lowest diameter (4.30 cm) was in the breaker. Fruit length was highest (5.55 cm) in the breaker, followed by green (5.30 cm) and lowest (4.95 cm) in the light red stage. Eggplant changed through three stages including purple (diameter =7.85 cm, length = 10.15 cm), bronze (diameter = 11.10 cm, length = 12.30 cm) to dark purple (diameter = 7.45 cm, length = 6.30 cm). Cabbage bulbs remained green through three distinct morphological changes. At stage 1, diameter was 6.3 cm and length was 6.15 cm. In stage 2, cabbage bulbs were 8.8 cm wide and 9.3 cm long. The 3rd stage of cabbage had an average diameter of 10.5 cm and 11.1 cm long. Pumpkin took three stages to mature including green, turning to yellow in which fruit diameter changed from 14.5 cm, 15.85 cm to 15.0 cm and length increased from 8.05 to 17.25 cm then dropped to 13.00 cm, respectively (Table 2).
Similar observations have been reported in other studies. For example Wu and Kubota (2008), observed tomato fruit enlarge with time after anthesis during the green stage, reach maximum size at around the end of the green stage and hardly change in size after the breaker stage through the red stage. Additionally, the changes in fruit diameter and length usually arise from variations in the cellular structure and internal structure of the fruit (Zhang and McCarthy, 2012). Similarly, this study reveals the unique changes in the diameter and length in the fruits (pineapples, passion fruit and watermelon) and vegetables (cabbage, eggplant, pumpkin and tomato) that were investigated.
In addition, fruit and vegetable maturity correlates with color which usually reflects the biochemical changes during ripening (Zhang and McCarthy, 2012). For example, tomatoes progressed from green to breaker, light pink, light red to red when fully mature. To enhance acceptance of fruit by consumers, tomatoes should be harvested at breaker stage for distant markets and fully ripe for local markets (Dadzie and Orchard, 1997). Other fruit and vegetable colour changes that were monitored in this study are relevant in the planning of optimal harvest regimes (Muchui et al., 2010), especially by small scale farmers in Uganda.
Maturity indices
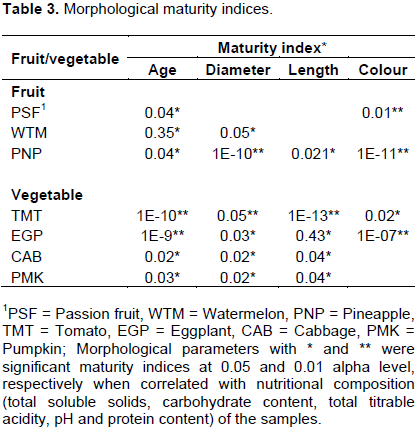
The maturity indices for study fruits and vegetables are presented in Table 3. Fruit age (P≤0.05) and colour (P≤0.05) were significant for passion fruits. It also emerged that fruit age (P≤0.05) and fruit diameter (P≤0.05) were significant for watermelon. In addition, fruit age (P≤0.05), diameter (P≤0.05), length (P≤0.05) and colour (P≤0.05) were significant for pineapples (Table 3). Tomato maturity can be gauged from the changes in its age (P≤0.05), diameter (P≤0.05), length (P≤0.05) and colour (P≤0.05). Similarly, eggplant development can be monitored based on age (P≤0.05), diameter (P≤0.05), length (P≤0.05) and colour (P≤0.05). Cabbage and pumpkin shared maturity indices including age (P≤0.05), diameter (P≤0.05) and length (P≤0.05) (Table 3).
The revelation of age as a maturity indicator for the sample fruits and vegetables observed in this study (Table 3) is supported by findings from other previous studies. According to Hanrahan and Röder (2017), the time of day and prevailing weather conditions influence product maturity and shelf life of fruits and vegetables. Further more, Mattheis and Fellman (1999) opin that fruits and vegetables harvested at an early stage of maturity are susceptible to shriveling and mechanical damage and develop poor flavor and taste, despite having long storage life. In contrast, harvesting at an advanced stage of maturity produces fruits and vegetables that have good taste and flavour, but have a short storage life and are not suitable for transporting for long distances (Dadzie and Orchard, 1997). This implies that fruit and vegetable age can be monitored as an indicator of maturity.
Colour is a useful indicator of fruit and vegetable maturity despite Zhang and McCarthy (2012) argument that during tomato processing, the fruit fed to the processing line are usually a mixture of tomatoes of multiple cultivars with varying maturity conditions. Thus, as much as colour is a significant index of maturity, it may not be reliable for a mixture of cultivars. Molyneux et al. (2004) stated that fruit or vegetable skin color may vary tween cultivars despite the cultivars falling within the same maturity stage. However, Dadzie and Orchard (1997) support external color because its assessment is noninvasive and nondestructive and does not require high skilled staff.
Morphological parameters such as diameter and length are equally vital maturity indicators. Muchui et al. (2010) demonstrated the relevance of the changes in fruit length and diameter in maturity determination. It was therefore recommended that the use of noninvasive tools be promoted among rural farmers to improve harvesting regimes, minimize postharvest losses and improve income and food security (Muchui et al., 2010; Robinson, 1996).
Maturity assessment tools
Based on the significant maturity indices in Table 3, the following tools were developed to enhance small-holder farmers’ capacity to assess fruit and vegetable maturity. A farm record book (FRB) was designed for documenting the planting or sowing dates, leafing, flowering, fruiting, maturity, quantity and quality of fruits and vegetables (Table 4). A calibrated caliper (CC) and calibrated tape (CT) were developed with local artisans for assessing the morphological (diameter and length) development of pineapple, tomato, eggplant, cabbage and pumpkin. Customized colour charts (CCCs) were designed for monitoring colour changes in passion fruit, pineapple, tomato and eggplant (Table 4).

As shown in Table 2, fruit and vegetable maturity can be determined by the number of weeks after fruit onset. Therefore, farmers with proper records can predict the optimal time of harvest and plan for transportation and marketing of fruit and vegetable products. The FRB should be used concurrently colour charts, callipers and diameter tapes to determine the optimal time of harvest. A farm record book refers to a tool for systematic documentation of all activities and transactions regarding all aspects of farm operations (Batte and Foster, 2008). Okojie and Ayinde (2012), categorized farm records into inventory, production (e.g. phenology, yield and maturity), expenditure and income and special supplementary records. To make FRBs useful, the records must be accurate, neat and complete and should be filled-out as soon as the operation or transaction occurs (Okojie and Ayinde, 2012). Utegi and Utegi (2014) analyzed the activities of a farmer and showed the relevance of farm records and accounting in agricultural production.
As much as FRBs are recommended, their adoption may face challenges including illiteracy and limited campaign by government agencies towards record keeping in Uganda. These challenges could be addressed through (i) issuance of low-interest bank loans to farmers as an incentive for farm record keeping, (ii) illiterate farmers employing relatives who are educated as data clerks, (iii) low taxation charges from government for farmers who keep farm records and (iv) distribution of fertilizers and subsidized farming tools to only farmers who keep records (Utegi and Utegi, 2014). Just like in most African countries, most small scale farmers in Uganda are less-educated, unwilling and financially unable to employ Clerks. Famers undertake mental record-keeping and accounting. There is, therefore, need to encourage documentation through farmer extension services (Winkler, 1938) to enhance farmers’ capacity to plan produce harvesting, transportation and marketing.
Calibrated callipers (CC) and calibrated tapes (CT) were developed with local artisans for assessing the morphological (diameter and length) development of pineapple, tomato, eggplant, cabbage, pumpkin and watermelon. Slaughter (2009), recognizes shape and size as characteristics for which nondestructive methods for assessing fruit and vegetable maturity. It is preferable to use noninvasive and nondestructive tools such as CC and CTs that can show structural variations as fruit or vegetable mature (Zhang and McCarthy, 2012). Besides, the CCs and CTs can be fabricated and maintained using locally available steel or woody material by artisans within the farmer community.
Customized colour charts (CCC) were designed for monitoring colour changes in passion fruits, pineapples, tomatoes and eggplants. The CCCs are noninvasive and nondestructive and can be used to assess fruit maturity and vegetable in the field, market or inspection points (Dadzie and Orchard, 1997). In addition, Slaughter et al. (2006) used nondestructive optical measurements in the visible region to measure maturity of peaches. Similarly, the USDA colour classification chart for fresh fruits is one of the most handy tools for assessing maturity and classifying fruits (USDA, 1991). Besides colour charts, other tools have been used to determine maturity from colour. For example, Malevski et al. (1977) used a colorimeter to assess skin colour of fruits. Jha et al. (2006, 2007) used a portable spectrophotometer to measure the average skin color and reflectance spectra of fruits and Ornelas-Paz et al. (2008) nondestructively measured the skin color of mangoes during ripening using a colorimeter. However, Malevski et al. (1977) assert that outer skin color measured with a colorimeter at an arbitrarily selected site on the fruit was an unreliable index of maturity. This study, therefore, recommends the use of low cost and low-tech CCCs as tools for fruit and vegetable maturity assessment by small-scale farmers in Uganda.
On-farm validation of maturity assessment tools
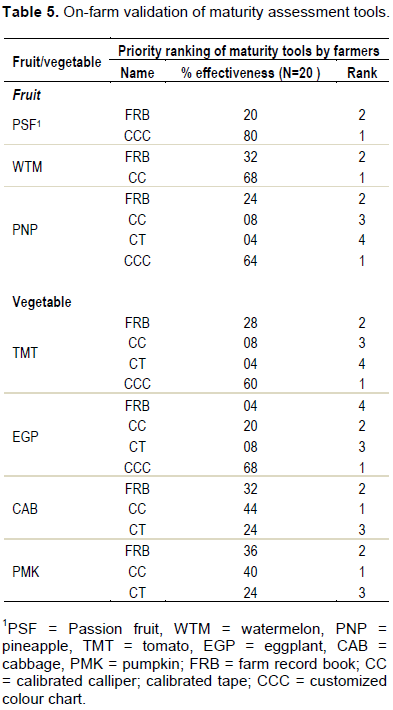
On-farm trials of the maturity tools was undertaken with 20 fruit and vegetable farmers in 4 villages in Kangulumira Sub County, Kayunga district (Table 5). It emerged that calibrated colour charts (CCCs) were the most effective tools for assessing the maturity of passion fruit (80%), followed by farm record books (20%). For watermelon, the farmers appraised calibrated callipers (68%) and farm registers (32%). Pineapple maturity assessment tools that were highly ranked by farmers included calibrated colour charts (64%), farm registers (24%) and calibrated callipers (08%).
Relatedly, calibrated colour charts (60%), farm registers (28%) and calibrated tapes (04%) were preferred for tomato monitoring by the study group. For eggplant assessment, the farmers prioritized calibrated colour charts (68%) and calibrated callipers (20%) and detested farm registers (4%). The tools preferred for monitoring the maturity of cabbage were calibrated callipers (44%), farm record books (32%) and the least was calibrated tapes (24%). Similarly, calibrated callipers (40%), farm record books (36%) and calibrated tapes (24%) were validated for pumpkin maturity measurement (Table 5).
The effectiveness of CCCs reported by farmers is not surprising because external fruit and vegetable appearance can be used to predict the internal characteristics (Slaughter, 2009). In addition, colour charts have been used by the United States Department of Agriculture for rapid maturity assessment for decades (USDA, 1991). The noninvasive and nondestructive nature of colour charts could also be another factor influencing farmers’ choice. In addition, the use of CCCs does not require highly skilled personnel and is, therefore, appropriate for illiterate farmers (Dadzie and Orchard, 1997).
Calibrated callipers (CCs) and calibrated diameter tapes (CTs) were validated for cabbage, eggplant, pineapple, pumpkin and tomato maturity measurement (Table 5). The fabricated CCs and CTs measure the outer diameter and length of the sample and are therefore nondestructive to the fruits or vegetable products. According to Zhang and McCarthy (2012) and Dadzie and Orchard (1997), it is advisable for small holder farmers to use easy-to-use and low cost maturity assessment tools. Perhaps the farmers noticed the simplicity and ease of fabrication and maintenance of the CCs and CTs that they prioritized to use them over other tools in their fruit and vegetable farms.
Farm record books were preferred for monitoring all the study fruits and vegetables by the sampled farmers (Table 5). The preference for FRBs is not uncommon among farmers especially literate ones. World over, farm record keeping is a reknown best practice. Other scholars including Batte and Foster (2008), Okojie and Ayinde (2012) and Utegi and Utegi (2014) agree that FRBs should be used to document inputs, practices, outputs and for growth and maturity assessment in fruit and vegetable gardens. Perhaps this could be one of the reasons Winker (2008) makes emphasis on the integration of farm record management in agricultural extension programmes.
This study demonstrates that passion fruit undergoes three distinct development stages during which its morphology (diameter and length) and outer colour change. Watermelon was observed to undergo four (4) development stages with significant changes in the morphology (diameter and length) and outer colour of the fruit. Pineapple fruit diameter and length increased as its outer colour progressed from purple, light purple to yellow stage. Tomato fruits undergo six (6) distinct development stages during which the morphology (diameter and length) and outer colour change. Eggplant diameter and length also changed through three stages including purple, bronze to dark purple. Cabbage remains green throughout three distinct morphological. Pumpkin takes three colour changes to mature including green, turning to yellow with variations in fruit diameter and length (Table 2).
Fruit age and colour were significant (P≤0.05) indices for passion fruits. Whereas fruit age and diameter were significant (P≤0.05) for watermelon. Age, diameter, length and colour are the maturity indices for pineapple, tomato and eggplant. Cabbage and pumpkins share the same maturity indices including: age, diameter and length (Table 3).
Furthermore, study findings indicate that a FRB is handiest tool for recording planting dates, leafing, flowering, fruiting and maturity of fruits and vegetables. A calibrated calliper (CC) and calibrated tape (CT) will be useful to for assessing the morphological (diameter and length) development of pineapple, tomato, eggplant, cabbage and pumpkin. Customized colour charts (CCC) are important for montitoring colour changes in passion fruit, pineapple, tomato and eggplant (Table 4). On-farm trial tests of the maturity tools with farmers showed CCCs as the most effective tools for assessing the maturity of passion fruit (80%), pineapple (64%), tomato (60%), eggplant (68%). 44, 40 and 68% of the farmers preferred CCs for monitoring the maturity of cabbage, pumpkins and watermelons, respectively (Table 5).
The authors have not declared any conflict of interests.
REFERENCES
|
Abbott JA (1999). Quality measurement of fruits and vegetables. Postharvest Biol. Technol. 15:207-225.
Crossref
|
|
|
|
Agea JG (2010). Use and potential of wild and semi-wild food plants in alleviating household poverty and food insecurity: A case study of Bunyoro-Kitara Kingdom, Uganda. Ph.D Thesis. School of Environment, Natural Resources & Geography, Bangor University, Bangor, U K. 360+xiv pp.
|
|
|
|
|
AOAC (2000). Association of Official Analytical Chemists. Official methods of analysis of the AOAC international. 17. ed. Washington, DC: AOAC.
|
|
|
|
|
Batte M, Foster L (2008). Ohio Farm Computer Usage. Farm Management Update, Winter 2003-04.20.
|
|
|
|
|
Butz P, Hofmann C, Tauscher B (2005). Recent developments in noninvasive techniques for fresh fruit and vegetable internal quality analysis. J. Food Sci. 70(9):R131-R141.
Crossref
|
|
|
|
|
Chen P (1996). Quality evaluation technology for agricultural products. Seoul, Korea: Agricultural Machinery Engineering.In. Proc. Intl. Conf. November 12-15, pp. 171-204.
|
|
|
|
|
Dadzie BK, Orchard JE (1997). Routine Post Harvest Screening of Banana/Plantain Hybrids. Criteria and Methods. INIBAP Technical Guidelines 2. IPGRI, Rome.
|
|
|
|
|
Hanrahan I, Röder S (2017). New Tools to Help Determine Maturity of Tree Fruit. Washington State University Tree Fruit. TIANNA.DUPONT.
View
|
|
|
|
|
IPC (2017). Report of the integrated food security phase classification Analysis for Uganda. Prepared by Uganda IPC Technical Working Group, January 2017. 80p.
|
|
|
|
|
Jha SN, Chopra S, Kingsly ARP (2007). Modeling of color values for nondestructive evaluation of maturity of mango. Food Eng. 78:22-26.
Crossref
|
|
|
|
|
Jha SN, Kingsly ARP, Chopra S (2006). Non-destructive determination of firmness and yellowness of mango during growth and storage using visual spectroscopy. Biosyst. Eng. 94(3):397-402.
Crossref
|
|
|
|
|
Kader A, Mitcham B (2008). Optimum Procedures for Ripening Mangoes. In. Fruit Ripening and Ethylene Management: 47-48. Univ. Calif. Postharvest Technology Research and Information Center Publication Series #9.
|
|
|
|
|
Kato J (2011). Green house tomato growers root for market. Agribusiness Magazine, New Vision, January 11th, 2011.
|
|
|
|
|
Kisamba-Mugerwa W (2001). Social Background. In: Mukiibi (Ed). Agriculture in Uganda – General information. NARO- Uganda, pp.186-199.
|
|
|
|
|
Malevski Y, Gomez-Brito L, Peleg M, Silberg M (1977). External color as maturity index of mango. J. Food Sci. 42:1316-1318.
Crossref
|
|
|
|
|
Molyneux SL, Lister C, Savage GP (2004). An investigation of the antioxidant properties and colour of glasshouse grown tomatoes. Int. J. Food Sci. Nutr. 55:537-545.
Crossref
|
|
|
|
|
Muchui MN, Njoroge CK, Kahangi EM, Onyango CA (2010). Determination of Maturity Indices of Tissue Cultured Bananas (Musa spp.) 'Williams' and 'Grande Naine'. Proc IC on Banana & Plantain in Africa. Eds.: T. Dubois et al. Acta Hort. 879, ISHS 2010.
Crossref
|
|
|
|
|
Muzaale F (2014). Growing good quality tomatoes. Farming Magazines, Daily Monitor. Wednesday January 8th, 2014.
|
|
|
|
|
NEMA (2016). State of the Environment Report for Uganda 2014. National Environment Management Authority (NEMA), Kampala.
|
|
|
|
|
Okia CA (2010). Balanites aegyptiaca: A resource for improving nutrition and income of dryland communities in Uganda. Phd thesis, University of Wales, Bangor, United Kingdom. 310 p.
|
|
|
|
|
Okia CA, Kwetegyeka J, Okiror P, Kimondo JM, Teklehaimanot Z, Obua J (2013). Physico-Chemical Characteristics and Fatty Acid Profile of Desert Date Kernel Oil. Afr. Crop Sci. J. 21(3):723-734.
|
|
|
|
|
Okiror P, Lejju JB, Bahati J, Rugunda GK, Sebuuwufu CI, Mulindwa P, Ocan JJ (2017a). Suitability of Kabanyolo Soils for Fruit and Vegetable Production. Open J. Soil Sci. 7:19-33.
Crossref
|
|
|
|
|
Okiror P, Lejju JB, Bahati J, Rugunda GK, Sebuuwufu CI (2017b). Maturity Indices of Tomato (Solanum lycopersicum L.), cv. Ghalia 281 in Central Uganda. Afr. J. Agric. Res. 12(14):1196-1203.
|
|
|
|
|
Okojie LO, Ayinde IA (2012). Course materials for AEM 302, Principles of Farm Management. Open Courseware, Unoversity of Agriculture, Abeokuta, Nigeria.
|
|
|
|
|
Ornelas-Paz JJ, Yahia EM, Gardea AA (2008). Changes in external and internal color during postharvest ripening of 'Manila' and 'Ataulfo' mango fruit and relationship with carotenoid content determined by liquid chromatography-APcI+-time-of flight mass spectrometry. Postharvest Biol. Technol. 50:145-152.
Crossref
|
|
|
|
|
Pinho L, Almeida AC, Costa CA, Paes MCD, Glória MBA, Souza RM (2011). Nutritional properties of cherry tomatoes harvested at different times and grown in an organic cropping. Hortic. Bras. 29:205-211.
Crossref
|
|
|
|
|
Reid MS (2002). Maturation and maturity indices. In. Postharvest technology of horticultural crops, A. A. Kader, ed. Univ. of California, Oakland, CA, USA: ANR Publication 3311. pp. 55-62.
|
|
|
|
|
Robinson JC (1996). Bananas and Plantains. 2nd edition. University Press, Cambridge.
|
|
|
|
|
Slaughter DC (2009). Nondestructive Maturity Assessment Methods for Mango: A Review of Literature and Identification of Future Research Needs. Biological and Agricultural Engineering, University of California, Davis, January 2009.
|
|
|
|
|
Slaughter DC, Crisosto C (2006). Nondestructive determination of internal quality in clingstone peaches. ASABE Paper 066180. St. Joseph, Mich. USA: ASABE.
|
|
|
|
|
UBOS (2016). The 2016 Statistical Abstract. Uganda Bureu of Statistics, Kampala, Uganda.
|
|
|
|
|
USDA (1991). United States standards for grades of fresh tomatoes. USDA, Agricultural Market Service, Washington, DC.
View
|
|
|
|
|
Utegi M, Utegi EN (2014). The Importance of Farm Records And Accounting In Agricultural Production. Katsina-Ala Multidiscip. J.
|
|
|
|
|
Winkler MM (1938). Farm Accounting from the Viewpoint of the Farm Manager. J. ASFMRA 2(1):27-56.
|
|
|
|
|
Wu M, Kubota C (2008). Effects of high electrical conductivity of nutrient solution and its application timing on lycopene, chlorophyll and sugar concentrations of hydroponic tomatoes during ripening. Sci. Hortic. 116:122-129.
Crossref
|
|
|
|
|
Xudong S, Hailiang Z, Yande L (2009). Nondestructive assessment of quality of Nanfeng mandarin fruit by a portable near infrared spectroscopy. Int. J. Agric. Biol. Eng. 2(1):65-71.
|
|
|
|
|
Yost D, Eswaran H (1990). Major Land Resource Areas of Uganda.World Soil Resources. Soil Conservation Service-USDA. Washington D.C, USA. 227p.
|
|
|
|
|
Zhang L, McCarthy MJ (2012). Measurement and evaluation of tomato maturity using magnetic resonance imaging. Postharvest Biol. Technol. 67:37-43
Crossref
|
|