Full Length Research Paper

ABSTRACT
Genetic diversity assessment of genetic resources maintained at Gene-Banks has important implication for future improvement, conservation and collection activities. However, such information is not available for sesame collected by IBC, Ethiopia. Inter simple sequence repeat (ISSR) marker was used to assess the level of genetic diversity, genetic structure and genetic distance, and to indirectly estimate the level of gene flow among populations of sesame in Ethiopia. A total of 120 (82 Ethiopian and 38 exotic) sesame accessions and six ISSR primers were used. DNA was extracted using a triple CTAB extraction method from silica gel dried bulked sample of five randomly selected individual plants per accession at the stage of three to four weeks after planting. The presence of higher polymorphism was revealed among accessions collected from Ethiopia (75.85) than the exotic accessions (65.52). The average gene diversity relative to the overall population was 0.24. Samples from Welega was the most diverse, with gene diversity value of 0.26 followed by samples from Tigray (0.20) and Shewa (0.20). Samples from Gojam (0.10) and Sudan (0.12) were the least diverse. Inter-population genetic distance (D) ranged from 0.031 to 0.165 for the overall population. From the exotic accession, samples of South East Asia are distantly related to most of the Ethiopian accessions. Unweighted pair group method with arithmetic mean analysis (UPGMA) of Ethiopian sesame populations revealed two major groups and three outliers (Cultivated, Welega and Illubabore).
Key words: Bulk sampling, gene flow, genetic differentiation, genetic distance, inter simple sequence repeat (ISSR), genetic diversity and sesame landrace accessions.
INTRODUCTION
The cultivated sesame, Sesamum indicum L., belongs to the family Pedaliaceae. Even though the origin of sesame is still in debate, Mehra (1967) and Mahajan (2007) stated that Ethiopian region is accepted as the origin of cultivated sesame. In addition, Bedigian (1981) argues that, owing to the wide genetic diversity in Africa, it is reasonable to assume that this subcontinent is the primary center of origin and India would then be thought of as a secondary center for sesame. It is perhaps one of the oldest crops cultivated by man, having been grown in the Near East and Africa for over 5,000 years for cooking and medicinal needs. Generally, 65% of world sesame production is used for edible oil extraction and 35% for confectionary purpose. The fatty acid composition is rather attractive, due to the high level of unsaturated fatty acids.
Sesame is grown in more than 60 countries in the world. According to FAO (2011) Ethiopia is ranked 6th in sesame production with 327,741 tons (10%) of production per year. Sesame seed is by far the leading crop in the countries oil seeds export where by more than 90% of the production is directed to export followed by Niger seed CSA (2010). The Ethiopian whitish Humera type is known for its taste (sweet) in the world market hence it is exported to the confectionary market where white seeded types are demanded by the consumers (Wijnands et al., 2009).
The main objective of sesame groups in National Agricultural Research Systems of Ethiopia is to develop cultivars concentrating on achieving a variety that combines disease resistance, white seeded and high yielding characters and works towards increased market values. The research in the country is geared towards evaluation of new collected accessions and exotic materials to develop a sesame variety with desirable characteristics with a combination of trait of interest including considerable oil content which are important for the export market (Tadele, 2005).
To strengthen the research program and broaden the genetic bases in sesame breeding, Ethiopian Institute of Agricultural Research has assembled 221 germplasm collections during 2002-2004 from different sesame growing regions in Ethiopia and preserved at Werer Agricultural Research Center. This makes the total sesame accessions preserved in Ethiopia to around 870 when it adds up with the IBC collection. However genetic variability studies, using any marker system, have not yet been conducted for the IBC collection. To meet the objectives of the national sesame improvement, information on genetic diversity and their relationship within and among collected accessions is inevitable.
Genetic markers are widely used by breeders and conservationists to study genetic diversity. A number of markers exist that can be used as tool to discern genetic variability within among populations. Each marker system has its own advantages and disadvantages in terms of ease of use and/or the degree of information provided. One of the genetic marker, molecular markers, are identifiable DNA sequence, found at specific locations of the genome, and transmitted from one generation to the next. The presence of various types of molecular markers, and differences in their principles, methodologies, and applications require careful consideration in choosing one or more of such methods. No molecular markers are said to be ideal and fulfill all requirements needed by researchers. Thus, one can choose among the variety of molecular techniques, according to the kind of study to be undertaken. To be called a suitable molecular marker it should be highly polymorphic, co-dominant inheritance, frequent occurrence and even distribution throughout the genome, selectively neutral behavior, easy access, easy and fast assay, low cost and high throughput, high reproducibility, and transferability between laboratories, populations and/or species (Weising et al., 2005).
Inter-simple sequence repeat (ISSR) is amplification of DNA segments present at an amplifiable distance in between two identical microsatellite repeat regions oriented in opposite direction (Zietkiewicz et al., 1994). ISSR marker, in addition to its suitability to genetic diversity study, is highly polymorphic, reproducible, cost effective, requires no prior information of the sequence (Bornet et al., 2002). These facts suggest that ISSR could be an unbiased tool to evaluate the changes of diversity in agronomically important crops (Brantestam et al., 2004).
ISSR markers are now being applied for cultivar identification, assessment of genetic diversity in various plant species and in determining genetic diversity and phylogenetic relationships within and among cultivated crops (Hou et al., 2005; Joshi et al., 2000). In agronomically important crops such as sesame this marker is used to study the patterns and level of diversity. Hence, the ISSR marker assay has been chosen to study the level of diversity and patterns of distribution of sesame genetic resources in Ethiopia.
MATERIALS AND METHODS
Experiment material and DNA extraction
Sesame germplasm sample consisting of 120 accessions (82 Ethiopian and 38 exotic) were drawn from the over 636 accessions currently maintained at the gene bank at the institute of Biodiversity Conservation, Addis Ababa, Ethiopia (Table 1 and Figure 1). The sampling procedure was set in such a way that accessions from the major sesame growing regions were sufficiently represented in the sample. Germplasm passport data were used to make sure that the major regions are represented. Additional sesame samples from Africa and other parts of the world were included for comparative analysis. The samples were laid out in augmented randomized block design in Werer Agricultural Research Center, Ethiopia on station field plots. The accessions were grown in 2 row plots of 4 m length.


Young leaves (3-5 in number) were collected separately from 5 randomly selected individual plants per accession three to four weeks after planting and dried in silica gel. Approximately equal amounts of the dried leaf samples were bulked for each accession and ground with sterile pestle and mortar with addition of liquid nitrogen. Total genomic DNA were isolated from about 0.2 g of the pulverized leaf sample using modified triple Cetyl Trimethyl Ammonium Bromide (CTAB) extraction technique as describe by Borsch et al. (2003). The isolated DNA samples were visualized using 1% ethidium bromide stained agarose gel under UV light. Based on a test gel result of DNA quantity (band intensity) and quality (absence or presence of minimum smear) the second extraction of most and the first extraction of some samples were selected for further PCR amplification. The selected genomic DNA samples were diluted with sterile distilled water in 1:5 ratios.
ISSR analysis
The ISSR marker assay was conducted at Genetics Research Laboratory of the Microbial, Cellular and Molecular Biology Program Unit, Faculty of Life Sciences, Addis Ababa University, Addis Ababa. A set of primer kit was obtained from the University of British Colombia (primer kit UBC 900). Based on published work of Kim et al. (2002) and lab experience, a total of 12 primers were used for the initial testing of primers variability and reproducibility. A total of eight sesame DNA samples from geographically distant localities were selected to screen primers and optimize the reaction conditions. Finally, a total of six polymorphic and reproducible ISSR primers were selected for the final analysis (Table 2).

The polymerase chain reaction was conducted in Biometra 2000 T3 Thermo cycler. PCR amplification was carried out in a 25 µl reaction mixture containing 1 µl template DNA, 14.0 µl H20, 5.0 µl dNTP (1.25 mM), 2.5 µl Taq buffer (10xThermopol reaction buffer), 2.0 µl MgCl2 (2 mM), 0.3 µl primer (20 pmol/ml) and 0.2 µl Taq Polymerase (5 u/ml). The amplification program was set as 4 min preheating and initial denaturation at 94°C, followed by 40 cycles of 15 sat 94°C, 1 min primer annealing at (45°C/48°C) based on primers used, 1 min and 30 sextension at 72°C and the final extension for 7 min at 72°C. The PCR products were stored at 4°C until loading on gel for electrophoresis. The lid temperature was held at 105°C. The PCR products were stored at 4°C until loaded on gel for electrophoresis. The amplification products were differentiated by electrophoresis using an agarose gel (1.67% agarose with 100 ml 1xTBE) and 8 µl amplification product of each sample with 2 µl loading dye (6 times concentrated) was loaded on gel. DNA marker 1 k bp (molecular ladder) was used to estimate molecular weight and size of the fragments. Electrophoreses was done for 2 h at constant voltage of 100 V. The DNA was stained for 30 min with (10 mg/ml) ethidum bromide (EtBr) which was mixed with 450 ml distilled water and distained for 30 minuwith 450 ml of distilled water.
Statistical analysis
Clearly resolved, unambiguous bands were scored visually for their presence or absence for each primer and sample. ISSR profiles/bands were scored manually for each individual accession from the gel photograph. The bands were recorded as discrete characters, presence ‘1’ or absence ‘0’ and ‘?’ for missing data. To analyse the scored ‘1’ ‘0’ fragment data assembled in data matrix. The total number of bands, distribution of bands across accessions, number of polymorphic bands in a set of accessions, and average number of bands per primer were calculated. Similarity matrix was generated based on the simple-matching coefficient (Jaccard’s), using the presence/absence data for individual ISSR fragment.
Based on recorded bands different software’s were used for analysis. POPGENE version1.32 software (Yeh et al., 1999) was used to calculate genetic diversity for each population as number of polymorphic loci and percent polymorphism, Shanon index, coefficient of gene differentiation (GST) (Nei, 1973), Nei’s standard genetic distance (GD) (Nei, 1972) and gene flow estimates (McDermott and McDonald, 1993). Analysis of molecular variance (AMOVA) was used to calculate variation among and within population using Areliquin version 3.01 (Excoffier et al., 2006). NTSYS- pc version 2.02 (Rohlf, 2004) and Free Tree 0.9.1.50 (Pavlicek et al., 1999) software’s were used to calculate Jaccard’s similarity coefficient which is calculated with the formula:

Where, 'a ' is the total number of bands shared between individuals i and j, 'b' is the total number of bands present in individual i but not in individual j and 'c' is the total number of bands present in individual j but not in individual i.
The unweight pair group method with arithmetic mean (UPGMA) (Sneath and Sokal, 1973) was used to analyze and compare the population and generates phenogram using NTSYS- pc version 2.02 (Rohlf, 2004). The Neighbor Joining (NJ) method (Saitou and Nei1987; Studier and Keppler, 1988) was used to compare individual genotypes and evaluate patterns of genotype clustering using Free Tree 0.9.1.50 Software (Pavlicek et al., 1999).
RESULTS
Banding patterns of the ISSR primers used
Out of the 12 primers tested initially, six primers (five di-nucleotide and one penta-nucleotide) that gave relatively clear banding pattern were selected and used in this study (Table 2). The molecular weight of the bands amplified using the primers were in the range of 450 to 4000 bp. A total of 58 clear bands were scored, from 82 and 38 exotic sesame accessions. Out of the total 58 ISSR fragments, 44 were found to be polymorphic. The least polymorphic bands (four) were scored from primer 834_H and the remaining five primers all showed equal polymorphic bands (eight). The average number of bands and polymorphic bands per primer were 9.67 and 7.33, respectively.
.png)
Polymorphism based on ISSR analysis
In all populations or individuals the number of polymorphic loci ranges from four for primer-834 to eight for all other primer. Of the total 58 loci scored, 44 (75.86%) were observed to be polymorphic. From all the populations (considering Ethiopian accessions and exotic accessions as independent population) studied Welega (58.62%), Tigray (50.00%) and Gonder (44.83%) were found to have higher percent polymorphism. Gojam (25.86%) and Sudan (27.95%) on the other hand showed the least percent polymorphism.
Ethiopian accessions (considering as a single large population) when com-pared to exotic accessions they showed high percent polymorphism 75.85 and 65.52%, respectively (Table 3). Among the exotic accessions (considering samples from different country as independent population) accessions from Sudan (27.95%) were the least polymorphic and the South East Asian ones (43.1%) showed high present polymorphism. No unique bands were observed for either the accessions or the populations.

As to the primers used, none of the primers showed 100 per cent polymorphism. Primer 810, 818 and 860 showed the highest percent polymorphism (88.89%) and the least polymorphic band was scored by primer 834 which is 40.00 % and this primer also showed higher standard deviation for the genetic diversity and Shannon index which goes with its least polymorphism. The rest primers namely, 844 and 880 showed 80.00 and 72.73 percent polymorphism, respectively (Table 4).

Genetic diversity
Grouping Ethiopian accessions into administrative region based population and exotic accessions in to country based population showed that samples from Welega were the most diverse (0.26) followed by samples from Tigray (0.20) and Shewa (0.20). Samples from Gojam (0.10) and Sudan (0.12) were the least diverse. The average gene diversity relative to the overall population was 0.24, considering accession from different administrative region of Ethiopia and exotic countries as independent population. The overall diversity index values for the total population and the Ethiopian sesame accessions were found to be 0.37 (Table 3). The extent of gene differentiation relative to the total Ethiopian population was (GST) 0.25 and the extent of gene flow (Nm) among populations of Ethiopian sesame accessions (considering administrative region as independent population) was 1.49. For the exotic accessions the extent of gene differentiation was 0.29 and the extent of gene flow was 1.19 (Table 3).
Analysis of molecular variance
Analysis of molecular variance was carried out on the overall ISSR data score of sesame accession without and with grouping (Tables 5 and 6). AMOVA without grouping revealed that higher percentage of variation (94.09%) is attributed to the within population variation while the remaining variation is due to the among population variation (5.90%). The grouping AMOVA analysis, considering the Ethiopian accessions as one group and the exotic ones as another, also showed 5.88% among populations within group variation, 94.09% within group variation and 0.026% among group variation (Table 6). The variations was found to be highly significant at P=0.00, 1000 permutations.


Genetic distance
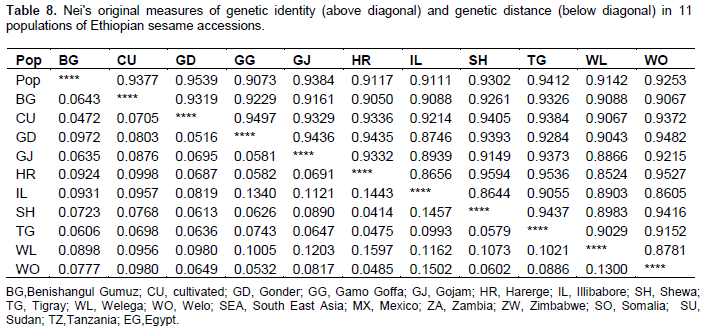
Inter-population genetic distance (D) ranged from 0.031 to 0.165 for the total 19 population (Table 7). Administrative region based population classification of the Ethiopian sesame accessions revealed inter population genetic distance ranging from 0.041 to 0.16. Samples from Illubabore were distantly related to samples of Wello (0.150), Shewa (0.116) Harerge (0.144) and Gamo Goffa (0.134) (Table 8). Among the pairwise population comparisons made within Ethiopian population, samples from Welega and Harerge showed the highest genetic distance (0.160) and samples from Shewa and Harerge showed the least genetic distance (0.041). In general from the exotic accessions samples of South East Asia is distantly related to most of the Ethiopian accession. Genetic distance between the other pairwise combinations of populations was very low with the least genetic distance between samples of Mexico and Tanzania (0.031).

Clustering analysis
Cluster analysis of Ethiopian sesame populations revealed two major groups and three outliers (Cultivated, Welega and Illubabore). The first major cluster again forked into two sub groups the first containing Tigray, Harerge and Shewa populations, while the second contained Gamo Goffa, and Wello populations which are characterized as the lowest sesame producers of the country.
More over the migration of the welo people to the south may have its own impact on the clustering of Gamo Goffa and Welo (Baker, 2001). Seeds of some sesame germplasm might have been transported from Welo to Gamo Gofa along with human (Figure 2). The second major cluster comprise of Gojam, Benishangul Gumuz and Gonder populations which embodies the north western parts of the country.
.png)
DISCUSSION
Genetic diversity and application of ISSR marker
Understanding of the extent and pattern of genetic variation can be useful for several purposes. Such information can be used to design effective germplasm conservation and for setting germplasm collection mission as well as to estimate or predict the risk of genetic erosion in certain area.
From breeding point of view, knowledge of pattern of genetic variability is useful for defining heterotic patterns in hybrid breeding and for relating the observed pattern with presence of certain economically important traits. Pattern of genetic variability can be studied by morphological, isozyme or molecular markers. Among the markers ISSR markers are important to study genetic variations in plant species, as they are effective in detecting very low levels of genetic variation (Zietkiewicz et al., 1994).
Generally, ISSR primers have high resolution power in diversity analysis of different crops. This marker were observed to be very useful in detecting genetic diversity and population structure of Tef (Assefa, 2003), Coffee (Aga, 2005; Tesfaye, 2006), Lentils (Edosa et al., 2007), and rice (Gezahegne et al., 2007) collected from different parts of Ethiopia.
In addition to the advantages (inexpensive, easy to generate), ISSRs are powerful in detecting polymorphisms with high reproducibility. ISSR can detect even more polymorphism than RFLPs in maize (Kantety et al., 1995) and more than AFLPs in rice (Blair et al., 1999).
In this study the extent and pattern of genetic variability among 82 Ethiopian and 38 exotic samples of sesame accessions were estimated using 5 di-nucleotide and one penta-nucleotide ISSR primer markers. The large number of accessions held in this study dictates the approach that can be employed. A quick, simple but reliable molecular protocol must be combined with an appropriate strategy for handling large sample sizes (Edosa et al., 2007; Edosa et al., 2010; Edosa et al., 2011 Gilbert et al., 1999). In this study, bulk sampling approach was chosen because it permits representation of the vast accession by optimum number of plants. Yang and Quiros (1993) reported that bulked samples with 10, 20, 30, 40 and 50 individuals had resulted in the same RAPD profiles as that of the individual plant constituting the bulk sample. Edosa et al. (2007) used bulked samples for diversity assessment in lentil collected from Ethiopia. The technique revealed higher genetic diversity, and, therefore, validated the usefulness of bulk sample analyses.
This result also confirms that bulked leaf samples and ISSR marker is efficient in detecting polymorphism within and among populations and accessions of sesame. The present study suggested the existence of moderate level of diversity (0.23) among sesame accessions collected from Ethiopian Institute of Biodiversity Conservation.
Thus, ISSR marker systems will provide a useful tool in the future design of collection strategies for conservation and use of sesame accessions in Ethiopia. The ISSR technique was previously performed in sesame to study the genetic relationship of sesame germplasm in Korea by Kim et al. (2002). He used 14 reliable ISSR primers and found 33% polymorphism from 79 amplification products among the 75 sesame accessions. This is low when it is compared with this results percent polymorphism (75.86%). RAPD marker was also used by Abdellatef et al. (2008) in a set of 10 sesame germplasm collected from different regions of Sudan.
A total of 64 polymorphisms (6.4 polymorphic markers per primer) out of 75 reproducible products (7.5 fragments per primer) were obtained from the 10 primers used and low level of genetic similarity among accessions (Abdellatef et al., 2008). Seleshi (2008) studied the genetic divergence of 100 sesame accessions using 13 agro-morphological traits from EIAR collection and found wide variability for all the measured characters which agrees with this result.
The success of a crop-improvement program largely depends on the availability and knowledge of the genetic resources in a germplasm collection. In the present study all the diversity parameters confirmed that there is higher gene diversity in Ethiopian accessions than exotic accessions. Since areas of high genetic diversity contribute more accessions than those with a low diversity for further and future collection, breeding and conservation activities high priority should be given to areas with high genetic diversity. The result of this study exhibited among the ten Ethiopian areas moderate to higher genetic diversity is revealed by the accessions from the Welega, Tigray and Shewa areas. Hence, for selection based population improvement these areas have a high potential as compared to areas with lower genetic diversity like Gojam and Harerge.
Genetic distance and implication for improvement
Genetic distance is a measure of the allelic substitutions per locus that have occurred during the separate evolution of two populations or species. In this study, inter-population genetic distance for the whole population (D) ranged from 0.031 to 0.165. From the Ethiopian populations comparatively samples from Ilubabore, Harergea, Gamo Goffa, Gojam and Wello showed moderate to high genetic distance related to their respective pair wise comparison. Samples from Benishangul Gimuz, Gonder and Tigray relatively found to be more related with each other and with other pair wise comparison showing low to very low genetic distance. Since the bulk of Ethiopian sesame production is coming from the later places this close similarity can be explained by exchange of the sesame seed among neighboring localities in the north and northwest. Although the distance between exotic accessions and local accessions varied from population to population on the average, the local accessions were separated from the exotic ones by considerable amount the south eastern Asian accessions being the most distant.
Genetic structure, patterns of distribution and implication for conservation
The genetic structure of plant populations reflects the interactions of various factors, including the long-term evolutionary history of the species (shifts in distribution, habitat fragmentation, and population isolation), genetic drift, mating system, gene flow and selection (Schaal et al., 1998). In the present study there was moderate level of genetic differentiation (GST = 0.25) among the Ethiopian sesame accessions.
Analysis of molecular variance (AMOVA) using 32 AFLP marker for sesame accessions originate from five different geographical regions representing the proposed diversity centers for sesame: India, Africa, China-Korea-Japan, Central Asia and Western Asia indicates that 5% of the variance among the patterns was due to differences among groups and 95% was due to differences within groups (Laurentin and Karlovsky 2006).
In another study, Endale et al. (2008), using SSR marker, also found 41.2% of the total genetic variation between population and 58.8 % within population for 50 sesame landraces of Ethiopia. Similarly, the result of this study is also in agreement with the above AFLP and SSR analysis.
In this study, the AMOVA analysis showed highly significant (P=0.00) genetic differences among populations and within populations. Of the total variation, 5% attributed to among population and 95% attributed to within populations. Even though based on AMOVA analysis, a high estimate of genetic differentiation between populations of inbred species is expected this may not be a general truth if there is high gene flow represented by seed movement through human involvement (Edossa et al., 2007).
Moreover, pollen movement facilitated by insect could also have a role for the observed pattern. The lower among group variance of this study can be explained in line with the above argument. Gene flow is the exchange or movement of gametes, individuals, and populations on a geographic scale (Joseph and Bruce 1993). Gene flow, in conjunction with other evolutionary forces, can result in the spread of single genes (or DNA sequences), genotypes, and even the establishment of whole populations in different regions. The movement of one individual per generation between populations is sufficient to prevent substantial differentiation between those populations (Joseph and Bruce, 1993).
The values obtained from Nm, the product of the effective size of individual populations (N) and the rate of migration among them (m); show the approximate number of individuals migrating from one population to the other, in a typical island model. Generally, if Nm < 1 local differentiation of populations will result, and if Nm > 1 there will be little differentiation among populations (Wright, 1951). The overall Nm (1.28) value of this study is considered to be higher according to Slatkin (1981, 1985), Caccone (1985) and Waples (1987) grouping. They grouped Nm values into three categories: high (Nm > 1.000), intermediate, (0.250 - 0.990), and low (0.000 - 0.249). The fact that Nm value of this study is higher indicates gene flow between populations is obvious which will agree with the AMOVA result showing there is low variation among population.
The GST value of this result also shows the lack of population differentiation which goes with Laurentin and Karlovsky (2006) work. They found a GST value of 0.20 (below this study 0.25) and suggested the lack of association between geographical origin and population differentiation. In their finding particularly Indian, African and Chinese-Japanese-Korean accessions are distributed throughout clusters in UPGMA analysis and the whole two-dimensional space in PCA. Toan et al. (2011) also found an intermediate estimate of gene flow (Nm) value of 0.38 on average in there study. This lack of association between geographical distribution and classification based on molecular markers in sesame was explained by the exchange of sesame seeds among widely separated locations which could be due to movement/migration of peoples from one place to another along with their own seed or the purchase of seeds from other places for cultivation. These results also became apparent from the cluster analysis.
CONCLUSION
This study shows that bulk sampling strategy for DNA analysis and ISSR marker are important for genetic diversity study in sesame. The study also shows, among the sesame accessions held by IBC, in comparison, Ethiopian accessions are more diverse than the exotic ones. Separate analysis of the Ethiopian accession revealed there are places with higher genetic diversity which will be valuable for the future collection, conservation and improvement strategies. Regions that showed relatively high level of genetic diversity should be the main focus for future collection and population improvement based on selection. The present study also showed weak association between genetic variation of sesame accessions and their ecological regions of origin. The most likely important factor affecting the genetic structure of sesame in this region is possibly human activities. This show there could be a possibility of sampling plants with the same genetic constitution from different administrative regions. This problem becomes sever if an administrative region is represented by small sample as in the case of IBC.
CONFLICT OF INTEREST
The authors have not declared any conflict of interest.
ACKNOWLEDGEMENTS
Dagmawi T. Woldesenbet is thankful to Rural Capacity Building Project (RCBP) and the Private Public Partnership for sesame for funding the research; Institute of Biodiversity Conservation (Addis Ababa, Ethiopia) for kindly providing seeds and passport data of the landrace accessions; Werer Agricultural Research Center (Werer, Ethiopia) for provision of physical resources and other facilities; the Faculty of Life Sciences of Addis Ababa University for giving me the chance for this study. I am thankful to all the authors for their valuable assistance.
REFERENCES
|
Abdellatef E, Sirelkhatem R, Mohamed A, Radwan KH, Khalafalla MM (2008). Study of genetic diversity in Sudanese sesame (Sesamum indicum L.) germplasm using random amplified polymorphic DNA (RAPD) markers. Afr J. Biotechnol. 7(24):4423-4427. |
||||
| Aga E (2005). Molecular genetic diversity study of forest coffee tree (Coffea arabica L.) populations in Ethiopia: Implications for conservation and breeding. Doctoral Thesis, Faculty of Landscape Planning, Horticulture and Agricultural Science, Swedish University of Agricultural Sciences (SLU). | ||||
|
Ali GM, Yasumoto S, Seki-Katsuta M (2007). Assessment of genetic diversity in sesame (Sesamum indicum L.) detected by amplified fragment length polymorphism markers. Elect. J. Biotechnol. 10:1. Crossref |
||||
| Ashri A (1998). Sesame breeding. Plant Breed. Rev. 16:179-228. | ||||
| Assefa K (2003). Phenotypic and molecular diversity in the Ethiopian cereal, Tef [Eragrostis tef (Zucc.) Trotter]. Doctoral Dissertation, Department of Crop Science, SLU. Acta Universitatis Agriculturae Sueciae. Agraria. p. 426. | ||||
| Baker J (2001). Migration as a positive response to opportunity and context: the case of Welo, Ethiopia. In: Mobile Africa: changing patterns of movement in Africa and beyond. (Mirjam de, B., Rijk van, D., Foeken, D. ed.) | ||||
| Barrett BA, Kidwell KK (1998). AFLP based genetic diversity assessment among wheat cultivars from the pacific northwest. Crop Sci. 38:1261-1271. | ||||
| Bedigian D (1981). Origin, diversity, exploration and collection of sesame. In: Sesame: Status and Improvement, Proc. Expert Consultation, Rome, Italy, 8-12 December, 1980. FAO, Rome, Italy. pp. 164-169. | ||||
|
Bedigian D (2004). History and lore of sesame in Southwest Asia. Econ. Bot. 58:329-353. Crossref |
||||
|
Blair MW, Panaud O, McCouch SR (1999). Inter-simple sequence repeat(ISSR) amplification for analysis of microsatellite motif frequency and fingerprinting in rice (Oryza sativa L.). Theor. Appl. Genet. 98:780-792. Crossref |
||||
|
Bornet BC, Muller FP, Branchard M (2002). Highly informative nature of inter simple sequence repeat (ISSR) sequences amplified using triand tetra-nucleotide primers from DNA of cauliflower (Brassica oleracea var. 'botrytus' L.). Genome, 45:890-896. Crossref |
||||
|
Borsch T, Hilu KW, Quandt D, Wilde V, Neinhuis C, Barthlott W (2003). Noncoding plastid trnT-trnF sequences reveal a well resolved phylogeny of basal angiosperms. J. Evol. Biol. 16:558-576. Crossref |
||||
|
Brantestam AK, Bothmer RV, Dayteg C, Rashal I, Tuvesson S, Weibull J (2004). Inter simple sequence repeat analysis of genetic diversity and relationships in cultivated barley of Nordic and Baltic origin. Hereditas, 141(2):186-187. Crossref |
||||
|
Caccone A (1985). Gene flow in cave arthropods: A qualitative and quantitative approach. Evol. 39:1223-1235. Crossref |
||||
| CSA (Central Statistic Authority) (2010). Ethiopian agricultural sample enumeration: Report on the primary results of area, production and yield of temporary crops of private peasant holdings in Meher Season, Addis Ababa, Ethiopia. | ||||
|
Edossa F, Kassahun T, Endashaw B (2007). Genetic diversity and population structure of Ethiopian lentil (Lens culinaris Medikus) landraces as revealed by ISSR marker. Afr. J. Biol. 6(12):1460-1468. |
||||
|
Edossa F, Kassahun T, Endashaw B (2010). A comparative study of morphological and molecular diversity in Ethiopian lentil landraces. Afr. J. Plant Sci. 4(7):241-254. |
||||
| Endale D, Parzies Heiko K (2010). Genetic variability among landraces of sesame in ethiopia . Afr. Crop Sci. J. 19(1):1-13. | ||||
| Excoffier L, Laval G, Schneider S (2006). Arlequin Version.3.01: An integrated software package for population genetics data analysis. Evol. Bioinform. Online 1:47-50. | ||||
|
FAO (2011). Food and Agricultural Organization. Rome, Italy. Crossref |
||||
| Gezahegn G (2007). Relationship between wild rice species of Ethiopian rice with cultivated rice based on ISSR marker. MSc Thesis Addis Ababa University. | ||||
|
Gilbert JE, Lewis RV, Wilkinson MJ, Kaligari PDS (1999). Developing an appropriate strategy to assess genetic variability in plant germplasm collections. Theor. Appl. Genet. 98:1125-1131. Crossref |
||||
|
Godwin ID, Aitken AB, Smith LW (1997). Application of inter simple sequence repeat (ISSR) markers to plant genetics. Electrophor. 18:1524-1528. Crossref |
||||
| Hou YC, Yan ZH, Wei YM, Zheng YL (2005). Genetic diversity in barley from west China based on RAPD and ISSR analysis. Barley Genet. Newslett. 35:9-12. | ||||
|
Joseph MM, Bruce AM (1993). Gene flow in plant pathosystems. Ann. Rev. Phytopatol. 31:353-373. Crossref |
||||
|
Joshi SP, Gupta VS, Aggarwal RK, Ranjekar PK, Brar DS (2000). Genetic diversity and phylogenetic relationship as revealed by inter simple sequence repeat (ISSR) polymorphism in the genus Oryza. Theor. Appl. Genet. 100:1311-1320. Crossref |
||||
|
Kantety RV, Zeng X, Bennetzen JL, Brent EZ (1995). Assessment of genetic diversity in dent and popcorn (Zea mays L.) inbred lines using inter-simple sequence repeat (ISSR) amplification. Mol. Breed. 1:365-373. Crossref |
||||
|
Kim DH, Zur G, Danin-Poleg Y, Lee SW, Shim KB, Kang CW, Kashi Y (2002). Genetic relationships of sesame germplasm collection as revealed by inter-simple sequence repeats. Plant Breed. 121:259-262. Crossref |
||||
|
Laurentin HE, Karlovsky P (2006). Genetic relationship and diversity in a sesame (Sesamum indicum L.) germplasm collection using amplified fragment length polymorphism (AFLP). BMC Genet. 7:10. Crossref |
||||
| Mahajan RK, Bisht IS, Dhillon BS (2007). Establishment of a core collection of world sesame(Sesamum indicum l.) germplasm accessions. SABRAO J. Breed. Genet. 39(1):53-64. | ||||
| Mehra KL (1967). Sesame in India. In: Oilseed Crops, Tropical Agriculture Series, (Weiss, E.A., ed.). Longman, London. pp. 282-340. | ||||
| Pavlicek A, Hrda S, Flegr J (1999). Free tree free ware program for construction of phylogenetic trees on the basis of distance data and bootstrap/Jack Knife analysis of the tree robustness. Application in the RAPD analysis of genus Frenkelia. Folia Biol. 45:97-99. | ||||
| Rohlf FJ (2004). NTSYS-pc ver 2.11T. Exter Software, Setauket, New York. | ||||
|
Saitou N, Nei M (1987). The neighbor-joining method: A new method for reconstructing phylogenetic trees. Mol. Biol. Evol. 4:406-425. Pubmed |
||||
| Seleshi A (2008). Genetic divergence and correlation study in sesame (Sesamim indicum L.) genotypes. MSc Thesis. Addis Ababa University. | ||||
| Slatkin M (1981). Estimating levels of gene flow in natural populations. Genet. 99:323-335. | ||||
|
Slatkin M (1985). Rare alleles as indicators of gene flow. Evol. 39:53-65. |
||||
| Sneath PHA, Sokal RR (1973). Numerical Taxonomy. Freeman, Sanfrancisco | ||||
|
Studier JA, Keppler KL (1988). A note on the neighbor-joining algorithm of Saitou and Nei. Mol. Biol. Evol. 5:729-731. |
||||
| Tadele A (2005). Sesame (Sesamum indicum L.) Research in Ethiopia: a Review of Past Work and Potential and Future Prospects. In: Sesame and Safflower Newsletter.(José Fernández Martínez, IAS, Córdoba, Spain. EcoPort version by Peter Griffee, FAO). | ||||
| Tesfaye K (2006). Genetic diversity of wild Coffea arabica populations in Ethiopia as a contribution to conservation and use planning. Ecology and development series no. 44. Doctoral Thesis. University of Bonn, Germany. | ||||
|
Toan DP, Mulatu G, Tri MB, Tuyen CB, Arnulf M, Anders S (2011). Comparative analysis of genetic diversity of Sesame (Sesamum indicum L.) from Vietnam and Cambodia using agro-morphological and molecular markers. Hereditas 148(1):28-35. Crossref |
||||
|
Waples RS (1987) A multispecies approach to the analysis of gene flow in marine shore fishes. Evol. 41:385-400. Crossref |
||||
|
Weising K, Nybom H, Wolff K, Kahl G (2005). DNA Fingerprinting in Plants: Principles, Methods and Applications. Taylor and Francis Group, USA. 444pp. Crossref |
||||
| Weiss EA (1983). Oilseed Crops, Tropical Agriculture Series. Longman, London. pp. 282-340. | ||||
| Wijnands JHM, Biersteker J, Van Loo EN (2009). Oilseeds business opportunities in Ethiopia 2009. Public private partnership in oil seed. | ||||
|
Wright S (1951). The genetical structure of populations. Ann. Eugenet. 15:323-354. Crossref |
||||
| Yang RC, Boyle TJB, Ye Z, Mao JX (1999). POPGENE, the user friendly shareware for population geneticss analysis, version 1.31, Molecular Biology and Biotechnology Centre, University of Aleberta, Canada. | ||||
| Yeh FC, Yang RC, Boyle TJB, Ye Z, Mao JX (1999). POPGENE, the user friendly shareware for population geneticss analysis, version 1.31, Molecular Biology and Biotechnology Centre, University of Aleberta, Canada. | ||||
|
Zietkiewicz E, Rafalski A, Labuda D (1994). Genome fingerprinting by simple sequence repeat(SSR)- Anchored polymerase chain reaction amplification. Genomics 20:176-183. Crossref |
||||
Copyright © 2024 Author(s) retain the copyright of this article.
This article is published under the terms of the Creative Commons Attribution License 4.0


