Full Length Research Paper
ABSTRACT
The current and anticipated demographic changes worldwide are expected to increase fish and other animal protein consumption. Capture fisheries alone cannot meet these requirements. Aquaculture offers a way out if it can further be developed. However, in most developing countries, aquaculture is still in its infancy and the evidence on the industry is quite thin. We assess the profitability of small-scale aquaculture production in Zambia using primary data collected through a structured questionnaire that was supplemented with focus group discussions with individual fish farmers. The analysis combined descriptive statistics, enterprise budgets, and financial analysis tools. The profitability of the aquaculture venture was determined using the indicators of investment returns including, net present value (NPV), internal rate of return (IRR) and benefit-cost ratio (BCR). The results from the profitability analysis show positive net revenue, NPV and IRR. The Benefit-Cost Ratio is also greater than one, implying that investment in aquaculture production is a profitable and viable business venture for small-scale farmers. The results reveal that over the useful life of the ponds, which is assumed to be 10 years, the estimated NPV is 17,524.13 ZMW and the IRR is 42.38%, measured at the discount rate of 15%. The positive NPV implies that the aquaculture enterprise is feasible and profitable.
Key words: Aquaculture, profitability, Zambia
INTRODUCTION
Rapid urbanization, a growing population coupled with sustained income growth has led to changes in the consumption patterns in most developing countries (Chisanga and Zulu-Mbata, 2018). The budget shares of starchy staples have declined, while that of animal protein is on the rise. FAO (2014) estimated that the global population intake of animal protein is at 17%, and in some countries, it exceeds this and is expected to increase further by 50% (Ncube et al., 2016). Focusing on fish, which is a frequently consumed protein source (Thirsted et al., 2014), it is noted that the trends could contribute to increased agricultural income growth. Aquaculture offers promise for increased fish production in view of the challenges around capture fisheries (that is, dwindling stocks) (FAO, 2006, 2010, 2014). Yet, most aquaculture industries in the developing world remain in their infancy and Zambia is no different.
Fish supply in Zambia is largely dependent on capture fishery, which contributes nearly 70% of the country’s total production. However, fish catches have been declining in all the water bodies in the country and yet demand for fish has been increasing due to increased human population. Further, in Zambia, fish and fish products account for more than 20% of animal protein intake and provide essential micronutrients to the majority of the population (Musumali et al., 2009). It is also estimated that the fisheries sector contribute about 0.4% to the GDP (CSO, 2010). This relatively small contribution at the macro level often masks the significant contributions of fish production in the rural economy and the nutrition security of the Zambian population. The sector provides income for 1,000,000 people who earn their income directly as fishers or fish farmers or indirectly as traders, processors and other service providers along the value chain (Musumali et al., 2009).
In the last five years, aquaculture has once again taken centre stage in the country’s development agenda and is recognized as a means to promote youth employment, improve rural smallholder household income and food security, and reduce the high levels of malnutrition in Zambia. This is evidenced by the tremendous positive trajectory of aquaculture production from 12,988 Mt in 2012 to 32,888 Mt in 2017 (DOF, 2018). To a large extent, promotion of aquaculture has yielded positive results such that Zambia is now ranked the sixth largest producer of farmed fish in Africa (Genschick et al., 2017). However, the current fish consumption per capita in Zambia is still low compared to the global consumption (10.3 kg per capita compared to 19.2 kg per capita). At the current consumption and production levels, there is a deficit of 35,000 Mt, which is often met through the importation of fish from various countries. Zambia’s fish imports have since increased from 25 to 35% over the years (DOF, 2017). While the policies have successfully promoted large-scale investments which now contributes nearly 80% of the country’s total aquaculture fish supply, small-scale sector production remains low (Kaminski et al., 2017). It is estimated that the small-scale farmers engaged in fish farming in Zambia contribute only 11% to total farmed fish supply (DOF, 2017).
Figure 1 shows the annual fish production from aquaculture and capture; though the trend shows an increase in the quantity produced, aquaculture production in Zambia is still in its infancy stage, hence the need for increased efforts in fish farming. Further, the Department of Fisheries (DOF) attributes the increase in aquaculture production to a rise in the number of small- to medium-scale fish farmers (ponds and cage fish farmers) (DOF, 2018).

The growth of the small-scale aquaculture sector is however affected by several challenges and remains largely supported by national and international development programmes (Genschick et al., 2018). Further, despite the well-known benefits of fish farming, there are no empirical studies that have been conducted in Zambia to evaluate the profitability of aquaculture production, especially for the small-scale fish farmers. An understanding of the returns to investment could contribute towards increased fish production from aquaculture and incomes for producers.
The overall objective of the study was to assess the profitability of small-scale aquaculture production in Zambia. To achieve this objective, the study addressed the following research questions:
i) What is total investment cost in aquaculture production at a small-scale level?
ii) What is the profitability of small-scale aquaculture investment in Zambia?
iii) What are some of the constraints faced by aquaculture fish farmer?
DATA AND METHODS
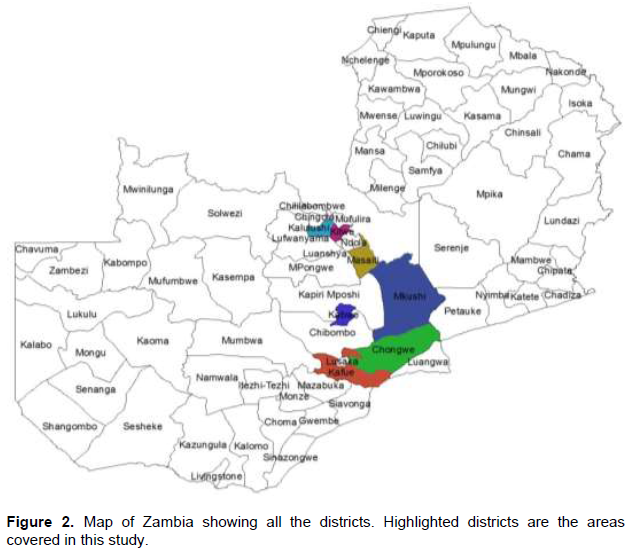
This study utilized both primary and secondary data sources. The primary data was collected using quantitative and qualitative data collection methods. A quantitative survey instrument was designed and administered to small-scale fish farmers in seven districts. The districts included Chongwe and Kafue from Lusaka province, Mkushi and Kabwe in Central province, Kitwe, Kalulushi and Masaiti in the Copperbelt province. These districts were purposively selected because of the relatively high number of farmers involved in aquaculture using fish ponds. Typically, this is in the urban hinterlands, cage aquaculture dominates elsewhere (DOF, 2017). The individual households sampled were randomly selected from the farmer’s registers in the various districts. A total of 100 households were selected and interviewed for this study. Further, for qualitative data, focus group discussions were conducted in these districts and each focus group discussion (FGDs) consisted of six participants, of which 58% were male. This was done in the respective local languages in the districts.
The information collected from the household survey included socio-economic characteristics of the farmers, type and sizes of ponds, production cycles, costs of constructing the ponds, the cost of feed and fingerlings, and other operational costs. This information helped to determine the initial cost of investing in aquaculture production at a small- scale level. In the qualitative interview, the questions sought to gain insights into local aquaculture production including constraints and success factors. Though our sample size is not statistically representative of all the small-scale fish farmers in Zambia, it does give an indication of the profitability of fish farming in Zambia among the small-scale farmers; and hence can be used to guide farmers and other individuals who would like to venture into fish farming business.
Figure 2 shows the map of Zambia in Southern Africa with all its districts. The highlighted districts are the areas where data for this study was collected for both qualitative and quantitative data. Secondary data on the other hand, was collected from the Department of Fisheries and other literatures cited.
NPV and IRR calculation
In the literature reviewed, the most commonly used methods in estimating the profitability of an investment include the net present value (NPV) and internal rate of return (IRR). IRR is also referred to as the discount rate that causes the net present value of future cash flows from the investment to equal zero. Correia da Silva et al. (2003) argued that IRR and NPV are conceptually the correct methods for measuring profitability. This is because they consider the cash inflows and outflows of a business activity. These measures apply discounting to the cash flows and incorporate the economic concept of the time value of money. Profitability was analyzed using Excel financial analysis tools. The profitability model is another approach to estimating NPV and IRR identified in the literature (Okechi, 2004; Salia and Jensson, 2008; Jensson, 2006). For this study, the Microsoft Excel approach was used to estimate NPV and IRR.
To determine the NPV and IRR of a small-scale aquaculture investment, the following assumptions were made for this study and these are adopted from various literature of similar analysis.
1) One homestead earthen pond to be constructed (500 m2)
2) Fish survival rate of 90% for a complete cycle
3) Harvest size of fish 200 g
4) Stocking rate 5 fish/m2
5) Production period 6 months (one cycle)
6) Price of fish K23/kg
7) Initial financing of investment
i) Commercial loan 70% of total investment cost
ii) Working capital 30% of the total investment cost
iii) Loan repayment period 4 years
iv) Bank interest rate 12.5%
8) Depreciation of the ponds estimated using the straight-line method.
9) Salvage value of the pond taken to be zero.
10) Expected lifespan of the homestead earthen ponds taken to be 10 years.
11) Cost of fingerlings used average price as reported by the farmers.
12) Cost of constructing the ponds used average price as reported by the farmer (Appendix).
13) Constant annual production and cash flow assumed an estimated period 10 years.
Given the above assumptions, the equations for estimating NPV and IRR below follows Correia da Silva et al. (2003).

Where
CFt = Cash flow in year t
i = Discounting factor
IRR is derived by extrapolating two net present values that have been calculated using two random discount rates (DR) as shown in the equation below.

In addition to estimating NPV and IRR, the study also estimated Benefit Cost Ratio (BCR), which measures the viability of a business venture. BCR is estimated as shown in Equation 3.

Further, when estimating the cash flows for an investment, there ar fixed costs associated with the long-term operation of the fish farming business such as depreciation of the ponds. In this study, depreciation was estimated using a straight-line method that involves allocation of an even rate of depreciation every year over the useful life of an asset. The formula for straight-line depreciation is given as:

Where asset cost represents the cost of constructing the pond, salvage value is the value of a fixed asset posts the useful life, and in this study, we assume the salvage value of the pond is zero. Useful life, on the other hand, is the period over which the fixed asset is considered to be productive and in this study, the expected useful life is 10 years.
Gross margin analysis
The study estimated the expected gross margins from the aquaculture business venture. Gross margin analysis has been used frequently in studies to determine the profitability of aquaculture production enterprise (Hyuha et al., 2011; Issa et al., 2014; Akegbejo-Samsons and Adeoye, 2012).
Using the primary data collected, enterprise budgets for each pond category based on the size were created. The enterprise budgets provide estimates of specific inputs and outflows associated with aquaculture production system. The estimated margins are based on an already established fish farming business. The estimated gross margins take the form;

RESULTS AND DISCUSSION
Social-economic characteristics of fish farmers
The results are presented in three parts. The first part highlights the descriptive characteristics of the farmers interviewed and the second part measures the profitability of aquaculture farming by addressing the first and second research questions. The third part, which is mostly from the qualitative data, indicates the major constraints faced by small-scale farmers in fish farming. These factors affect the profitability of fish farming among this group of farmers.
Individual characteristics
The individual characteristics evaluated include age, gender, and education level of the fish farmers. Results in Table 1 show that the average age and education level of the fish farmers is 53 years old and 12 years of formal education respectively and these results are similar in the three provinces. Similar findings were reported for the aquaculture baseline study that the average age of the fish farmers in Copperbelt and North-western Province was 52 years and the study also indicated that most of the fish farmers had attained senior secondary school education (Mwango et al., 2016). The implication of this finding is that the majority of the people engaged in fish farming are over the age of 40 years, and this to some extent, shows the limited participation of youths in fish farming.
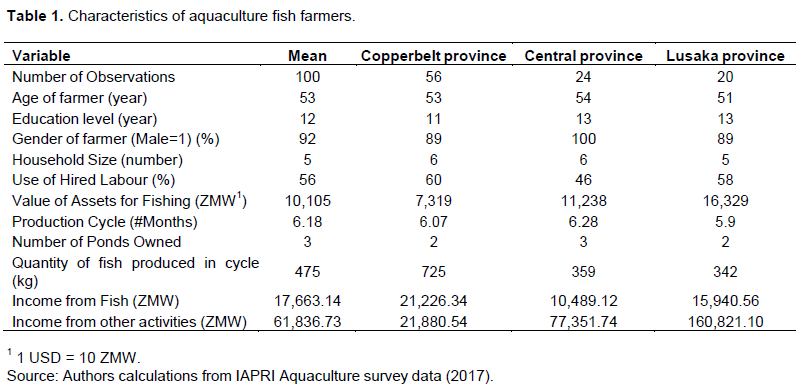
Further, results show that the majority of the fish farmers interviewed were male with only a few women in all the three provinces. This indicates low participation of women in fish farming. Findings from the focus group discussions however revealed that most women are actively involved in the marketing and processing of fish. This is also indicated in low number of women that participated in the focus group discussions compared to their men counterparts.
Economic indicators
There are some key indicators to note from the results presented in Table 1 that give general economic characteristics of fish farmers. Firstly, the average length of the production cycle (from stocking to harvesting) is six months for most of the farms surveyed in all the provinces. This implies that if a farmer owns only one pound, he/she can produce fish twice in a year. Secondly, the average quantity produced by the farmers is 475 kg per cycle with Copperbelt recording the highest (725 kg) while Lusaka had the least average quantity produced (342 kg). Thirdly, the income earned from fish farming also varied across the three provinces with the average of 17,663.14 ZMW Zambian Kwacha and Copperbelt recording the highest amount earned. Fourth, with regard to labour, on average 56% of the fish farmers use hired labour with Copperbelt and Lusaka Province recording the highest percentage of fish farmers that use hired labour. The results further indicate that fish farmers are also actively involved in other economic activities to generate additional income. The economic activities included crop production, formal wage employment as well as other off-farm activities in a year. Comparing the three provinces, fish farmers in Lusaka had the highest average income earned from other economic activities and the results.
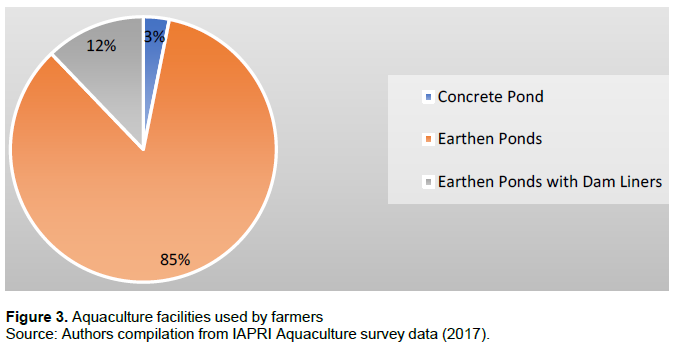
Figure 3 shows the type of aquaculture facilities that are used by the fish farmers and results indicate that majority of the farmers utilize earthen ponds (85%). About 12% of ponds were earthen ponds with dam liners and less than 5% were concrete ponds. Similarly, the baseline study by Mwango et al. (2016) shows that over 90% of the farmers utilize earthen ponds compared to concrete ponds. On the contrary, the aquaculture studies in Nigeria show that a majority of the small-scale fish farmers utilize concrete ponds compared to earthen ones (Issa et al., 2014; Akegbejo-Samsons and Adeoye, 2012). The choice of the type of facility to be used by the fish farmers is dependent on a number of factors such as water availability and soil type, as well as costs associated with constructing and maintaining the ponds.
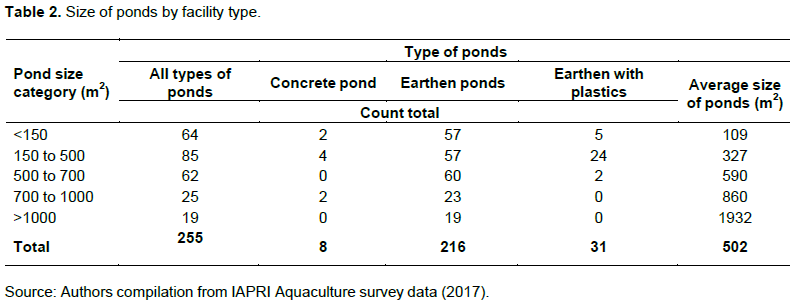
Further, results in Table 2 show the different sizes of ponds that farmers own by the facility type. The result indicates that the average size of ponds is about 502 m2 and most of the ponds are between 150 and 500 m2 followed by those that are less than 150 m2. The third highest category of pond sizes is between 500 and 700 m2 and only 19 out of the 255 ponds were more than 1000 m2.
Profitability analysis
Cost of investing in aquaculture farming
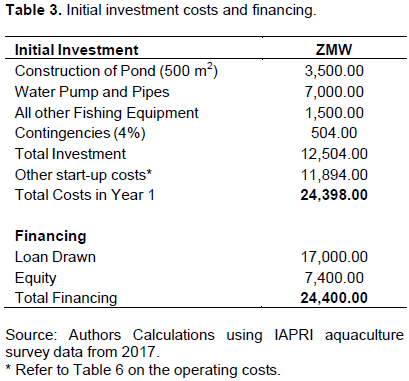
In order for a farmer to venture into fish farming business, one needs to know the costs associated with starting up fish farming and the required capital to invest. The investment may include obtaining land, buildings, ponds and other start-up costs. In this study, however, we assume the farmer already has land available at his/her homestead; hence our study does not include the cost of obtaining land. Other studies that have looked at the profitability of aquaculture production have included the cost of buying land and building other farm structures, besides the fish ponds (Okechi, 2004; Salia and Jensson, 2008). The initial investment costs for constructing a 500 m2 earthen pond are presented in Table 3. The costs include setting up the ponds, cost of water pump and pipes, and other fishing equipment. In the initial investment cost, we include a 4% contingency. Financing of the investment is assumed to be paid by equity, which is approximately 30% of the total capital and a one-time loan accounting for 70% of the total investment costs and other start-up costs. In this study, we also assume the repayment period of the loan is four years with a one-year grace period in the first year of setting up the business and an interest rate of 12.5%. The total investment cost and other start-up cost is estimated to be 24,000 ZMW ($2,400) of which 12,500 ZMW ($1,250) is for constructing the pond, setting up the water supply and other fishing equipment.
Is investment in aquaculture profitable?
To answer this research question, we estimated the profitability and viability of aquaculture production using net present value, the benefit-cost ratio as well as the internal rate of return. Based on the data collected for this study and other past studies on aquaculture production in Zambia (Mwango et al., 2016; Shula and Mofya-Mukuka, 2015), we made the aforementioned production assumptions to estimate the profitability of aquaculture production. Appendix A1 shows the projected 10-year operational costs and cash inflows. It should be noted that the total costs (cash outflow) in the first year include the initial investment costs. Further, in estimating the operational costs we include fixed costs and variable costs. Fixed costs are associated with the long-term operation of the fish farming business such as repayment of borrowed money and depreciation.
Profitability measures NPV and IRR
NPV is the most commonly used measure for evaluating the profitability of an investment and it indicates how much value an investment adds to the business. Appendix A2 shows the estimated NPV at 20, 15, and 10% discount rates and results show that NPV is positive. For the purposes of this study, the discount rate used is 15%. Using this rate, NPV at the end of 10 years of business operation was found to be 17,524.136 ZMW.
A positive NPV implies that the aquaculture business venture is feasible and profitable. Figure 4 shows the estimated NPVs over the 10-year period and the results show that NPV is sensitive to the choice of discount rate used. Evaluating the costs and benefits of an investment involves an important step of choosing a discount rate. According to Kossova and Sheluntcova (2015), the discount rate allows for comparison of social benefit and costs that might arise at different time points and the value of the discount rate has a significant impact on the present value of a project/investment.

For instance, at 20% discount rate the estimated NPV is 12,829.98 ZMW compared to 17,524.136 ZMW and 24,292.31 ZMW at 15% and 10% respectively. The decision to accept or reject an investment can be affected by the discount rate used. For example, an overestimated rate might lead to the rejection of a worthwhile project/investment and conversely, an underestimated rate might cause acceptance of a long-term investment/ projects with distant benefits (Kossova and Sheluntcova 2015). Though there is no clear guide on the choice of the discount rate to use, Treasury Guidance (2003) suggests that, for very long-term investments/projects (over 30 years) a lower discount rate should be used.
After estimating the NPV, IRR was estimated, which is simply the rate of return that is expected to be derived from an investment considering the amount and timing of the associated cash flows. For this study, we use 10 and 20% as the discount rates for estimating IRR and the estimated IRR is 42.38%. The IRR of 42.38% suggests that the proposed investment in aquaculture production will generate an average annual rate of return equal to 42.48% over the life of the project. Since the estimated IRR is positive and above 0, it implies that the investment in aquaculture production is profitable and is a worthwhile investment.
Benefit-Cost Ratio (BCR)
In addition to the NPV and IRR, another measure used to determine if an investment is profitable and viable is the Benefit Cost Ratio (BCR). BCR has been used in past studies to evaluate the viability of fish farming (Emokaro et al., 2010; Olaoye et al., 2012; Akegbejo-Samsons and Adeoye, 2012). The benefit-cost ratio measures how effective the revenues cover the cost of an enterprise. Using the 15% discount rate (DR), Table 4 shows the discounted benefits (revenues) and costs.

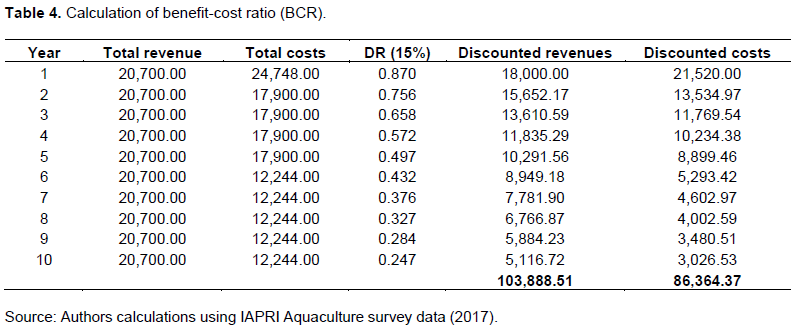
The estimated benefit-cost ratio is 1.2, which is greater than 1, and indicates that small-scale fish farming in the study areas is profitability. The estimate of 1.2 indicates that at a 15% discount rate, the gross revenue covers the total cost 1.2 times. Fish farming is therefore, a viable business in the study areas.
Gross margins estimations
This part of the study presents the estimated gross margins based on the costs and revenue information collected from 100 farmers in the districts surveyed. In addition, the gross margins in the second column are based on the recommended feeding as outlined by livestock service centre. The gross margins are estimated based on the pond size categories as well as on the overall average size ponds. Table 5 shows the variables used to estimate the gross margins, which include the cost of fingerlings, cost of feed, labour, and transportation costs. The production cycle is estimated at six months based on the responses from the farmers.
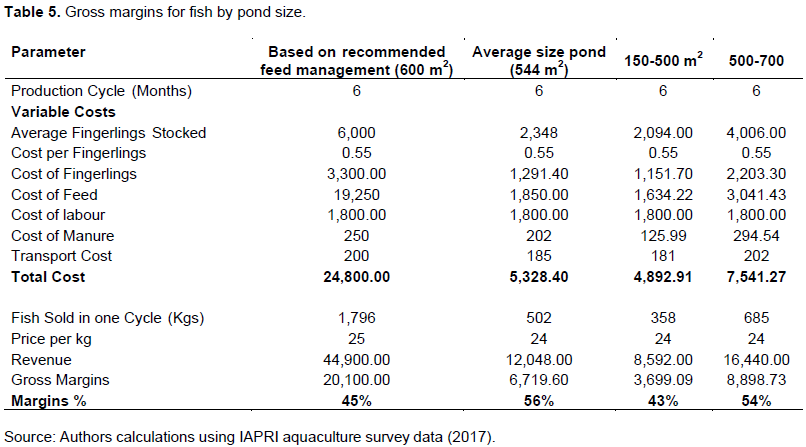
The analysis of gross margins presented in Table 5 is positive indicating that fish farming enterprise is profitable and can contribute to household incomes. The gross margins, however, vary across the different sizes of the ponds from 3,699.09 to 20,100.00 ZMW. The averagely sized ponds of 544 m2 generate approximately 12,048.00 ZMW per production cycle and the estimated gross margin is 6,719.60 ZMW. For the purposes of gross margins calculations, we used the average cost of hired labour for all the fish farmers interviewed in this study. The number of hired workers ranged from zero to four persons per farm and the average labour cost is per production cycle estimated to be six months. Table 5 reveals that the cost of labour, feed, and fingerlings accounted for the large proportion of the cost of fish farming in the study areas. The high cost of feed was cited by the farmers that participated in the focus group discussions as one of the challenges faced by fish farmers.
Similarly, studies that have looked at profitability of aquaculture production in Kenya, Nigeria, and Uganda have also indicated that the cost of feed and fingerlings are important factors that affect the economic potential of fish farming (Hyuha et al., 2011; Issa et al., 2014; Okechi, 2004; Olaoye et al., 2012; Akegbejo-Samsons and Adeoye, 2012). Further, the net profit margin percentages for all the categories of ponds show that fish farming in the selected areas is a profitable business venture.
Assumptions applied for gross margin calculations
i) 10% mortality of fish stocked.
ii) Size of fish at harvest (minimal feeding): 200 g.
iii) Size of fish at harvest (recommended feeding-commercial complete feed) 350 g.
iv) Feed types surveyed (Single ingredients, commercial complete, own formulated feed).
v) Home consumption: 5% of harvest.
vi) Average labour cost K300/month.
Sensitivity analysis
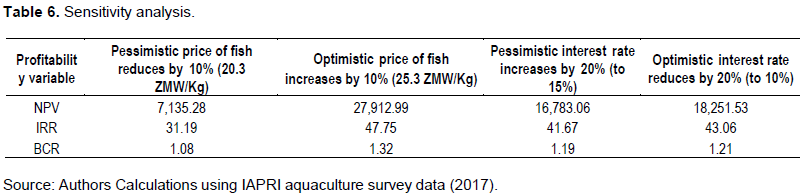
Since prices of commodities are constantly changing, a sensitivity analysis was performed in this study to analyze the risk of establishing an aquaculture business in the selected areas. The sensitive analysis not only helps to check the robustness of our findings that aquaculture production has positive returns but also helps to highlight some potential interventions in case of the changes.
Table 6 shows the sensitivity analysis by computing the NPV, IRR, and BCR with the best and worst case scenarios. The pessimistic scenarios show the effect of a decrease in the price of fish by 10% and an increase in the loan interest rate by 20%. The optimistic scenario, on the other hand, shows the effect of an increase in the price of fish by 10% and a decrease in the loan interest rate by 20%. The four scenarios are performed separately to see the effect in changing one variable at a time. The results highlighted in Table 6 shows that the profitability of aquaculture production is more sensitive to changes in the price of fish compared to the changes in the loan interest rate. For instance, a 10% decrease in the price of fish reduces NPV from 17,524.136 to 7,135.28 ZMW while IRR reduces from 42.38 to 31.19%.
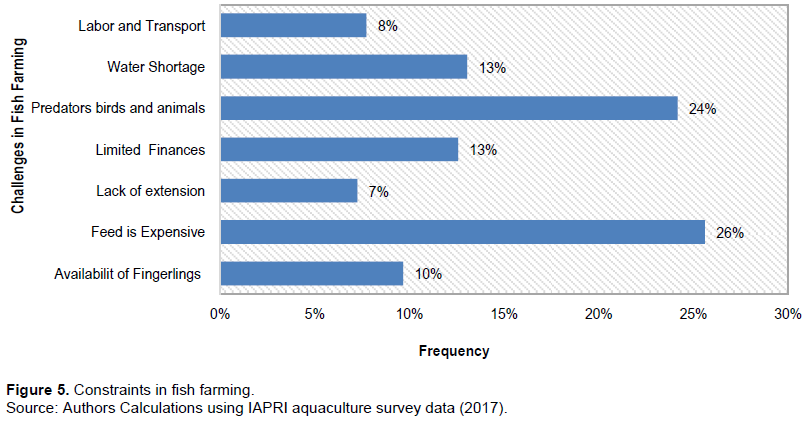
Constraints in fish farming
The third objective of this study was to identify the constraints to fish farming among the small-scale fish farmers in Zambia. Both in the structured questionnaire and the focus group discussions, the participants (respondents) were asked to highlight the main constraints they face in fish farming. From the results presented in Figure 5, high cost of feed and predator birds and wild animals) were identified to be the most serious constraints to fish farming. This was followed by limited water supply and finances as well as availability of quality fingerlings.
Fish predators and cost of feed
During the focus group discussions, participants indicated that commercial fish feed is expensive hence, some of the farmers resort to using alternative feed that has little effect on the growth of fish. In some cases, farmers mentioned that they use maize bran and vegetables such as cabbage to feed their fish. The issue of predators was mentioned to have a negative impact on the quantity of fish that farmers eventually harvest thereby reducing the income that can be generated from fish farming. The issues of high cost of feed and predators have also been highlighted in other studies as factors affecting the profitability of fish farming (Hyuha et al., 2011; Olaoye et al., 2012; Ugwumba and Chukwuji, 2010; Ume et al., 2016). Further, Ume et al. (2016) indicate that due to high costs and often unavailability of fish feed, it makes fish farming unproductive as resource-poor farmers tend to stop feeding their fish when the prices of feed are high and resume only when they can afford the cost.
Limited supply of water and lack of capital
The other constraints include a limited supply of water and lack of capital to finance the aquaculture business venture. The majority of the farmers visited depend on groundwater for their fishing. This poses a challenge to fish production especially in the hot season as well as during drought years or when the rainfall is very low. One way to address this is investing in water pumps that can continuously pump water into the ponds. Investment in aquaculture production is capital intensive especially for the resource-poor farmers and participants from the FGDs indicated that the cost of constructing the ponds and initial operating costs of feed are usually high. However, they also indicated that once they started harvesting, they were able to generate enough revenue to cover the cost. The level of productivity by small-scale farmers is dependent on their access to productive resources, which is often determined by the availability of finances (credit).
Availability of fingerlings (fish seed)
Further, some farmers especially those in Central Province, indicated that availability of good quality fingerlings was another challenge they faced in their fish farming business. They bemoaned that they have to travel either to Copperbelt or Lusaka Province to purchase fingerlings. This was contributing to the high cost of doing business due to high transport costs.
Lack of management and technical skills
It was also noted that most of the fish farmers only had one-time training in fish farming. They indicated that a lack of management skills and technical knowledge in fish farming was prevalent among the small-scale fish farmers. Participants in the FGDs indicated that they were only visited by extension officers when they started the cooperatives and no follow-up training in fish farming have been conducted. The ineffective extension service delivery is mainly due to a shortage of staff and training materials, limited funding by the government, thereby depriving the fish farmers of the much needed technical training. As a result, learning from other fish farmers is what most small-scale farmers rely on to gain some knowledge in fish farming.
CONCLUSION AND RECOMMENDATIONS
This study has shown that small-scale investment in aquaculture production is a profitable venture and a farmer would require approximately 24,750 ZMW as start-up capital for constructing the pond and other operational costs. The operational costs, however, tend to reduce in the following years. An insight into the economic feasibility of the fish farm operations was gained using the financial analysis tools and it was useful in determining the feasibility of the enterprise. The indicators of investment returns estimated include gross margins, NPV, IRR, and BCR. The results from the profitability analysis show positive net revenue, net present value and internal rate of return. The benefit-cost ratio is also greater than one implying that investment in aquaculture production is a profitable and viable business venture. The profitability analysis is based on the assumption of a 500 m2 pond for a small-scale fish farm. The assumption of the production figures is based on the survey findings. The results reveal that over the useful life of the ponds, which is assumed to be 10 years, the estimated NPV is 17,524.13 ZMW and the IRR is 42.38% measured at the discount rate of 15%. The positive NPV implies that the aquaculture enterprise is feasible and profitable. The projected cash flow is sufficient to repay the invested capital and provide returns on the capital. The BCR was estimated to be 1.2 at the 15% discount rate and since BCR is greater than one, it further confirms that fish farming is a profitable and viable enterprise. The profitability analysis was further subjected to a sensitivity analysis and the results show that aquaculture production was very sensitive to changes in the price of fish. For instance, a 10% reduction in the price of fish resulted in a 59% decrease in the estimated NPV, holding other factors constant. While a 20% increase in the loan interest rate only showed a 4% decline in the NPV ceteris paribus, the findings of this study compare favourably with other studies that have shown that fish farming is viable and profitable even at a small-scale.
The study also identified some of the constraints that fish farmers face. The main constraints include high cost of feed, animal and bird predators, lack of capital (finances), non-availability of fingerlings, and the inconsistent supply of water as well as limited access to extension services. These factors have negative implications on the profitability of the fish farming enterprise. For instance, farmers complained of limited knowledge in the management of their fish and this has resulted in the low production levels. The limited knowledge in fish management often results in underfeeding/overfeeding the fish and poor water management. Consequently, this affects the size of fish harvested, which ultimately determines the price of fish.
Based on the study findings, investment in aquaculture production is very profitable and viable for the small-scale farmers to generate income besides crop production. Studies have shown that Zambia has the potential to increase its aquaculture production levels; however, small-scale farmers are faced with many constraints of which access to credit is among the top challenges. This study, therefore, recommends that the government in partnership with private companies (financial lending institutions) should establish credit schemes for fish farmers. Increasing farmer’s access to credit from microfinance banks and commercial banks is necessary to ensure aquaculture development in Zambia.
To address the issue of high cost of feed, farmers should be taught how to formulate quality feeds from on-farm crops that can be used as feed ingredients. Adoption of integrated livestock-crop-fisheries production system should be promoted among small-scale fish farmers as a way of reducing costs associated with the fish feed. This, however, requires training the farmers in best farm practices that ensure sustainable growth of the aquaculture sector. Hence, there is a need for government and other key stakeholders in the sector to strengthen the extension system to build capacity for the small-scale fish farmers.
CONFLICT OF INTERESTS
The authors have not declared any conflict of interests.
ACKNOWLEDGMENTS
The authors appreciate the financial and substantive support of the Swedish Embassy and the United States Agency for International Development (USAID) in Lusaka. They are grateful to the research team at Indaba Agricultural Policy Research Institute for useful comments and analyses synthesized in the paper. They further would like to acknowledge the technical and capacity building support from Michigan State University and its researchers.
REFERENCES
|
Akegbejo-Samsons Y, Adeoye D (2012). Measuring Profitability in Small Scale Aquaculture Enterprises in South West Nigeria. Presented at the 16th IIFET Conference, July 16-20, 2012. Dares Salaam, Tanzania. |
|
|
Chisanga B, Zulu-Mbata O (2018). The changing food expenditure patterns and trends in Zambia: implications for agricultural policies. Food Security 10(3):721-740. |
|
|
Correia da SL, Gunnar N, Swee C, Leonie B, Rupert B (2003). Assessing Profitability in Competition Policy Analysis. Economic Discussion Paper No. 6. Prepared for the Office of Fair Trading by OXERA. London, UK. View |
|
|
Central Statistical Office (CSO) (2010). Central Statistical Office Summary Report Gross Domestic Product 2010 Benchmark Estimates. Lusaka, Zambia |
|
|
Department of Fisheries (DOF) (2017). Department of Fisheries 2016 Annual Report. Chilanga, Zambia: Government of Zambia, Department of Fisheries. |
|
|
Department of Fisheries (DOF) (2018). Department of Fisheries 2017 Annual Report. Chilanga, Zambia: Government of Zambia, Department of Fisheries. |
|
|
Emokaro C, Enkunwe P, Achile A. (2010). Profitability and Viability of Catfish Farming in Kogi State, Nigeria. Research Journal of Agriculture and Biological Sciences 6(3):215-219. |
|
|
Food and Agriculture Organization (FAO) (2006). The State of World Fisheries and Aquaculture. Aquaculture. |
|
|
Food and Agriculture Organization (FAO) (2010). The State of World Fisheries and Aquaculture. Food and Agriculture Organization of the United Nations 2010 Rome, Italy: FAO. |
|
|
Food and Agriculture Organization (FAO) (2014). The State of World Fisheries and Aquaculture. Food and Agriculture Organization of the United Nations 2014. Rome, Italy: FAO. |
|
|
Genschick S, Kaminski AM, Kefi AS, Cole SM (2017). Aquaculture in Zambia: An Overview and Evaluation of the Sector's Responsiveness to the Needs of the Poor. Working Paper: FISH-2017-08. Penang, Malaysia: CGIAR Research Program on Fish Agri-Food Systems and Lusaka, Zambia: Department of Fisheries. |
|
|
Genschick S, Marinda P, Tembo G, Alexander M, Thilsted SH (2018). Fish Consumption in Urban Lusaka: The Need for Aquaculture to Improve Targeting of the Poor. Aquaculture 492(2018):280-289. |
|
|
Hyuha TS, Bukenya JO, Twinamasiko, Molnar J (2011). Profitability Analysis of Small Scale Aquaculture Enterprises in Central Uganda. International Journal of Fisheries and Aquaculture 3(15):271-278. |
|
|
Indaba Agricultural Policy Research Institute (IAPRI) (2017). Aquaculture Fisheries Survey Data. Lusaka, Zambia: IAPRI. |
|
|
Issa FO, Abdulazeez MO, Kezi DM, Dare JS, Umar R (2014). Profitability Analysis of Small-scale Catfish Farming in Kaduna State, Nigeria. Journal of Agricultural Extension and Rural Development 6(8):267-273. |
|
|
Jensson P (2006). Profitability Assessment Model. Reykjavik, Iceland. |
|
|
Kaminski AM, Genschick S, Kefi AS, Kruijssen F (2017). Commercialization and Upgrading in the Aquaculture Value Chain in Zambia. Aquaculture 493(2018):355-364. |
|
|
Kossova T, Sheluntcova M (2015). Evaluating Performance of Public Sector Projects in Russia: The Choice of a Social Discount Rate. International Journal of Project Management 34(3):403-411. |
|
|
Musumali M, Heck S, Husken S, Wishart M (2009). Fisheries in Zambia: An Undervalued Contributor to Poverty Reduction. World Bank Policy Brief 1913. Washington, DC: The WorldFish Center/The World Bank. |
|
|
Mwango J, Kefi AS, Manda EC, Chijoka M, Chimba N (2016) Status of Aquaculture in the Copperbelt and North- Western Provinces of Zambia. Chilanga, Zambia: Department of Fisheries. |
|
|
Ncube P, Roberts S, Zengeni T (2016). Development of the animal feed to poultry value chain across Botswana, South Africa, and Zimbabwe. |
|
|
Okechi JK (2004). Profitability Assessment: A Case Study of African Catfish (Clarias Gariepinus) Farming in the Lae Victoria Basin, Kenya. Final Project. Kisumu, Kenya: Kisumu Research Centre. |
|
|
Olaoye O, George FO, Abdul W, Adelaja O, Ashley-Dejo S, Salako A (2012). Profitability and Viability of Fish Farming Enterprises Using Government Credit Agency Loan in Ogun State of Nigeria. Nigeria Journal of Fisheries 9(1):460-463. |
|
|
Salia AMJ, Jensson P (2008). Economic Analysis of Small-Scale Tilapia Aquaculture in Mozambique. Final Project. Maputo: Institute Nacional de Desenvolvimento de Aquacultura (INAQUA). |
|
|
Shula AK, Mofya-Mukuka R (2015). The Fisheries Sector in Zambia: Status, Management, and Challenges. Indaba Agricultural Policy Research Institute Technical Paper No. 3. Lusaka, Zambia: IAPRI. |
|
|
Thirsted SH, James D, Toppe J, Iddya K, Subasinghe R (2014). Maximizing the Contribution of Fish to Human Nutrition. Second International Conference on Nutrition: Better Nutrition Better Lives, 19-21 November. Rome, Italy. |
|
|
Treasury Guidance (2003). The Green Book: Appraisal and Evaluation in Central Government. Evaluation. London: Government of the United Kingdom. |
|
|
Ugwumba CO, Chukwuji C (2010). The Economics of Catfish Production in Anambra State, Nigeria: A Profit Function Approach. Agriculture and Social Sciences 6(4):105-109. |
|
|
Ume SL, Ebeniro A, Ochiaka CD, Uche FO (2016). Economics Analysis of Catfish Production in Anambra State, Nigeria. International Journal of Environment, Agriculture and Biotechnology 1(3):476-481. |
|
Copyright © 2024 Author(s) retain the copyright of this article.
This article is published under the terms of the Creative Commons Attribution License 4.0


