Full Length Research Paper
ABSTRACT
The potential of irrigation reservoirs in northern Ghana to support Nile Tilapia (Oreochromis niloticus) production in 1 m3 budget cages was assessed over six-months in three reservoirs (Bontanga, Golinga and Libga). Fingerlings with a mean weight of 17.0 ± 5.0 g were randomly stocked at 50, 100, 150, 200 and 250 fish per cage in duplicate and fed with a commercial tilapia feed (Raanan, 30% protein level) at 3 to 5% body weight. The results indicated that the lower densities (50 and 100 fish m-3) had a higher specific growth rate (SGR) compared to higher densities (150-250 fish m-3). The gross yield (7.5–23.1 kg cage-1) differed with increasing density on all reservoirs. Consumers in the Tamale Metropolis preferred small sized tilapias (5-6 fish kg-1) and were willing to pay US$ 1.40-2.34 kg-1 of fish, while restaurants preferred 2-3 fish kg-1 and were willing to pay US$ 3.27- 3.51 kg-1. The 200 fish m-3 stocking density was the most profitable and is recommended for cage culture on reservoirs in northern Ghana.
Key words: Cage culture, growth performance, consumer preferences, Nile tilapia, reservoirs.
INTRODUCTION
Since its inception in the 1950s, aquaculture has been recognized as a means of improving nutrition, livelihoods, ensuring food security, and sustainably maximizing Ghana’s vast and diverse water resources. Aquaculture in Ghana has witnessed a significant growth from 0.3 tonnes in 1980 to 76,620 tonnes in 2018, which is largely contributed by cage culture on Lake Volta (MOFAD, 2019). Although, aquaculture production in Ghana began in ponds, cage culture currently contributes 87% of total production (MOFAD, 2018). Despite the advances made, there is a widening gap between demand and supply of fish in Ghana which necessitates improvement in aquaculture production by exploring the potential of other water bodies.
The increasing demand for fish has necessitated the optimization of traditional production systems as well as the adoption of new technologies such as cage culture to bridge the supply deficit. Cage culture on existing irrigation reservoirs has the potential to improve the livelihoods of rural communities through employment creation, income generation, increased food security and poverty alleviation because of the year-round income and employment opportunities even when they experience poor crop harvests due to climatic change. Water resources used for irrigation, livestock watering and fishing can also be used for sustainable cage aquaculture with minimum impact on other uses (Rao et al., 2012).
Evidence of increasing fish output through cage culture abounds (Alhassan et al., 2018). However, before the commencement of cage culture in any environment, its impact on the water quality must be assessed to avoid endangering the health and wellbeing of other users. This is even more important in water stressed regions that depend on these water bodies for multiple uses. Wastes excreted by fish in cages are dispersed in the water column by currents while solids (faecal matter) settle in the sediments (Beveridge, 2004; Devi et al., 2017; Karikari et al., 2020; Parakkandi et al. 2021). The quantity of nutrients released from cages depend on the quality and quantity of feed inputs and management practices (Wang et al., 2005; Devi et al., 2017; Varol, 2019) which may cause eutrophication in reservoirs impacting on other users. Many small-scale fish farmers have failed due to inadequate knowledge of cultural practices such as stocking smaller size fry or at higher densities in production systems (Osofero et al., 2009; Abaho et al., 2020; Tigabu et al., 2020), In practice, many fish farmers lack knowledge on the size and density of fish to be stocked to achieve optimum growth (Chakraborty and Banerjee, 2010). Research on stocking density is heavily skewed towards systems in which the operator has high control over the culture environment. Cage operators usually tend to overexploit these systems by increasing the stocking density beyond the carrying capacity of the water body in order to maximize profit, which is counter-productive as it rather results in heavy economic losses and negative impacts on the environment. Additionally, the carrying capacity of any production system is also dependent on the quality of the water in which fish are produced. It is well known that the environmental quality of water bodies in northern Ghana which is in the Guinea Savannah ecological zone differs substantially from Lake Volta which has been well studied (Asmah et al., 2014, Clottey et al., 2016; Mensah et al., 2018; Karikari et al., 2020).
Northern Ghana has a long history of aquaculture which was practiced extensively in dug-outs and reservoirs which were primarily constructed for irrigation and animal watering. The potential of these reservoirs for fish production has not been fully exploited. It has largely remained an extensive practice limited to sporadic stocking of water bodies, often plagued by poor and open access management of the fish resources. The northern Savannah area of Ghana has 388 small dams with a total area of 5,676 ha (Agodzo et al., 2014) and is expected to increase in the light of the government’s policy initiative to construct additional and rehabilitate existing dams.
Studies on Lake Volta have shown that, in order to be profitable harvested fish biomass should exceed 15kg m-3 (Asmah et al., 2014; Clottey et al., 2016). Another study concluded that cage farmers can utilize densities between 50 and 150 fish m-3 targeted at producing larger fish (> 400 g) (Asase et al., 2016). Furthermore, no seasonality was observed in the water quality and growth of fish on Lake Volta (Mensah et al., 2018). However, relatively smaller reservoirs are prone to wide variations in water quality which in turn affect their production capacity. Moreover, the utilization of small to medium size reservoirs for fish production tends to be hampered by the shallowness of the water compared to larger reservoirs thus, the inability of the former to support larger cages as practiced on Lake Volta. Therefore, any culture technology used on these smaller reservoirs must be adapted to the environment to ensure they function properly. Although, some studies have been conducted on the suitability of small to medium size reservoirs for cage culture (Ofori et al., 2009; Veverica et al., 2011; Kassam, 2014; CSIR/WRI, 2015), studies on aquaculture, and in particular, use of cages on reservoirs in northern Ghana are limited. A number of large irrigation reservoirs such as the Tono, Vea and Bontanga are close to highly populated towns such as Navrongo, Bolgatanga and Tamale where fish produced could easily be marketed. This study assessed the growth performance of Nile Tilapia (Orechromis niloticus) stocked at different densities in small cages on the Bontanga, Libga, and Golinga reservoirs as well as consumer preferences for farmed tilapia in the Tamale Metropolis. The low-volume high-density cage technology is relatively cheap and easy to handle and relevant for adoption in tropical aquatic systems to ensure food and livelihood security in rural communities.
MATERIALS AND METHODS
Study area
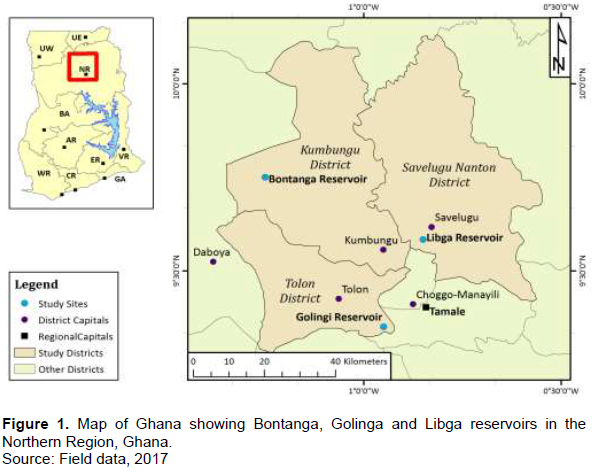
The study was conducted from November, 2016 to April, 2017 on the Bontanga, Golinga and Libga reservoirs in the Northern Region of Ghana (Figure 1). The Bontanga reservoir is located in the Kumbugu District of the Northern Region (9° 34' 18.52'' N; 1° 01' 14. 55'' W) and was impounded in 1986 with a surface area of 770 ha, maximum depth of 9 m and length of 8 km (Quarcoopome et al., 2008; Kwarfo-Apegyah and Ofori-Danson, 2010). The Golinga reservoir located in the Tolon District (90 34' 15.75'' N; 1° 01' 21.13''W) was impounded in 1974 with a surface area of 18 ha at maximum depth (Alhassan et al., 2015). The reservoir obtains its water from the River Kornin. The Libga reservoir (9° 35' 33.55'' N; 00 51' 10.98''W) is found in the Savelugu District with a surface area of 48 ha at maximum depth (Quarcoopome et al., 2008). It was impounded on the River Perusua in 1970 but collapsed and was rehabilitated in 1971 (Quarcoopome et al., 2008). These reservoirs all experience a unimodal rainy season from June to October with an annual mean of 1000 mm, solar radiation > 5.0 kWh m-2 day-1 and potential evapo-transpiration of 1652 mm per annum, giving an excess evapo-transpiration over rainfall by about 87% and annual aridity index of 0.54 (EPA, 2004). Although, these reservoirs were established for irrigation purposes they currently support a thriving artisanal fishery even in the dry season.
Cage dimensions and placement
One cubic metre (1 m3), cages were constructed from a metal frame on which were hanged polyethylene netting (1 m3) with a mesh size of 2.5 cm and a smaller inner net of mesh size 1 cm. Empty 25 L plastic containers were used as floats and the cages were moored with 0.2 m3 concrete blocks using nylon ropes. The cages were covered with 2.5 cm wire mesh to prevent predation by birds. At each reservoir, the cages were mounted at 1 m intervals to enhance water exchange and easy access for feeding and sampling.
Experimental design and variables monitored
All male Nile tilapia fingerlings (~1 g) were transported to the study site from a tilapia hatchery and nursed to a mean weight of 17 ± 5 g. Fish were then randomly stocked at 50, 100, 150, 200 and 250 fingerlings per cage except for the Bontanga site that did not have the 250 m-3 treatment. Each treatment was run in duplicate. Variables monitored were the growth performance, feed efficiency and survival.
Fish feeding and water quality analysis
Fish feeding
Fish were fed manually twice daily between 9:00-10:00 am and 3:00-4:00 pm with a commercial tilapia feed (Raanan feed) containing 33% crude protein (CP) for the first month and 30% CP for the subsequent five months. The feed was placed in feeding rings constructed in the cages to prevent feed loss. At least 10% of fish in each cage were sampled every three weeks between 6:00 and 10:00 am using a scoop net and weighed using an electronic balance (CDR 3.3 kg x 0.1 g) and Camry Dial Spring scale (SQ 5 to 20 kg). A feeding level of 5% of total biomass per cage was used during the first three months of the trial (November to January) when the fish were below 100 g after which a feeding level of 3% total biomass was adopted when the fish were larger than 100 g (February to April). The feeding level was adjusted after each sampling in order not to underfeed the fish. After six months of culture, all the experimental cages were harvested and the fish in each cage counted and weighed to determine the final weights and survival rates.
Water quality sampling
Water quality variables such as temperature (?C), pH, light penetration (Secchi disc), conductivity (µScm-1) and dissolved oxygen (mgL-1) were monitored (weekly at 6:00 am). The Eutech (DO 6+) meter was used for monitoring temperature and dissolved oxygen. The Cole-Parmer P100 handheld pH meter was used for pH monitoring while light penetration was measured with a Secchi Disc (cm). The conductivity was measured using Jenway Model 4020 conductivity meter (µScm-1). Water sample for ammonium-N nitrite-N, nitrate-N and phosphate-P were taken at 30 cm below the surface of the water in each of the cages into 1.0 L polyethylene bottles for analysis. The samples were kept on ice in a chest and transported to Council Scientific and Industrial Research-Water Research Institute Laboratory, Tamale station for analysis within 24 h. The samples were analyzed using the procedures outlined in the Standard Methods for the Examination of Water and Wastewater by American Public Health Association (APHA, 1998).
Laboratory analysis
Total alkalinity
The strong acid titration method was employed for the analysis of total alkalinity. The level of alkalinity was determined according to standard methods by diluting 10 ml of the sample with deionized water to the 100 ml mark. Then the sample was transferred to a clean 250 ml Erlenmeyer flask. One phenolphthalein indicator powder pillow was added to the content and swirled to mix thoroughly. A delivery tube tip was inserted into the solution and swirled while titrating with sulphuric acid. The observed pink solution was titrated to a colourless end point. The values were multiplied by 10 for CaCO3 alkalinity in mgL-1. Also, one bromocresol green-methyl red indicator powder pillow was added to the content in the flask and mixed. Then titrated with sulphuric acid to a light pink (pH 4.5) colour and the values read and multiplied by 10 to obtain the CaCO3 total alkalinity in mgL-1.
Total hardness
The ethylene diamine tetra acetic acid (EDTA) titration method was used to analyze total hardness. A 0.80 M EDTA titration cartridge (14399-01) was used to measure the total hardness concentration. A clean delivery tube was inserted into the titration cartridge. The cartridge was then attached to the titrator body and the delivery knob was turned on to eject a few drops of titrant. The counter was reset to zero and the tip wiped. A graduated cylinder was used to measure 10 ml of the sample which was diluted with deionized water to the 100 ml mark. The sample was transferred to a clean 250 ml Erlenmeyer flask. Thereafter, 2 ml of hardness 1 buffer solution was added to the content and swirled to mix well. One Man Ver 2 hardness indicator pillow was added to the flask and thoroughly mixed. The mixture was titrated with EDTA to observe a colour change from red to a pure blue. The values were recorded and multiplied by 10 to obtain the hardness concentration in mgL-1.
Ammonium-N
The phenol method was employed for the analysis of ammonium-N. About 50 ml of the water sample was transferred into a reaction flask. Then 2 ml of phenol reagent, 1 ml of buffer solution and 2 ml of hypochlorite reagent were added to the sample and uniformly mixed. The reaction bottles were firmly closed and kept in a dark place for at least 30 min at room temperature or incubated in a water bath at 37°C. The absorbance was measured after 30 min through spectrophotometric determination at 630 nm. The concentration of ammonium was recorded in mgL-1.
Nitrite-N
The Sulphanilamide method was used for nitrite-N analysis. Twenty-five (25) ml of the water sample was transferred into 100 ml reaction flask, to which was added 25 ml of ammonium chloride buffer solution and uniformly mixed. Thereafter, 20 ml of the mixture was used to rinse the reduction column and to adjust the passing time to 3 to 5 min. The reduction column was rinsed the second time and filled until the level of the mixture in the Erlenmeyer flask reached the 25 ml mark. Then 0.5 ml of sulfanilamide reagent and 0.5 ml of diamine solution were added to the mixture for nitrite analysis. The sample was then allowed to stand for 1 h after which a spectrophotometric determination at 540 nm was done for the azo dye colour. The concentration of nitrite was recorded in mgL-1.
Nitrate-N
The hydrazine reduction method followed by diazotization and the spectrophotometric determination at 520 nm was used to analyze nitrate-N levels in the water sample. Ten (10) ml of water sample was measured into a 25 ml test tube and 1 ml of 0.3 M NaOH was added and then 1 ml of a reducing reagent (composed of 2.5 g of copper sulphate, 27.5 g of hydrazine sulphate and 400 g of sodium hydroxide). The samples were then heated in a water bath at 60°C for 10 min and cooled. A colour reagent (1 ml) was added to the sample and allowed to stand for 5 min. The appearance of a brown colour indicated the presence of nitrate in the sample. A blank reading was taken using distilled water, treated with the same reagents but without heating which was used to zero the spectrophotometer before taking the readings. The concentration of nitrate was calculated using the absorbance directly from the calibration curve and the results expressed in mgL-1.
Phosphate-P
The Stannous Chloride method was used to analyze phosphate levels in the water samples. Exactly 10 ml of the water samples was measured into 25 ml test tubes, 2 to 3 drops of phenolphthalein indicator were added to the sample and a few drops of 280 mL conc H2SO4 or HCl were then added. The ensuing pink colour was dispensed by the addition of 0.4 ml of ammonium molybdate after which the solution was thoroughly mixed followed by a drop of stannous chloride to form a blue molybdenum complex indicating the presence of phosphates in the water sample. The sample was then allowed to stand for 2 min after which a spectrophotometric determination at 690 nm was done. The concentration of phosphate was recorded in mgL-1.
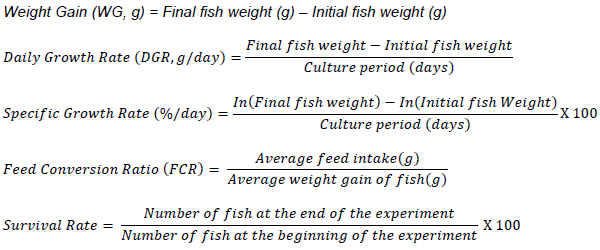
Growth performance and feed utilization
Growth performance and feed utilization were calculated based on the following parameters using the conventional methods adopted by Duodu et al. (2020):
Market survey
A market survey was conducted to determine the size preferences of consumers for farmed tilapia as well as the price at which they were willing to pay. The survey was conducted using questionnaires designed to collect quantitative and qualitative data from wholesalers and retailers, consumers, restaurant operators, staff of the Fisheries Commission, fishermen in the Tamale Metropolis and communities associated with the reservoir. The questionnaires were administered to 40 wholesale and retailers, 10 restaurant operators and tilapia joints, 100 consumers and one person from the Fisheries Commission and seven (7) fishermen. The wholesalers, retailers, and consumers were selected randomly (based on encounter at the market place) and the restaurant operators were selected using purposive sampling (must have tilapia on the menu). At the end of the experiment, a sales point was established at the Tamale Central Market where harvested fish were sorted into small, medium and large sizes and sold at GH?9.00, GH?10.00 and GH?12.00 per kilogram of fish, respectively.
Data analysis
Data on fish growth performance and water quality were analysed using the Graph-Pad Prism 6 statistical software. In order to determine differences in growth for the different stocking densities, a one-way Analysis of Variance (ANOVA) was conducted. The differences in water quality among the reservoirs were also analysed using ANOVA and Pearson Correlation was done to determine the relationship between the variables. The Tukey’s multi-comparison test was used to test for differences among means that were significant for all the ANOVA analyses. The data gathered from the questionnaire were coded and analysed using Statistical Package for the Social Sciences (SPSS) version 20.0 by cross tabulating to determine the relationship between income level of consumers and preferred size and prices of fish. The Chi-square test was performed to determine the relationship between income level of consumers and price, sizes of preferred fish. All statistical tests were considered significant for P < 0.05.
RESULTS
Growth performance of tilapia in reservoirs
The growth performance of tilapia stocked at the different densities from the three reservoirs is presented in Table 1. Generally, there were no differences in weight gain (WG), specific growth rate (SGR) and survival rate (SR) of fish stocked at 50 to 200 fish m-3 on the Bontanga reservoir. The SR at Bontanga was higher at all the densities compared to that of Golinga and Libga. There were no significant differences (P > 0.05) in the SR of fish stocked at the different densities (50 to 250 fish m-3) at Libga. However, at Golinga, the SR differed among the densities (p = 0.020, P < 0.05) when subjected to one-way analysis of variance test and ranged between 28 and 85% for 50 to 250 fish m-3 (Table 1). The SGR ranged between 1.30±0.03 and 1.41±0.11% day-1. However, there were significant differences in the SGR of fish raised at the five stocking densities on the Libga reservoir (1.27±0.01 to 1.44±0.06%day-1) (P < 0.05) as presented in Table 1. Similarly, there were differences (P < 0.05) in the SGR of fish cultured at Golinga at the lower densities 50-100 fish m-3 (1.44±0.01 and 1.50±0.11 %day-1), compared to 1.19±0.04 and 1.41±0.09% day-1 for the higher stocking densities (150-250 fish m-3), respectively at as shown in Table 1. The lower densities (50 to 100 fish m-3) had a better SGR than the higher (150 to 250 fish m-3).
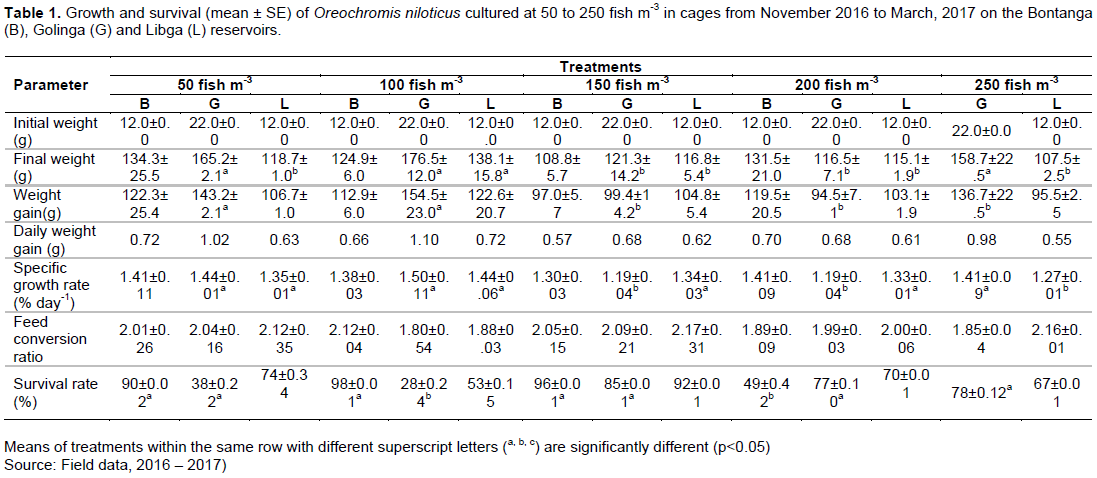
The weight gain (WG) of fish raised at Bontanga and Libga were similar for all treatments. At Bontanga, it ranged from 96.82±5.96 to 122.29±25.43 g for 50 to 200 fish m-3 at (P > 0.05), respectively. Similarly, WG at Libga was 95.5±2.5 to 122.64±20.70 g for the five densities, respectively. However, at Golinga, WG at the lower densities (50 to 100 fish m-3) was better (143.16±2.14 and 154.5±23.00 g) compared to the higher densities (150 to 250 fish m-3) of 99.40±14.2 g, 94.53±7.10 g and 136.65±22.46 g, at (P < 0.05) for the 150, 200 and 250 fish m-3, respectively. Generally, there were no differences in WG in the three reservoirs for fish stocked at the lower densities (50 to 100 fish m-3) compared to the higher densities (150 to 250 fish m-3) at (p > 0.05).
The FCR for all the densities on the three reservoirs were similar and ranged between 1.8 and 2.1 (P > 0.05). At Bontanga, the FCR improved with increasing stocking density. Similarly, the net yield increased with increasing stocking density, with only the 200 fish m-3 being an exception. The net yield differed significantly (P < 0.05), and was 10.7±0.6, 22.0±0.5, 28.0±0.5 and 19.5±6.3 kg for the 50, 100, 150 and 200 fish m-3 respectively. Fish stocked at 200 m-3 had a lower net yield compared to 100 and 150 fish m-3 in Bontanga due to a storm which overturned one of the cages in that treatment. At Libga, the net yield differed significantly (P < 0.05). among densities with the highest at 150 and 200 fish m-3 (28.4±0.9 and 27.7±0.1 kg) followed by 100 fish m-3 (20.2±1.2 kg), 250 fish m-3 (11.8±8.9 kg) and 50 fish m-3 (7.6±1.5 kg) being the lowest. Similarly, the net yield at Golinga was significantly different (P < 0.05) among the different densities with the highest net yield at 250 fish m-3 (51.4±6.5 kg) followed by 200 fish m-3 (27.0±2.4 kg), 150 fish m-3 (9.7±4.9 kg), 50 fish m-3 (4.1±1.4 kg) and 100 fish m-3 (2.8± 3.6 kg) being the lowest as shown in Table 2.
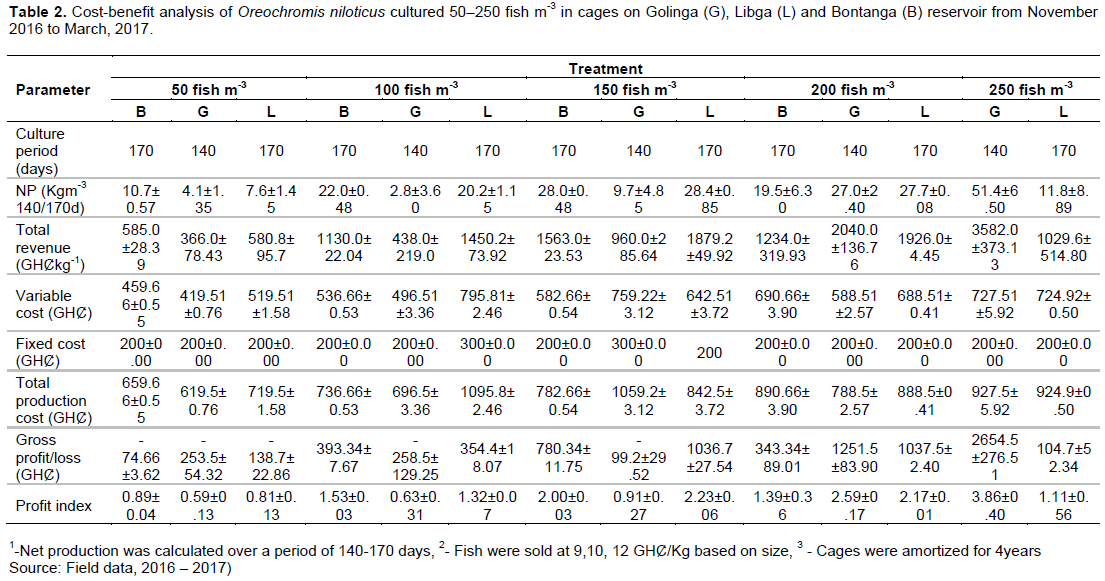
Economic analysis of stocking densities
The economic analysis of the five stocking densities is presented in Table 2. The analyses were performed using the yield data and revenue accruing from the sale of fish to ascertain the most viable density. The fixed costs were the cost of the cages, labour and fuel which were constant for all treatments. Feed was the major cost item for each treatment averaging 60% of the total variable cost. Due to the variation in the quantity of feed given, the total cost of production, breakeven price and variable cost varied with each stocking density. The estimated breakeven price was US$ 2.34 per kg of fish. The high selling price compared to the breakeven price resulted in all densities making a profit at Bontanga. Although, the lower densities at Golinga and Libga had zero return on investment (ROI), there were marginal returns on investment at the higher densities (150-250 fish m-3) in both reservoirs. Fish cultured on the Bontanga reservoir had the best return on investment for all the treatments from -11.3 to 99.7% in the order of 50 <200 <100 and <150 fish m-3. The ROI of the 200 fish m-3 was lower than 100 to 150 fish m-3 due to losses resulting from an overturn of one treatment during a storm. At Golinga, the ROI for the treatments ranged from -40.18 to 286.2% following the order 50 < 100 <150 <200 <250 fish m-3.
Similarly, at Libga the return on investment for the treatments ranged between -19.3 to 123.0% in the order of 50 <250 <100 <200 <150 fish m-3. Profitability was higher for fish stocked at 150 fish m-3 (2.0) followed by 100 fish m-3 (1.53), 200 fish m-3 (1.39) and 50 fish m-3 (0.89) at Bontanga (p < 0.05). Similarly, at Golinga the highest profit indices were realized in fish stocked at 250 fish m-3 (3.86) followed by 200 fish m-3 (2.58), 150 fish m-3 (0.91), 100 fish m-3 (0.63) while fish stocked at 50 fish m-3 had the lowest profit index (0.59), which differed among the stocking densities at (p < 0.05). Furthermore, at Libga the highest profitability was realized in fish stocked at 150 fish m-3 (2.23) followed by 200 fish m-3 (2.16), 100 fish m-3 (1.32) and 250 fish m-3 (1.32) with 50 fish m-3 having the lowest profitability of (0.81). Overall, the best profitability was realized in fish stocked between 150 to 200 fish m-3.
Market survey in Tamale
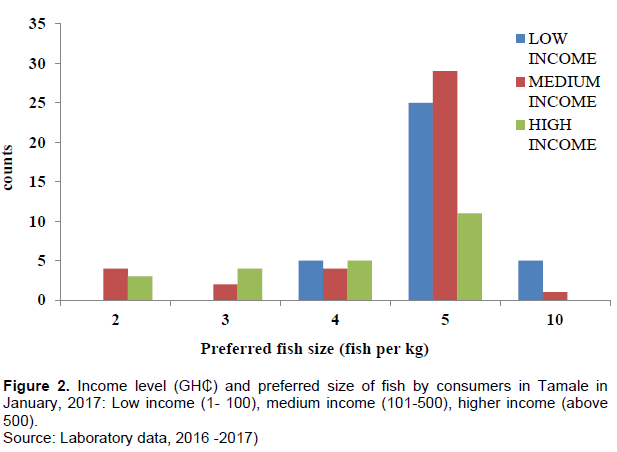
The survey results indicated that consumers’ preference for fish did not depend on their income level. Generally, consumers of all income categories preferred 5 fish per kg (Figure 2).
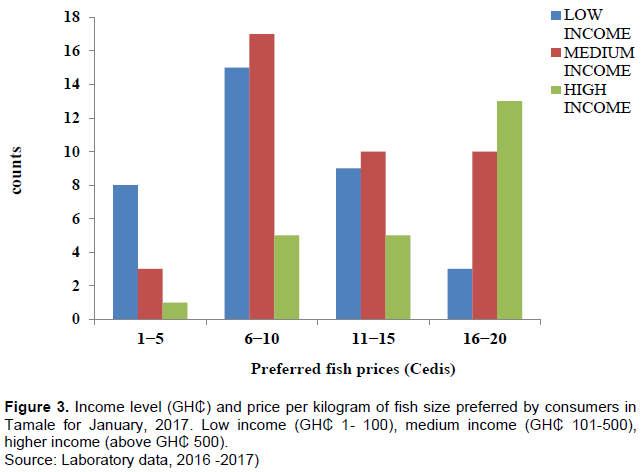
All the income categories were willing to pay US$ 1.40 to 2.34 for a kilogram of fish (Figure 3). However, there was a significant relationship between the income level of consumers and the sizes of fish preferred, with 54.2 and 38.5% of high- and low-income earners willing to pay more for larger fishes as shown in the Chi-square test [p = 0.007, ?2 (8, N=99) =20.96] and income level of consumers and prices of fish [p = 0.004, ?2 (6, N=99) =19.072]. As the income level increases, consumers were willing to pay higher prices for large sized fish compared to low-income earners.
Generally, wholesalers and retailers of fresh fish in the Tamale Metropolis obtain their fish from fisheries especially reservoirs (Bontanga, Libga and Golinga) and other sources such as River Volta at Yeji, Nasia, Adaayilli, Fuu, Daboya and cultured tilapia mainly from the Volta Catch Company Limited. Four markets are important to wholesalers and retailers of fish and fish products representing 90% of overall sales: Tamale (34.1%), Nyankpala (22.5%) Savelugu (18.4%) and Kumbungu (15%) markets. Although, the restaurants use different sizes of tilapia ranging from 2 to 4 fish kg-1, most prefer 2-3 fish kg-1 compared to 4-5 fish kg-1.
Water quality in the reservoirs
The water quality variables monitored in the reservoirsand cages are presented in Table 3. Generally, the variables were within the optimum range for tilapia culture except during the dry season (November to January) when temperatures were low (20 to 21?C) at Golinga and Libga which differed significantly from the water temperature at Bontanga. Similarly, light penetration (Secchi depth) was lower at Golinga (58.1±20.3 cm) and Libga (50.1±18.8 cm) compared with Bontanga (82.0±15.89 cm).
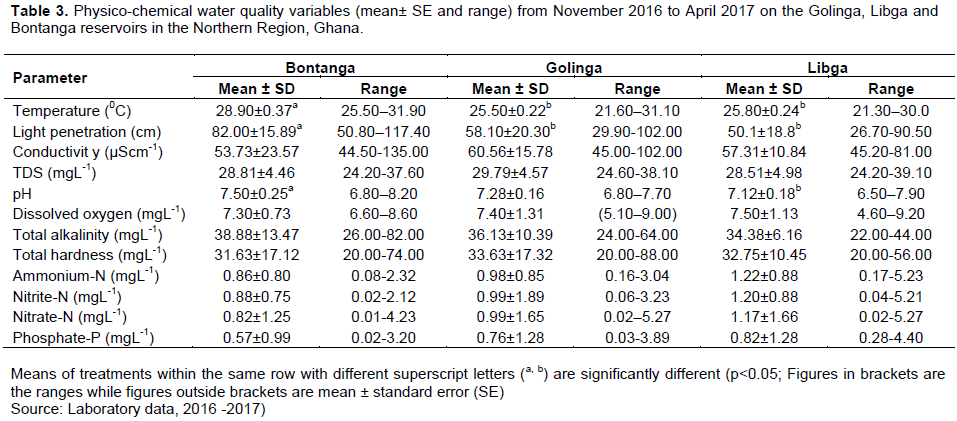
Conductivity was similar for the three reservoirs and ranged between 44.5 and 135.0 µScm-1. Similarly, there was no difference between the total dissolved solid (TDS) levels in water from the three reservoirs which ranged from24.2 to 39.10 mgL-1. The pH was stable and ranged between 6.8 and 8.2 in the three reservoirs. Dissolved oxygen levels were fairly constant and ranged between 7.3±0.75 and 7.5±1.13 mgL-1 in all the reservoirs. Moreover, total alkalinity was low in the reservoirs and ranged between 22.0 and 82.0 mgL-1. Additionally, total hardness was statistically different for the reservoirs and ranged between 20.0 and 88.0 mgL-1. The reservoir water was very low in nutrients, with ammonium-N, nitrite-N, and nitrate-N ranging between 0.08-5.23, 0.02-5.21 and 0.01-5.27 mgL-1, respectively while the phosphates level ranged between 0.020 and 4.40 mgL-1.
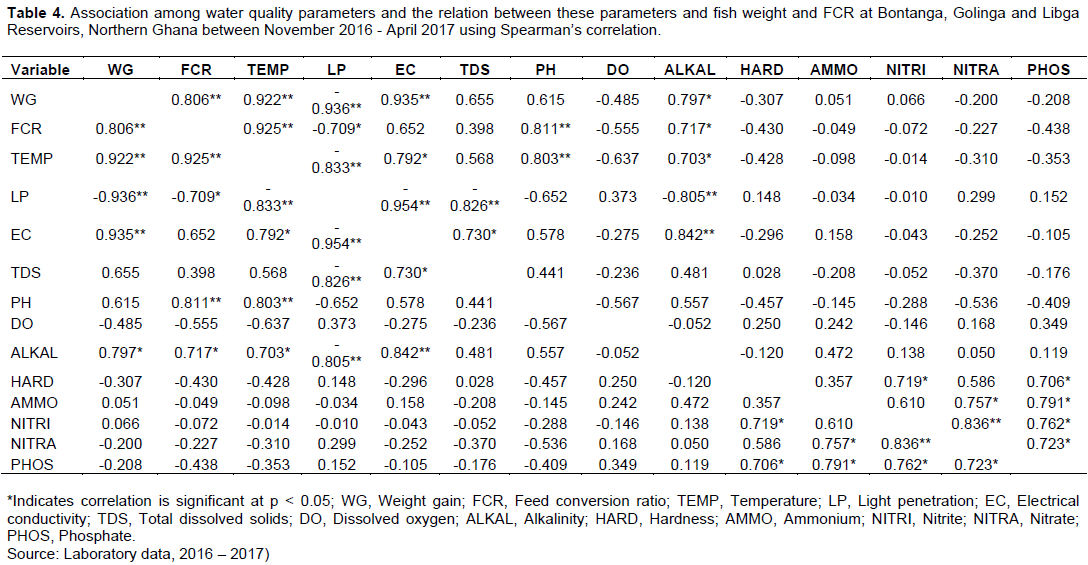
There were some correlations between the water quality variables monitored in the reservoirs. The temperature of the reservoirs was positively correlated with fish weight (r = 0.922**; P < 0.001) and FCR (r = 0.925**; P < 0.001) however, there was no significant correlation between temperature and ammonium-N concentration (r = -0.098; p = 0.801 at P > 0.05) (Table 4). There was a positive and significant correlation between conductivity and total alkalinity (r = 0.842; p = 0.004) at P < 0.05. The dissolved oxygen level was negatively correlated with weight gain (r = -0.485; p = 0.186) at P > 0.05 but was not significantly correlated with FCR (r = -0.555; p = 0.121 at P > 0.05) (Table 4).
DISCUSSION
Growth performance of tilapia in reservoirs
Generally, the growth rate of the fish decreased with increasing stocking density. Fish stocked at the lower densities (50 to 100 fish m-3) had a slightly better growth rate compared to the higher densities (150 to 250 fish m-3) which could be attributed to limited space as biomass increased within the cages (Coche, 1976; Abdel-Hakim et al., 1995; Pelebe et al., 2020; Tigabu et al., 2020, Musa et al., 2021). According to Chakraborty and Banerjee (2012) stocking fish beyond the optimum density causes significant increase in mortality and adversely affectgrowth as observed for fish stocked at the higher densities in this study. The lower growth performance of tilapia at the higher densities (150-250 fish m-3) could be attributed to stress (Ouattara et al., 2003), voluntary appetite suppression, energy wastage owing to intense antagonistic interaction and competition for food and living space (Diana et al., 2004).
Similarly, density dependent interactions influenced the growth performance of fish stocked at 150 to 250 fish m-3 (Asase et al., 2016). The effect of the stocking density on growth performance, feed conversion and survival are discussed in the subsequence sections.
Effect of stocking density on growth
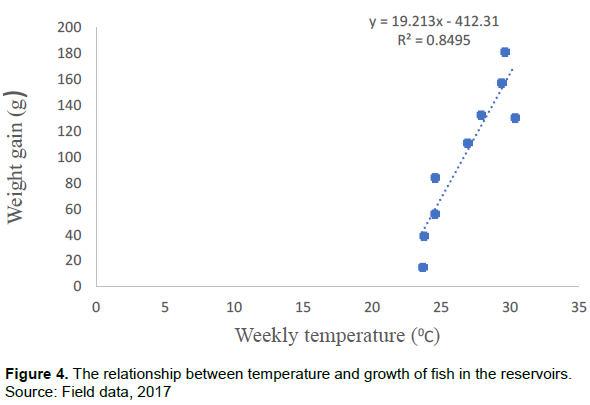
The effect of stocking density on the growth of Nile tilapia fingerlings stocked at 50, 100 and 200 fish m-3 in cages on the Yonki reservoir, Papua New Guinea, was studied by Hair et al. (2009). The results indicated that Z the specific growth rate at 200 fish m-3 was 0.83 g day-1 which is similar to what was obtained in this study (0.55 to 1.10 g day-1). The daily weight gain in this study is lower than that of Gibtan et al. (2008) and Moniruzzaman et al. (2015) who reported average daily weight gains of 1.31 to 2.01 g day-1 for densities ranging between 50 - 125 fish m-3 on Lake Volta, Ghana and Lake Kuriftu, Ethiopia where the stocking densities ranged between 50 to 150 fish m-3, respectively. In these studies, the higher daily weights recorded were attributed to good water quality that is higher temperatures (26.3-31.8°C) and dissolved oxygen levels (6.3 to 7.5 mgL-1) throughout the study period. There was a positive correlation between temperature and fish growth however, the dissolved oxygen and temperature were negatively correlated. This could partly be attributed to the washed organic waste from agricultural farms and irrigation activities that takes place along the boundaries of the reservoirs and the Harmattan, where the temperature of the reservoirs falls below the optimum level for Nile tilapia culture which was similar to Pelebe et al. (2020) and agree with Devi et al. (2017) on their reductive effect on fish growth. Additionally, the selection of uniform sized fishes before stocking curtailed aggressive behaviour during feeding. The lower growth ratesobtained in this study could also be attributed torecruitment of other fish species from the reservoir (Brycinus nurse) into the cages as well as lower temperatures experienced at the onset of the dry recruitment of other fish species from the reservoir (Brycinus nurse) into the cages as well as lower recruitment of other fish species from the reservoir (Brycinus nurse) into the cages as well as lower temperatures experienced at the onset of the dry season(December to January) and high turbidity at the start of rainy season (June toJuly). Generally, the temperature had a positive correlation with growth of the fish with a a R2 of 0.8495 as shown on Figure 4.
Moreover, the mean final weight (107.5 to 176.5 g) obtained in this study is lower than the 335 to 394 g reported by Veverica et al. (2011) on the Kordiabe reservoir, Ghana. Veverica et al. (2011) however, started with larger tilapia fingerlings (59 g) stocked at 125 and 250 fish m-3. Similarly, mean body weights of 40.7-131.7 and 107.8 - 169.6 g were reported in a study by CSIR-WRI (2015) on the Bontanga and Vea reservoirs, respectively, which were lower than the final weights obtained in this study. The relatively poor growth performance on the reservoirs compared to growth performance on Lake Volta could be attributed to poor water quality, water circulation and higher turbidity at the start of the rainy season which resulted in low transparency/Secchi depths leading to a lower feed intake.
Effect of stocking density on feed conversion
The feed conversion ratio (FCR) for the study ranged between 1.45 and 2.15 which is similar to that of Ofori et al. (2009), Osofero et al. (2009) and Karikari and Asmah (2016) who reported values ranging between 1.4 and 2.5 and 1.6 and 2.4 in studies on reservoirs and Lake Volta. Similarly, Chakraborty and Banerjee (2010) studied the effect of stocking density on mono-sex Nile tilapia in ponds and reported an FCR of 1.8 to 2.5 similar to what was recorded in this study. The relatively higher FCR in many of the densities is attributed to intraspecific competition where larger fish out-competed smaller fishes establishing feeding hierarchies of dominant and subdominant individuals of which the latter were chronically stressed. This was confirmed by Schmittou (2006) who reported, feeding hierarchies when densities were between 150 to 200 fish m-3 leading to reduced feed consumption and lower growth in subordinate animals or fishes (Verdal et al., 2019).
Effect of stocking density on survival rate
The survival rate of fish stocked in cages is independent on the stocking density (Chakraborty and Banerjee, 2012). The survival rate at Bontanga and Libga were similar but differed significantly from that at Golinga. Osofero et al. (2009) and Chakraborty and Banerjee (2012) observed that the effect of stocking density on growth and survival of Oreochromis niloticus was inversely related. The survival rate in the reservoirs was lower at the lower densities compared to the higher densities, especially, at Golinga which could be attributed to torn nets or holes in the cage nets leading to fish escapes. The survival rates on the reservoirs were similar to the typical survival rates in small-scale tilapia cages
which range between 70 and 80% (Mikolosek et al., 1997; De La Cruz-Del Mundo, 1997; Hasimuna et al., 2019; Abaho et al., 2020; Musa et al., 2021). The relatively better survival rate at Bontanga was due to fact that it is a larger water body (770 ha) compared to Golinga (18 ha) and Libga (48 ha), thus, had good water quality (temperature 28.96± 0.37? dissolved oxygen of 7.11± 0.73 mgL-1) for a greater part of the culture period compared to the smaller reservoirs. The survival rate at Bontanga was similar to earlier studies which had a survival rate of 90% with similar stocking densities (Ouattara et al., 2003; Balcázar et al., 2006; Gibtan et al., 2008; Osofero et al., 2009, Veverica et al, 2011; Costa et al., 2017). However, the lower survival rates observed at Golinga and Libga could be attributed to mortality that occurred as a result of lower temperatures (20.6±2.85°C) and poor water circulation between November to January and partly due to loss of fish through holes in nets. Unfortunately, most of these losses were only detected at the end of the study when all fish were harvested.
Environmental conditions of the reservoir
All water quality variables (Table 3) were suitable for tilapia culture (Schmittou, 2006) except temperature which was low (20.6±2.85?C) between November and January. The low temperatures were due to the cooler Harmattan winds in late November to January which affected the feeding response of fish in all the reservoirs. Furthermore, the Libga reservoir experienced an overturn in December which led to a higher-than-normal mortality in some of the cages as well as wild fish in the reservoir. Thus, stocking Nile tilapia at higher densities (150 to 250 fish m-3) might pre-dispose the fish to higher mortality on the Libga reservoir where the occurrence of an overturn is unpredictable. However, higher stocking densities could be used on the Bontanga and Golinga reservoirs where no such condition exists. The temperature (21.6 to 31.9°C) recorded in this study is similar to that of the Tono reservoir, Ghana (22.3 to 32.2°C) Akongyuure and Alhassan (2021) and the Oyun reservoir (23.1 to 29.6°C) in Nigeria (Mustapha, 2008). The temperature of the reservoirs was highly (R2 > 0.90) positively correlated with fish weight and FCR but did not show a significant correlation with the ammonium concentration showing that higher temperatures resulted in the rapid mineralization of organic materials (Hou et al., 2013).
Turbidity was high in all the reservoirs at the beginning of the rainy season and persisted for several weeks. This led to a low transparency in all the reservoirs attributed to runoff or overland erosion resulting in heavy inputs of sediments, debris, silt, inorganic and organic suspended matter in the reservoir. Transparency was higher from December to March compared to the beginning of the experiment as suspended and settleable solids settled.
The turbidity values of (26.70 to 117.40 cm) were better than the recommended limit of 14 to 40 cm by Boyd (1998) and (80.0 mgL-1 or 240.0 NTU) but similar to 62 to 162 cm for fish growth suggested by Karmakar et al. (2011) and Mustapha (2008). Turbid water restricts light penetration resulting in low primary productivity and dissolved oxygen levels. The turbidness of the reservoirs was mostly contributed by overland surface runoff from nearby agricultural land which can influence the level of phosphate in the water. For this study, phosphate levels in water ranged from 0.02 to 4.40 mgL-1. The turbidity levels in the water had no significant correlation with phosphate levels (r = 0.152; p = 0.696) at P > 0.05, indicating that the sediments and other solids in the water were not an important source of phosphate in the reservoirs.
The conductivity ranged between 44.5 and 135.0 µScm-1 which is within the tolerable range of 30 to 5000 μScm-1 for fish growth (Boyd, 2019). This is comparable to that of Akongyuure and Alhassan (2021) in the Bontanga and Tono reservoirs, however, it was lower than range of 112.8 to 164.3 μScm-1 reported in the Dawhenya reservoir by Alhassan (2011). The differences could be attributed to variations in the natural minerals within catchment of the reservoirs and the leaching of minerals and runoff from agricultural lands.
The pH was within the optimal range for fish culture (6.5 to 8.5) as noted by other studies on the reservoirs (Tepe et al., 2005; Quarcoopome et al., 2008; Akongyuure and Alhassan, 2021). Generally, fish adapts to the pH by producing mucous on the skin and inner surfaces of the gills. The pH was negatively correlated with phosphate (r = -0.409, P < 0.05) in this study (Table 4) because the pH regulates the dissolution rate of dissolved phosphorus from the sediments thus was positively related to alkalinity (Kim et al., 2003).
Generally, dissolved oxygen levels were optimal for the growth and survival of the fish (Boyd, 1990). The level of dissolved oxygen showed a weak (r < 0.3) positive correlation (P < 0.05) with ammonium-N and nitrate-N concentration in the water but negatively correlated with weight gain (r = -0.485, P ≥ 0.05) and FCR (r = -0.555, P ≥ 0.05) (Table 4). The levels of dissolved oxygen in the reservoirs were minimally affected as nutrients from agricultural plots are washed into the reservoirs with no effect on fish growth and feeding.
The reservoirs were generally very low in nutrients. The ammonium and nitrite levels in the reservoirs ranged between 0.08-5.23 and 0.02-5.21 mgL-1, respectively, which were lower than the limit that could affect fish performance however, the levels were moderately higher than that of Asante et al. (2008). The nitrate concentration was low and ranged between 0.01 and 5.27 mgL-1 which is within the optimum range for fish growth and survival (Chapman and Kimstach, 1996). This, however, was lower than the nitrate levels of 0.03 to 10.83 mgL-1 recorded by Akongyuure and Alhassan (2021) on the Tono reservoir. The phosphate levels were equally very low in the reservoirs (0.02-4.40 mgL-1) which is slightly above the recommended level of 0.01-3.00 mgL-1 for fish growth and survival (Boyd, 1998). The contributory factors were runoff of nitro-phosphate fertilizers from farmlands and organic matter into the reservoirs (Mustapha, 2008). According to Davis and Masten (2004), phosphorus concentration should be between 0.010 and 0.015 mgL-1 to limit algae blooms. The phosphate concentration was strongly correlated to total hardness (r = 0.706*, P < 0.05).
In order to ensure successful cage culture in the reservoirs, the most suitable growing period taking into consideration, the water quality dynamics was identified between August to March considering the unimodal rainfall pattern in Northern Ghana. The culture period could be extended to April to May which is the peak of the dry season if water levels are sufficiently high in the reservoirs to cope with competition for other water uses such as abstraction for irrigation and domestic uses.
Economic assessment of fish production at the different densities
Aquaculture is a capital-intensive venture and requires economic analysis of production factors in addition to the general feasibility studies to assess the profitability of operations (Table 2). Feed constituted the highest variable cost of production (60%) in almost all the stocking densities similar to that observed by Diana et al. (1994) and Ofori et al. (2009). In order to break-even, it was realized that culturing fish at the lower densities (50-100 fish m-3) was not economically feasible. Better economic returns were achieved with the higher densities 150 to 250 fish m-3 which had profits ranging between US$18.27 and 20.24 at Bontanga and Libga, respectively (Table 2). The highest profit of US$ 51.78 was obtained at Golinga at density of 250 fish m-3 and a biomass at harvest of 51.4±6.50 kg m-3. Obviously, biomass increased with increasing stocking density except at Golinga where fish were lost due to holes in the cage nets. This is similar to the findings of Watanabe et al. (1990) who reported a positive relationship between stocking density and yield of Nile tilapia. Other studies on tilapia cultured at different stocking rates had comparable biomass at harvest (16.6 to 35.97 kg m-3) (Cruz and Ridha, 1995; Costa et al., 2017; Abaho et al., 2020). The fish produced at each density on the reservoirs averaged 20.01 kg m-3, 19.11 kg m-3 and 19.0 kg m-3 at Bontanga, Libga and Golinga, respectively, which is higher than the 16.6 kg m-3 but lower than that of Costa et al. (2017). The differences could be attributed to the good feeding regime which minimized feed losses to wave action in these small volume reservoirs compared to the more vibrant waves on Lake Volta and less recruitment of wild fishes.
The profit indices of the stocking densities were similar at Bontanga but differed at Golinga and Libga. While slightly higher profits were realized in this study, profitability was lower than that of Osofero et al. (2009) which could be attributed to the lower prices at which the fish were sold. The highest profitability of 2.00 and 2.26 were recorded at densities of 150 and 200 fish m-3 at Bontanga and Libga, respectively (Table 2). However, at Golinga a profitability of 3.90 was recorded for fish stocked at 250 fish m-3. On average 200 fish m-3 is the most suitable density for Nile tilapia culture in cages on the reservoirs judging from the growth performance indices and profitability as observed by Abaho et al. (2020).
The size of tilapia preferred by consumers, wholesalers and retailers and restaurant operators in the Tamale Metropolis varies according to the income levels of the actors. The preferred size of tilapia by households in the Metropolis was 5 to 6 individuals per kilogram which is around 150 to 200 g fish. This is in contrast to the sizes preferred by customers in southern Ghana where larger sizes that is 2 to 3 fishes per kg are preferred (Karakari and Asmah, 2016). These sizes were categorized as “school boys” (<150 g), “economy” (150–200 g), “regular” (200–300 g) and “size 1” (300-400 g), size 2” (400 -500 g), “size 3” (500–700 g) for the different sizes of Nile tilapia. The size of fish that was mostly purchased from wholesalers and retailers was 5 to 6 fish kg-1 compared to the other sizes which were similar to the “economy” and “regular” size classes by fish farmers on Lake Volta (Karikari and Asmah, 2016). Consumers’ preference was influenced by the number of fish per kilogram while the size of the fish was the price determining factor for tilapia in the Tamale Metropolis. The price per kilogram of fish that consumers were willing to pay for tilapia in the Metropolis ranged between US$ 1.40 and 2.34 but 50% of the consumers from the high-income range were willing to pay US$ 3.75 to 4.68. These prices were similar to the average price of US$ 3.62 to 4.40 reported by Karikari and Asmah (2016) for similar sizes of fish on Lake Volta. The hike in prices of tilapia in Tamale is attributed to transport and other utility charges incurred in transporting fish 600 km from southern Ghana. However, many of the wholesalers, retailers and consumers were interested in paying the same price for wild caught fish from the reservoirs for farmed fish. The wild fish were sold per bowl weighing 3 to 4 kg at US$ 2.34 to 2.81 per bowl which would be uneconomical if applied to farmed fish.
CONCLUSION
The Libga, Bontanga and Golinga reservoirs are suitable for the culture of Nile tilapia in cages to support the nutritional needs as well as the livelihood of the reservoir communities. The 200 fish m-3 stocking density had better economic returns with an average net production of 24.73 kg m-3 and net profit of US$ 7.56 per cage. Fish production could be improved by starting with uniform and larger fingerlings (>50 g) and production planned to avoid the periods of lower water temperatures (December –January) and overturn on the Libga reservoir.
CONFLICT OF INTERESTS
The authors declare no conflict of interest in the publication of this scientific paper.
DATA AVAILABILITY STATEMENT
The data that support the findings of this study are available upon reasonable request.
ACKNOWLEDGEMENT
The authors are grateful to Australian High Commission in Ghana for providing financial support to undertake this study under its Direct Aid Project (ACRA/2015-2016/015).
REFERENCES
|
Abaho I, Zaabwe T, Izaara A, Kasigwa HN, Mushabe N, Byenkya S, Efitre J (2020). Effect of stocking density on growth and survival of Nile tilapia (Oreochromis niloticus, Linnaeus 1758) under cage culture in Lake Albert, Uganda. International Journal of Fisheries and Aquaculture 12(2):26-35. |
|
|
Abdel-Hakim NF, El-Nemaki FA, El-Gamal AA, Abdel-Warith AA (1995). Effect of different stocking rates on growth performance. Egyptian Journal of Agricultural Research 73(3):873-887. |
|
|
Agodzo SK, Obuobie E, Braimah CA (2014). The effects of irrigation dams on water supply in Ghana. IOSR Journal of Engineering 4(5):48-53. |
|
|
American Public Health Association (APHA) (1998). Standard Methods for the examination of water and wastewater. 20th ed. New York: American Public Health Association, American Water Works Association, Water Environment Federation. |
|
|
Akongyuure DN, Alhassan EH (2021). Variation of water quality parameters and correlation among them and fish catch per unit effort of the Tono Reservoir in Northern Ghana. Journal of Freshwater Ecology 36(1):253-269. |
|
|
Alhassan EH, Kombat EO, Karim D (2018). Growth Performance of the Nile Tilapia, Oreochromis niloticus cultured in cages in two dams in the Bongo District of Ghana. West African Journal of Applied Ecology 26(1):11-21. |
|
|
Alhassan EH, Akongyuure DS, Asumang F (2015). Determination of Morphometric Relationship and Condition Factors of Four Cichlids from Golinga Reservoir in Northern Region of Ghana. Journal of Biological Sciences 15(3):201-206. |
|
|
Alhassan EH (2011). Limnological evaluation of the fisheries potentials of a Ghanaian Reservoir. Journal of Applied Science 7(2):91-97. |
|
|
Asante KA, Quarcoopome T, Amevenku FYK (2008.) Water Quality of the Weija Reservoir after 28 Years of Impoundment. West African Journal of Applied Ecology 13(1):125-131. |
|
|
Asase A, Nunoo FKE, Attipoe FYK (2016). Lake-Based Nursery Rearing of Nile Tilapia (Oreochromis niloticus) fingerlings in nylon hapas: Effects of stocking density on growth, survival and profitability. Agricultural Sciences 7(10):660-669. |
|
|
Asmah R, Karikari AY, Abban EK, Ofori JK, Awity LK (2014). Cage fish farming in the Volta Lake and the Lower Volta: practices and potential impacts on water quality. Ghana Journal of Science 54(1):33-47. |
|
|
Balcázar J, Aguirre A., Gómez G, Paredes W (2006). Culture of Hybrid Red Tilapia (Oreochromis mossambicus × Oreochromis niloticus) in Marine Cages: Effects of Stocking Density on Survival and Growth. University of Zaragoza, Zaragoza, Spain. |
|
|
Beveridge M (2004). Cage aquaculture (3rd edition). Wiley-Blackwell Publishing, Oxford, UK 380 p. |
|
|
Boyd CE (2019). Water Quality: An introduction. Third Edition. New York: Springer P 427. |
|
|
Boyd CE (1998). Water quality for pond aquaculture. International Centre for Aquaculture and Aquatic Environments. Alabama Agricultural Experiment Station, Auburn University, Alabama. Research Development Series 43:115-119. |
|
|
Boyd CE (1990). Water Quality in Ponds for Aquaculture. Birmingham, Alabama, Auburn University P 439 |
|
|
Chakraborty SB, Banerjee S (2010). Effect of stocking density on monosex Nile tilapia growth during pond culture in India. International Journal of Animal and Veterinary Sciences 4(8):646-650. |
|
|
Chakraborty B, Banerjee S (2012). Comparative growth performance of mixed-sex and monosex Nile tilapia at various stocking densities during cage culture, Department of Zoology, Serampore College, Hooghly-712201, West Bengal, Aquaculture Research Unit, University of Calcutta, India. Recent Research in Science and Technology 4(11):46-50. |
|
|
Chapman D, Kimstach V (1996). Selection of water quality variables. In: Chapman, D, editor. Water quality assessment- A guide to use of biota, Sediments and water in environmental monitoring. Second Edition. Cambridge: University Press pp. 74-133. |
|
|
Clottey MNK, Asmah R, Ofori-Danson PK, Ameworwor MY, Karikari AY (2016). Impacts of cage culture on physico-chemical and bacteriological water quality in Lake Volta, Ghana. African Journal of Aquatic Science 41(4):473-480. |
|
|
Coche AG (1976). A general review of cage culture and its application in Africa. FAO Tech. Conf. on Aquaculture, Kyoto, Japan, FIR AQ/Conf. 76/E. 72:33. |
|
|
Costa AAP, Roubach R, Dallago LSB, Bueno WG, McManus C, Bernal MEF (2017). Influence of stocking density on growth performance and welfare of juvenile tilapia (Oreochromis niloticus) in cages. Arquivo Brasileiro de Medicina Veterinária e Zootecnia 69(1):243-251. |
|
|
Cruz EM, Ridha MT (1995). Survival rates of tilapia Oreochromis spilurus (Gunther) fingerlings reared at high densities during winter using warm underground sea water. Aquaculture Research 26(5):307-309. |
|
|
CSIR/WRI (2015). Enhancing Food Security through Cage Fish Culture and Water Conservation by Re-Afforestation of Reservoirs in Northern Ghana. Annual Report 2015: P 111. |
|
|
Davis ML, Masten SJ (2004). Principles of environmental engineering and science. New York, NY: McGraw-Hill. |
|
|
De La Cruz-Del Mundo R, Del-Mundo P, Gorospe M, Macas R (1997). Production and marketing of cage-reared tilapia (Oreochromis niloticus) in Taal Lake, Agoncillo, Batangas. In K. Fitzsimmons (Ed.), Tilapia aquaculture. Northeast Regional Agricultural Engineering Service, Ithaca, New York. 9th - 12th November, 1997. Proceedings from the Fourth International Symposium on Tilapia in Aquaculture: pp. 633-641. |
|
|
Devi PA, Padmavathy P, Aanand S, Aruljothi K (2017). Review on water quality parameters in freshwater cage fish culture. International Journal of Applied Research 3(5):114-120. |
|
|
Diana JS, Lin CK, Jaiyen K (1994). Supplemental feeding of tilapia in fertilized ponds. Journal of the World Aquaculture Society 25(4):497-506. |
|
|
Duodu CP, Adjei-Boateng D, Edziyie RE (2020). Effect of pond fertilization on productivity of tilapia pond culture in Ghana, Journal of Fisheries and Coastal Management 2(2020):56-64, |
|
|
Environmental Protection Agency (EPA) (2004). United Nations Convention to Combat Desertification (UNCCD). Country Profile from the EPA Ghana Report 16 p. |
|
|
Gibtan A, Getahun A, Mengistou S (2008). Effect of stocking density on the growth performance and yield of Nile tilapia (Oreochromis niloticus L, 1758) in a cage culture system in Lake Kuriftu, Ethiopia. Aquaculture Research 39(13):1450-1460. |
|
|
Hair, C., Wani, J.M., Minimulu, P., & Salato, W. (2010). Improved feeding and stocking density for intensive cage culture of GIFT tilapia, Oreochromis niloticus in Yonki Reservoir. |
|
|
Hasimuna OJ, Maulu S, Monde C, Mweemba M (2019). Cage aquaculture production in Zambia: Assessment of opportunities and challenges on Lake Kariba, Siavonga district. The Egyptian Journal of Aquatic Research 45(3):281-285. |
|
|
Hou D, He J, Lu C, Sun Y, Zhang F, Otgonbaya K (2013). Effects of environmental factors on nutrients release at sediment-water interface and assessment of trophic status for a typical shallow lake, northwest China. World Science Journal Article ID 716342, 16 p. |
|
|
Karikari AY, Asmah R (2016). Fish farm surveys. In: Asmah R, Karikari A, Falconer L, Telfer TC, Ross LG. Cage aquaculture in Lake Volta, Ghana: Guidelines for a sustainable future. CSIR Water Research Institute, Ghana and University of Stirling, Stirling UK P 112. |
|
|
Karikari AY, Asmah R, Anku WW, Amisah S, Agbo NW, Telfer TC, Ross LG (2020). Heavy metal concentrations and sediment quality of a cage farm on Lake Volta, Ghana. Aquaculture Research 51(5):2041-2051. |
|
|
Karmakar S, Haque SMS, Hossain MM, Shafiq M. (2011). Water quality of Kaptai reservoir in Chittagong Hill tracts of Bangladesh. Journal of Forest Research 22(1):87-92. |
|
|
Kassam L (2014). Aquaculture and food security, poverty alleviation and nutrition in Ghana: Case study prepared for the Aquaculture for Food Security, Poverty Alleviation and Nutrition project. World fish, Penang, Malaysia. Project Report: 2014-48. P 47. |
|
|
Kim LH, Choi E, Stenstrom MK (2003). Sediment characteristics, phosphorus types and phosphorus release rates between river and lake sediments. Chemosphere 50(1):53-61. |
|
|
Kwarfo-Apegyah K, Ofori-Danson PK (2010). Spawning and recruitment patterns of major fish species in Bontanga Reservoir, Ghana. West Africa. Lakes & Reservoirs Research & Management 15(1):3-14 |
|
|
Mensah ET, Dankwa HR, Torben LL, Asmah R, Campion BB, Edziyie R (2018). Effects of seasonal and environmental changes on aquaculture production in tropical Lake Volta, Ghana. Aquaculture international 26(6):1387-1400. |
|
|
Mikolasek O, Lazard J, Alhassane M, Parrel P, Ali I (1997). Biotechnical Management of small-scale tilapia production in floating cages in Niger River (Nigeria). In: K. Fitzsimmons (Ed.), Tilapia Aquaculture. Proceedings from the Fourth International Symposium on Tilapia in Aquaculture (pp. 348-356). Natural Resource, Agricultural, and Engineering Service, Ithaca, New York. Jan 1, 1997. P 808. |
|
|
MOFAD (2019). Medium term expenditure framework (MTEF) 2019-2021, Programme based budgets estimates. |
|
|
MOFAD (2018). Medium term expenditure framework (MTEF) 2018-2021, Programme based budgets estimates. |
|
|
Moniruzzaman M, Uddin KB, Basak S, Mahmud Y, Zaher M, Bai SC (2015). Effects of Stocking Density on Growth, Body Composition, Yield and Economic Returns of Monosex Tilapia (Oreochromis niloticus L.) under Cage Culture System in Kaptai Lake of Bangladesh. Journal of Aquaculture Research and Development 6(8):357-363. |
|
|
Musa S, Aura CM, Okechi JK (2021). Economic analysis of tilapia cage culture in Lake Victoria using different cage volumes. Journal of Applied Aquaculture pp. 1-19. |
|
|
Mustapha MK (2008). Assessment of the water quality of Oyun reservoir, Offa, Nigeria, using selected physico-chemical parameters. Turkish Journal of Fish Aquatic Science 8(2):309-319. |
|
|
Ofori JK, Dankwa HR, Brummet R, Abban EK (2009). Producing Tilapia in Small Cage in West Africa. WorldFish Center Technical Manual No. 1952. The WorldFish Center, Penang, Malaysia P 17. |
|
|
Osofero SA, Otubusin SO, Daramola JA (2009). Effect of stocking density on tilapia (Oreochromis niloticus Linnaeus 1757) growth and survival in bamboo-net cages trial. African Journal of Biotechnology 8(7):1322-1325. |
|
|
Ouattara NI, Teugels GG, N'Douba V, Philippart JC (2003). Aquaculture potential of the black-chinned tilapia, Sarotherodon melanotheron. Comparative study of the effect of stocking density on growth performance of landlocked and natural populations under cage culture conditions in Lake Ayamé, Côte d'Ivoire. Aquaculture Research 34(13):1223-1229. |
|
|
Parakkandi J, Das BK, Saha A, Vijayakumar LR, Gunasekharan J (2021). Cage culture of Etroplus suratensis (Bloch, 1790) in a tropical reservoir in India and associated impacts on water and sediment quality. Journal of the World Aquaculture Society pp. 1-13. |
|
|
Pelebe ROE, Toko II, Nahoua I, Ouattara EYA, Fall J, Montchowui E, Ble CM (2020). Growth Performance and Nutritional Quality of Nile tilapia Caged in Northern Benin Water Reservoirs Exposed to Agricultural Effluents. Aquaculture Studies 20(1):45-54. |
|
|
Quarcoopome T, Amevenku FYK, Ansa-Asare OD (2008). Fisheries and Limnology of Two Reservoirs in Northern Ghana. West African. Journal of Applied Ecology 12(1):1-18. |
|
|
Rao D, Perrino ES, Barreras E (2012). The sustainability of tilapia fish farming in Ghana. Research paper. Blue Kitabu Research Institute, Boston MA. 20 p. |
|
|
Schmittou HR (2006). Cage culture. Tilapia: biology, culture, and nutrition pp. 313-346. |
|
|
Tepe Y, Turkmen A, Mutlu E, Ates A (2005). Some physico-chemical characteristics of Yarselli Lake, Turkey. Turkish Journal of Fish Aquatic Science 5(1):35-42. |
|
|
Tigabu Y, Yimer A, Teffera F (2020). Growth Performance of Nile Tilapia, Oreochromis niloticus in BOMOSA Cages in Koftu Reservoir. Livestock Research Results pp. 552-562 |
|
|
Varol M (2019). Impacts of cage fish farms in a large reservoir on water and sediment chemistry. Environmental Pollution 252:1448-1454. |
|
|
Verdal H, O'Connell CM, Mekkawy W, Vandeputte M, Chatain B, Bégout ML, Benzie JA (2019). Agonistic behaviour and feed efficiency in juvenile Nile tilapia Oreochromis niloticus. Aquaculture 505:271-279. |
|
|
Veverica K. Phelps R, Kanfantine S, Safo P (2011). Introducing Low volume: High density Cage culture in Ghana, Soy-in-Aquaculture Ghana, EMP projectE10MX15711. P 22. |
|
|
Wang YB, Xu ZR, Guo BL (2005). The danger and renovation of the deteriorating pond sediment. Feed industry 26(4):47-49. |
|
|
Watanabe WO, Clark JH, Dunham JB (1990). Culture of Florida red tilapia in marine cages: the effects of stocking density and dietary protein on growth. Aquaculture 90(2):311-321. |
|
Copyright © 2024 Author(s) retain the copyright of this article.
This article is published under the terms of the Creative Commons Attribution License 4.0


