Full Length Research Paper

ABSTRACT
Many studies proposed models of ICT acceptance and use in order to better predict and explain users’ behavior to account for the changing technologies. Hence, a question is whether models of technology use and acceptance that have been developed and used in the developed world can be applied to explain Internet acceptance and use by Agriculture staff of two Universities in Ethiopia. To this end, this study applied the Technology Acceptance Model (TAM). A survey was administered to 293 agricultural faculties in Haramaya and Jimma University. The data were analyzed using Structural Equation Modeling. The result of the model indicated that the model variables explained over 59% of the variance in education and 29% variance in research. As a result, the study underlined the importance of designing intervention in the study area to support academic and research works of the staff.
Key word: Technology acceptance model, Ethiopian higher education, internet, Africa.
INTRODUCTION
Many universities have realized the centrality and benefits accrued from the development and usage of the ICT in research and education (Altbach, 2009; Oyelaran and Adeya, 2010). ICT resulted in new ways of teaching and learning, research and development, and acquiring and disseminating knowledge (Moges, 2014). The ICT infrastructures in the Ethiopian HLIs are mainly established to provide access to the Internet for users like Agriculture faculties. Hence, most faculties and researchers are provided with access to the Internet. The common understanding among the university top management, the Internet Service Provider (ISP) and other government stakeholders is that it is predominately used to enhance education and research. Studies in some African HLIs, have shown that faculties Internet use to support education and research is not as to the expectation of education planners as they are less inclined to use the Internet in their work (Derek and Philipp, 2009; Park et al., 2009; Oyelaran and Adeya, 2010). This phenomenon, has created the need to better explain Internet use behavior of faculties. This study attempted to fill the gap by examining behavior of agricultural faculties based on an extensively used theoretical framework called technology acceptance model which has been used in studying technology usage. Hence, propose a model that best describes use and acceptance Internet in the study area.
Conceptual framework
Technology Acceptance Model (TAM) (Davis et al., 1989) is one of the most researched theoretical framework for measuring users behavioral intention or/ and usage of technologies such as the Internet, e-learning, etc. Following the conceptualization of the TRA, technology acceptance model concerns the factors that affect behavioral intention and usage of information in computer-mediated systems, which is presumed to be caused by two constructs - perceived usefulness and perceived ease of use. According to TAM, one’s actual usage of a technology system is influenced directly or indirectly by the users’ behavioral intentions, perceived usefulness of the system, and perceived ease of the system (Davis et al., 1989). Plethora of studies on TAM has demonstrated that it is a valid, robust and powerful model.
Technology Acceptance Model, is not only robust but parsimonious theory, and it is useful to explain a particular information system or technology usage (HU, 2006; Chen et al., 2011). Therefore, lots of studies have extended the original Technology Acceptance Model to well address their own Information system study requirements notably to better explain behavioral intention and/or usage of technology. Technology Acceptance model based studies can be used to measure usage behavior and/or behavior intention (Judy and Lu, 2008). However, it is vital to make decision on the time horizon of the study (Kripanont, 2007). This decision will in turn logically affect the nature of the study. Studies which applied TAM based studies are found to be either longitudinal study (usually data collection is conducted more than once), just before and after new technology is introduced, in order to measure both behavioral intention and usage or it could be cross-sectional studies (data is collected just once), to measure either behavioral intention or usage of technology (Yih et al., 2011).
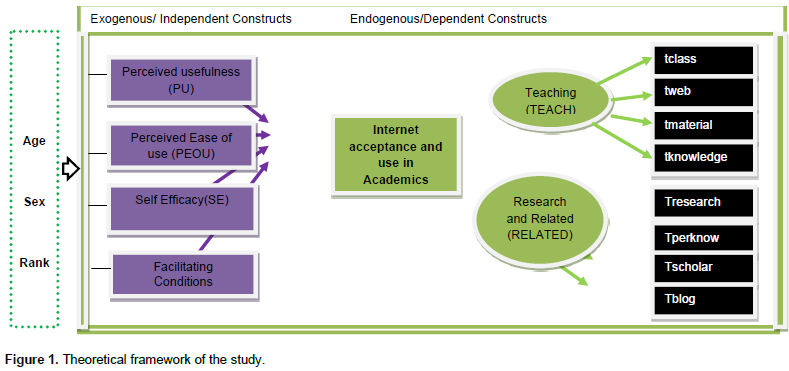
The theoretical framework (proposed research model) of the study is based on TAM and adapted from Venkatesh and Davis (2000) and Kripanont (2007). As shown in Figure 1, the proposed model has four exogenous/independent constructs (self efficacy, perceived usefulness, and perceived ease of use and facilitating conditions) and two endogenous dependent constructs. One of the endogenous construct in the theoretical framework (Figure 1) is Internet usage in education and education related activities (TEACH). The TEACH construct puts in a nutshell the agricultural faculties Internet usage for: education in classes, providing a personal web base for facilitating teaching, preparing education materials and enhancing education knowledge. The other endogenous construct of the framework is Internet usage in research and research related activities (RELATED).Similarly, the RELATED construct is the sum of four variables, Internet usage for searching information for research, enhancing research knowledge, searching scholarship (research funds and sharing research work). As shown in Figure 1, the theoretical framework also has demographic variables that may directly affect the independent constructs and indirectly affect the dependent constructs. However, investigation of the demographic variables is not the focus of this study. Theoretical constructs were formed using validated items from prior researches.
Constructs
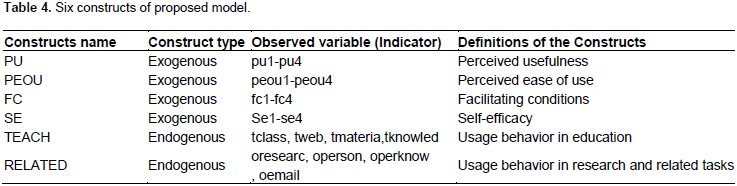
Four exogenous/ independent constructs and two endogenous/dependent constructs were used in the study. Observed Variables used in measurement of these construct PU, PEOU, FC, TEACH and RELATED construct are defined in Appendix 1.
Dependent constructs
Perceived usefulness (PU)
Perceived usefulness refers to the degree to which a person believes that using technology will enhance his or her job performance (Davis et al., 1989). Person’s tendency to use or not to use technology is influenced by his/her belief on the extent to which using technology would enhance job performance. This includes decreasing the time for doing the job, and achieving more efficacy and accuracy (Teo, 2009).
Perceived ease of use (PEOU)
Perceived ease of use (PEU) refers to the degree to which a person believes that using a particular technology will be free of effort (Davis et al., 1989). Users may believe that technology is useful, they may be, but at the same time, perceive it to be too difficult to use, and that the benefits of usage do not justify the amount of effort needed to use the technology (Davison and Tatnall, 2003; Augusto, 2010; Kwak, 2011).
Facilitating conditions (FC)
Facilitating conditions are defined as “the degree to which an individual believes that an organizational and technical infrastructure exists to support the use of the system” (Venkatesh et al., 2003). In other words, the facilitating conditions can be those fulfilled by universities in providing faculties with the basic knowledge, necessary resources and assistance while the faculties are using Internet for education and research.
Self-Efficacy (SE)
Self-efficacy is related to perceived ability. It is the belief that one has the capability to perform a particular behaviour (Ajzen, 1991). Self Efficacy is one of a significant predictor of computing behaviour which plays an important role in determining a person’s behavioural intention and/or use behaviour (Hwang and Yi, 2002; Hwang and Yi, 200; Raafat and Dennis, 2009).
Dependent constructs
The dependent constructs of the study are Internet use of the agricultural staff in their academic works. A number of researchers, measured only usage as the key dependent variable (Shih, 2004, Fetscherin and Lattemann, 2008; Ramayah et al., 2009; Šumak et al., 2009). The major academic works in higher learning institutions are related to education and research. Thus, this study has two key dependent variables namely, Internet use for education and related activities (TEACH) and Internet use for research and research related activities (RELATED). The observed variables used to measure these dependent constructs, TEACH and RELATED are described in Appendix 1. The Items used to measure both TEACH and RELATED constructs were adopted from Kripanont (2007).
Hypotheses
The proposed hypotheses of this study are presented here:
H1a: Perceived usefulness (PU) has significant influence on usage behavior in teaching.
H2a: Perceived Ease of Use (PEU) has significant influence on usage behavior in teaching.
H3a: Facilitating Condition (FC) has significant influence on usage behavior in teaching.
H4a: Self Efficacy (SE) has significant influence on usage behavior in teaching.
H1b: Perceived usefulness (PU) has significant influence on usage behavior in research and related.
H2b: Perceived Ease of Use (PEU) has significant influence on usage behavior in research and related.
H3b: Facilitating condition has Significant influence on usage behavior in research and related.
H4b: Self Efficacy (SE) has significant influence on usage behavior in research and related.
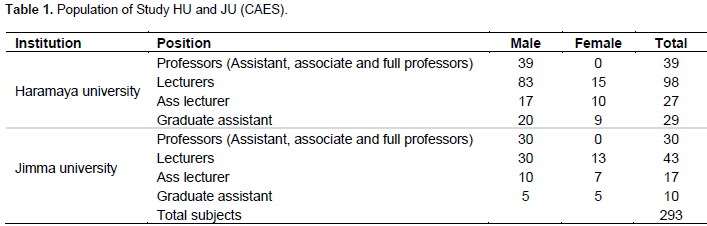
Table 1 demonstrates characteristics of the population based on sex and study area.Hence, 65 % of the sampled population is from Haramaya University and the remaining 35 % is from Jimma University.
RESEARCH METHODS
In this study, subject (unit) of analysis is an individual agricultural staff in the Universities. The total population size of the study is only 293. Thus, this study uses purposive sampling technique known as population sampling to examine the entire population. Population sampling is recommended in small populations in order to achieve accuracy (Morris et al., 2004). This study employed survey method to collect data from a total sample population of 310 in the study area. From the sampled population, only 293 of faculties returned the survey. Hence, the response rate of the survey is 94%. The questionnaire used in this study includes measures of items/variables to be studied, including, perceived usefulness, perceived ease of use, self-efficacy, facilitating condition. The measurement items used in this study were adopted from prior published studies (Kripanont, 2007; Wangpipatwong et al., 2008; Yih et al., 2011). The items required were five-point likert-style responses which are, 1= strongly disagree 2= slightly disagree 3= neutral, 4= slightly agree and 5= strongly agree.
Reliability of the research instrument
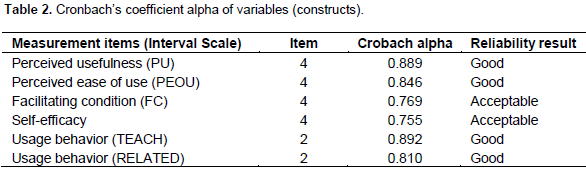
The data collection instrument (questionnaire) used in this study was tested by randomly selecting 30 (15 from each University) from three departments (Animal Science, Agricultural Economics and Rural development and Agricultural Extension) of College of Agricultural and Environmental Sciences. During the testing of the questionnaire, essential amendments were made on such things as ordering and wording of questions, and few questions were simplified and rewritten in the final version of the survey. The instrument also was further tested for reliability and validity. This study used the most popular test of inter-item consistency reliability that is the Cronbach’s coefficient alpha (Deng, 2010). This is a test of the consistency of respondents’ answers to all the items in a construct. Table 2, presents the Cronbach’s coefficient alpha for the 30 test cases. According to Polit and Beck (2003), reliabilities less than 0.6 are considered to be poor, those in the 0.7range, was acceptable, and those over 0.8 was good. The closer the reliability coefficient gets to 1.0, the better. The statistical package SPSS 15.0 for Windows was employed for conducting the test analysis.
Methods of data analysis
Data analysis procedures of this study employed descriptive statistics and a model (Structural Equation Modeling). Descriptive statistics are important to have clear picture of the characteristics of the sample units. On the other hand, Structural Equation Modeling (SEM) approach is used to address the overall objective of the study that is, proposing a model of staff Internet acceptance and use in the study area.
The proposed model of the study is relatively complex as each of the endogenous construct depends at least on four observed variables (indicators) and the endogenous constructs in turn depend on the exogenous constructs. The structural equation modeling procedure helps to test the proposed model as a whole for the set of relationships between observed variables (indicators), endogenous constructs/variables and exogenous constructs/variables. This study has used two computer programs for data analysis. Statistical Package for the Social Sciences (SPSS) version 15 was used for descriptive data analysis and Analysis of Moment Structure (AMOS) version 18 was used for data analysis using SEM.
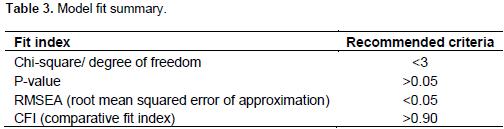
Model fit is concerned about how well the model reproduces the sample data. It is measured by evaluating several model fit indices. In this study, four measure of fit index were used: Chi-square/ Degree of Freedom, P-value, GIF (goodness-of-fit-index), RMSEA (root mean squared error of approximation), CFI (Comparative Fit Index). The model fit measures used in this study are summarized in Table 3.
Table 4 depicts major constructs of the study. Four of the constructs (PU,PEOU, FC,SE) are exogenous and the remaining two(TEACH and RELATED) are endogenous.
Chi-square/ Degree of freedom equation
If Z1, ..., Zk are independent standard normal random variables, then the sum of their squares,

Is distributed according to the chi-squared distribution with k degrees of freedom. This is usually denoted as:
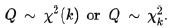
The chi-squared distribution has one parameter: k - a positive integer that specifies the number of degrees of freedom (that is, the Q = ∑ i = 1 k Z i 2 , {\displaystyle Q\ =\sum _{i=1}^{k}Z_{i}^{2},} number of Zi’s). In this study, the model fit indexes described are used to provide information about how well the model fits the data. However, the strength of the structural paths in the model is determined by squared multiple correlations (SMC). Q ∼ χ 2 ( k ) or Q ∼ χ k 2 . {\displaystyle Q\ \sim \ \chi ^{2}(k)\ \ {\text{or}}\ \ Q\ \sim \ \chi _{k}^{2}.} The chi-squared distribution has one parameter: k - a positive integer that specifies the number of degrees of freedom (that is, the number of Zi’s).
RMSEA: Root mean square error of approximation equation
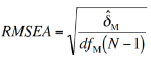
dï€ = degree of misspecification of the model, N=Sample size.
CFI (comparative fit index) Equation
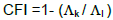
The value of L for a given model can be estimated as T – d.
Reliability and discriminant validity analysis
Structural equation modeling was used to measure the proposed model constructs reliability using Squared Multiple Correlations (SMC).The SMC is referred to as an item reliability coefficient. It is the correlation between a single indicator variable and the construct it measures (Ullman, 2006).
The SMC for an observed variable is the square of the latent construct standardized loading (Aggorowati et al., 2012). The SMC of a good observed variable should exceed 0.50 although, a SMC of 0.30 indicates an acceptable indicator variable (Kin, 2011). Accordingly, this study uses a SMC of 0.5 as criteria for choosing observed variables. On the other hand, discriminant validity test of the study was conducted by evaluating sample correlation matrix result generated from the proposed model constructs. In addition, standardized residual is used for further conducting discriminant validity. The residual covariance between two indicators is the difference between the sample covariance and the model-implied covariance. It is recommended that with a correct model, most standardized residuals should have an absolute value less than 2 (Engel and Moosbrugger, 2003).
The descriptive results are useful to provide characteristics of sample unit. As to the demographic characteristics of staff, about 83% of the sampled agricultural staff in the Universities was male and the remaining 17% were female. Substantial numbers of faculties were in the age range of 20 to 29 years (36%), about 26.7% were in the range of 30 to 39 years, and 26.9% were in the range of 40 to 49 years, while about 9.3% were 50 years up. This indicates that most staff in the colleges is young (63%), age between 20 and 39. The other important demographic variable was academic rank, and the sampled result shows that most faculties have academic rank of Lecturer (50%), Graduate Assistant (GA) and Assistant Lecturer (29%), Assistant professors (15%), Associate professors (3 %) and full professors (2%). Clearly, frequency distribution of the academic positions, shows that there are fair numbers of staff (20%) with academic qualification of PhD or more which requires attention by the Universities management to prioritize PhD education in their staff development plan.
RESULTS
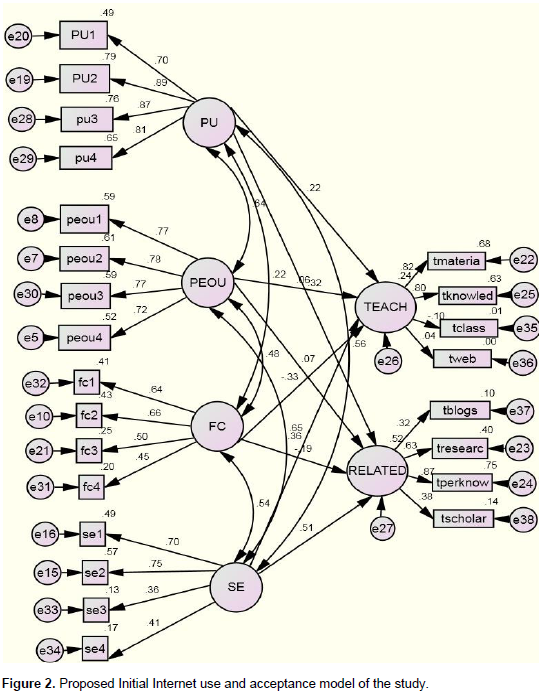
Internet acceptance and use model generation
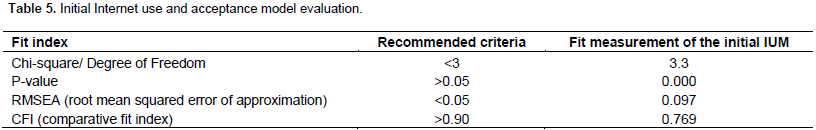
The proposed theoretical framework consists of a total of six latent construct (Perceived Usefulness (PU), Perceived Ease of Use (PEOU), Facilitating Conditions (FC), Self Efficacy (SE), Internet Usage In Education (TEACH) and Usage in research and Related activities (RELATED) each construct is measured with at least four observed variables. In the diagram (Figure 2) the values attached to one-way arrows (or directional effects) are regression coefficients, whereas, two-way arrows (non-directional relationships) are covariance comprising the parameters of the model. The regression coefficients and correlations indirectly measure the strength of the relationship between the variables. The next step is to test whether the initial model can properly represent the sampled population using model fit measurements notably, chi square/degree of freedom, P value, RMSEA (root mean squared error of approximation) and CFI (comparative fit index). Hence, the fit measurement of the initial model and the recommended criteria is presented in Table 5. Table 5 demonstrated that model fit measurement results of the model do not fulfill the recommended criteria. Hence, the proposed initial model is unable to properly represent the acceptance and use of the sampled agricultural faculties. Thus, it is deemed necessary to re-specify the model to come up with a new model that best fit the sampled data. The first step is to investigate measurement models to ensure that the indicators measure each of the constructs adequately (Deng, 2010). In reliability and validity analysis using structural equation modeling, it is agreed that reliable results would be obtained if number of constructs under investigation does not exceed five constructs (Ullman, 2006; Suki, 2011). Therefore, in this study, the four exogenous construct (independent constructs) and the two endogenous constructs (dependent constructs) were investigated separately.
Constructs reliability
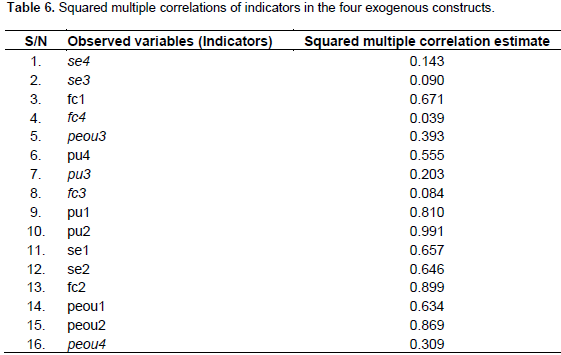
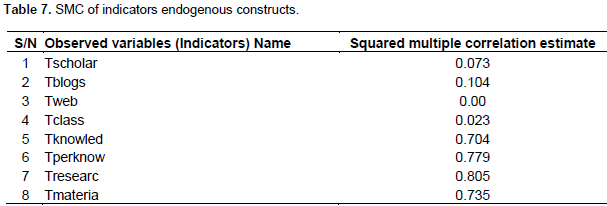
Reliability captures the degree to which a set of measures indicate common latent construct (Jarvis et al., 2005). It is the correlation between a single observed variable and the construct it measures (Kin, 2011). The SMC of a good observed variable should exceed 0.50 (Jarvis et al., 2005; Aggorowati et al., 2012). The square multiple correlation estimates of most of the variables in the four exogenous latent constructs (PU, PEOU, SE and FC) exceeded 0.5 (Table 6). There are also variables with square multiple correlation estimates of less than 0.5. The square multiple correlation of a reliable observed variable should exceed 0.50. Therefore, the highlighted seven variables in pu3 =0.203, peou3= 0.393, peou4=0.309, se4=0.143, se3=0.090, fc3=0.084 and fc4=0.039, are found to be unreliable measure of the constructs and removed from further SEM analysis in order to improve the mode fit. The remaining nine indicators, with SMC value of exceeding the minimum threshold value of 0.5, are presumed to be reliable measure of the constructs and considered for further SEM analysis. The definitions of all variables in the two endogenous constructs were also presented in Chapter Three. Four variables Tknowled, Tperknow, Tresearc, Tmaterial have SMC exceeding 0.5 and the remaining four, Tscholar = 0.073, Tblogs = 0.104, Tweb = 0.000, Tclass = 0.023 have SMC of less than 0.50 which indicate that they are not reliable measure of constructs. Thus, the variables were removed from further SEM analysis in order to improve mode fit. The remaining four indicators, with SMC value of exceeding the minimum threshold value of 0.5, are presumed to be reliable measure of the two endogenous constructs and considered for further SEM analysis (Table 7).
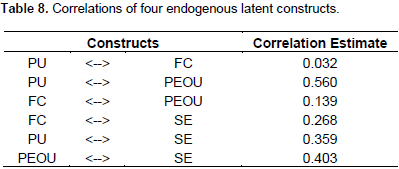
Large correlations between latent constructs, greater than 0.80 or 0.90 suggest a lack of discriminant validity (Kripanont, 2007; Kin, 2011). Structural Equation Modeling Techniques can also be used to estimate discriminant validity (Kenny, 2011). It reflects the extent to which the variables in a model are different. Thus, in this study, validity test of constructs were conducted using SEM. As shown in Table 8, there was no lack of discriminant validity, as the correlations between the exogenous latent constructs were less than the recommended value of 0.8. Moreover, in order to avoid multicollinearlity of variables (it happens when two variables measure the same thing), prior to studies recommended to remove observed variables from SEM analysis, the value of sample correlation between two indicators or constructs exceeds 0.80 (Jarvis et al., 2005 and Ullman, 2006).
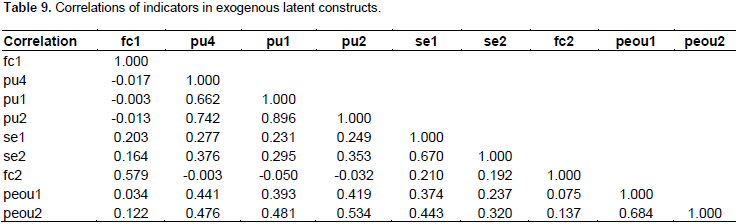
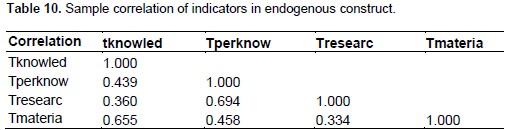
Therefore, validity tests on the indicators of exogenous and endogenous constructs were performed respectively. Table 9 presented sample correlations of variables in the PU, PEOU, SE, FC constructs. From the sample correlation table, one can see that the values of all pair of indicators had a value of less than 0.8 except the pair between pu1 and pu2. Clearly, the remaining eight variables did not measure the same thing or avoided the issue of multicollinearlity. Therefore, pu1 was removed from further analysis and the other eight variables remained untouched for further SEM analysis. Sample correlation of the remaining variables in the two endogenous latent, constructs Internet usage in education activities (TEACH) and Internet usage in research and related activities (RELATED). The sample correlation result, verified that that the values of all pair of variables had a value of less than 0.8. In other words, there was no issue of multicollinearlity in the sample correlation table. Therefore, these four variables in the endogenous constructs remained unchanged for further SEM analysis. In discriminant validity analysis, the next step is to investigate a standardized residual covariance between two indicators. It is recommended that with a correct model, most standardized residuals should have an absolute value less than 2 (Engel and Moosbrugger, 2003). Table 10 presented sample correlations of variables in the TEACH and RELATED constructs. From the sample correlation table, it is vivid that values of all pair of indicators had a value of less than 0.8 hence, the issue of multicollinearlity is avoided.
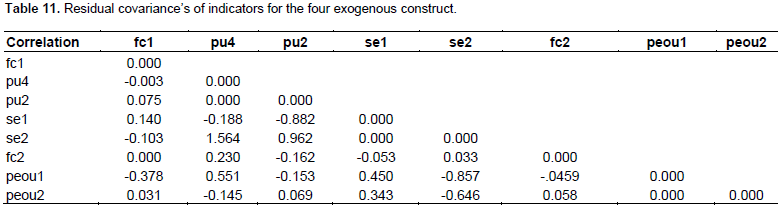
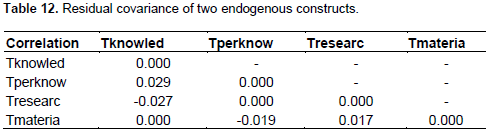
The residual covariance between two indicators is the difference between the sample covariance and the model-implied covariance. Standardized residual covariance of indicators which are in the four exogenous constructs after pu1 was removed due to lack of discriminant validity. As it is evident on the Table 11, there were no pairs of variables which had standardized residuals of more than the recommended absolute value less than 2. Thus, these eight variables aforementioned remained unbothered for further SEM analysis. Table 12 illustrates the standardized residual covariance of variables in the two endogenous constructs. It showed that there were no pairs of variables which had standardized residuals, more than the recommended absolute value less than 2. Thus, the four variables presented above were also remained unchanged for further SEM analysis.
In order to further improve the Initial Internet use and acceptance model that fit and generate the new model, data analysis was made by investigating the modification indices in AMOS which could help to further improve the model that fit the data. Accordingly, the path between SE and RELATED was highly insignificant (0.008) and was permanently deleted from the SEM analysis. In addition, it also showed that there was a highly significant relationship between TEACH and REATED construct, and a new regression line is drawn to improve the final Internet use and acceptance model fit to the data. The final model is presented. Internet use and acceptance model (Figure 3), the model included the four exogenous latent constructs: PU = Perceived Usefulness, PEOU = Perceived Ease of Use, FC = Facilitating Conditions and SE = Self Efficacy. Two Endogenous Latent Constructs: TEACH = Internet usage in Education and related activities, RELATED= Internet usage in research and related activities. The single head arrow have path coefficient leading to the dependent constructs and letter e’s represents error terms. The double headed arrows represent covariance of constructs.
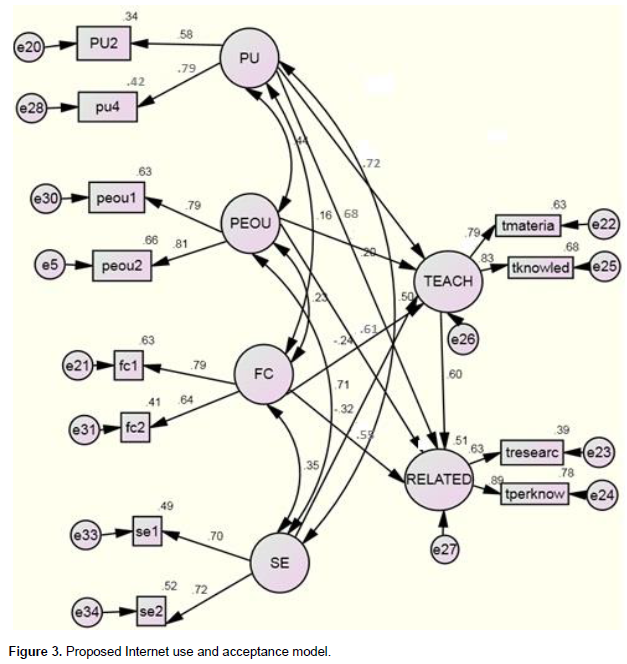
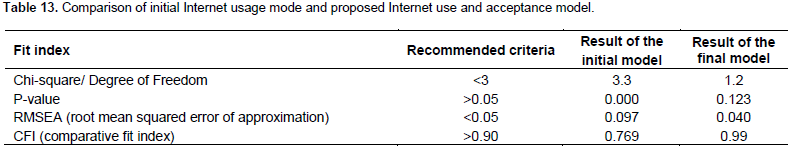
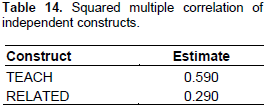
In the diagram (Figure 3) the values attached to one-way arrows (or directional effects) are regression coefficients whereas two-way arrows (non directional relationships) are covariance comprising the parameters of the model. The regression coefficients and correlations indirectly measure the strength of the relationship between the variables. The model provides an opportunity to investigate the strength of relationship between and among its structural model and measurement model. The final modified model in Figure 3 yielded a chi-square/degree of freedom = 1.2, P- value = 0.123 (p value = 0. 123 which was not significant at the level of 0.05), RMSEA = 0.040 and CFI = 0.99, indicating that the model fits the data very well. The models fit measurement summary in Table 13, the initial model had improved significantly. Moreover, the new model fit the data well as it satisfied the four recommended model fit measurement of the study. Therefore, the final Internet use and acceptance model could be used to test the proposed hypothesis of the study. The strength of the structural paths in the model is determined by squared multiple correlations (SMC)(David et al., 2000; Almarashdeh et al., 2010). Thus, variance of TEACH and RELATED could be explained by PU, PEOU, FC and SE. Table 14 demonstrated that the independent constructs account for 59% of the variance in TEACH and 29% of the variance in RELATED.
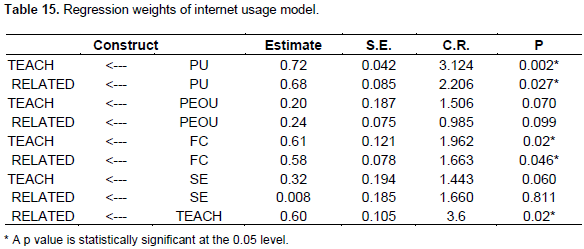
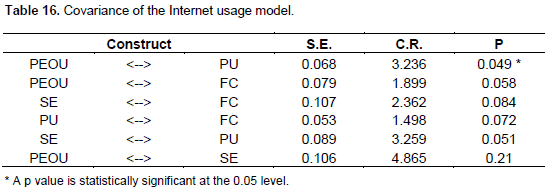
The independent constructs (PU, PEOU, FC, and SE) account for the variance of dependent variables, with a reasonable (30.3%) explanation for variance Internetusage in research and related activities (RELATED) and a high degree(59%) of explanation for variance Internet usage in education activities (TEACH) (Table 15). The standardized regression weights are used since they allow to compare directly the relative effect of each independent construct on the dependent. Accordingly, perceived usefulness (PU) and facilitating conditions (FC) significantly affect Internet usage in teaching, research and related activities. On the other hand, Perceived Ease of Use and Self Efficacy do not significantly affect Internet usage in teaching, research related activities. In other words, the higher the level of perceived usefulness, facilitating condition towards using the Internet by agricultural faculties, the higher the extent of the Internet usage in teaching. Concurrently, the higher the level of perceived usefulness of the Internet and facilitating conditions for using the Internet, the higher the extent of the Internet usage for research and related activities of agricultural faculties in the study area. The covariance of the Internet use and acceptance model in Table 16 indicated that PU and PEOU are related in positive direction and SE and PEOU are also associated in a positive direction. In simple words, the higher the perception of Internet usefulness (PU) among agricultural faculties in their academic work, the greater their perception that it is easy to use (PEOU). Similarly, improved Internet usage ability of agricultural faculties could equally improve their perception that Internet is easy to use both for education activities and research related activities.
DISCUSSION
Similar to earlier studies (Lee et al., 2005; Saadé et al., 2007), this study confirmed TAM to be a useful theoretical model in helping to understand and explain the use of the Internet in teaching and research activities.
This research led to the conclusion that the model well represented the collected data according to the result of goodness-of-fit test. The results of this study revealed that Perceived Usefulness (PU) had significant positive effect on internet use. This indicates that faculty members place emphasis on the envisaged benefits (accomplish tasks more quickly, enhance the quality of my work, easier to do my work). Also, the study indicated that facilitating condition had significant effect on faculty member’s use of the Internet. These findings are in line with studies that reported several system issues like: suitability of design in screen and system, easiness of course procedure, interoperability of system, easiness of instruction management and appropriateness of multimedia use, flexibility of interaction and test, learner control (Fathema and Sutton, 2013; Kim and Leet, 2008; Weaver et al., 2008).
The result also depicted that not all of the independent constructs in the Internet use and acceptance model significantly explained usage behavior of agricultural faculties. In addition, it was also identified that the independent constructs capabilities in explaining the variance of usage behavior in education and related activities (TEACH) were higher than in research and related tasks (RELATED). The independent constructs (PU, PEOU, FC, and SE) account for 59% of the variance of Internet usage behavior in education (TEACH) and, 29% of the variance of Internet usage behavior in research and related activities. The most important determinants (independent constructs) for usage behavior (TEACH) were PU, FC with their P value being statistically significant at the 0.05 level. The important determinants for usage behavior in research and related activities (RELATED) were also PU and FC with their P value being statistically significant at the 0.05 level. Finally, Internet use and acceptance model that represented agricultural faculties’ usage behavior had been generated. However, this model should be further investigated to find out whether the moderators including age, sex, academic rank, and experience affect the influence of PU, PEOU, FC and SE toward Internet usage behavior of faculties.
CONFLICT OF INTERESTS
The author has not declared any conflict of interest.
REFERENCES
|
Altbach PG, Reisberg L, Rumbley LE (2009). Trends in Global Higher Education: Tracking an Academic Revolution, A Report Prepared for the UNESCO 2009 World Conference on Higher Education. |
|
|
Aggorowati MA, Iriawan NS, Gautama H (2012). Restructuring and Expanding Technology Acceptance Model Structural Equation Model and Bayesian Approach. JMIS.7(3):12-34. |
|
|
Almarashdeh IA, Sahari N, Zin ZM (2010). The Success of Learning Management System Among Distance Learners in Malaysian Universities Based on TAM. J. Theoretical Appl. Infor. Technol. 21(2):23-38. |
|
|
Chen L, Macredie R (2010).Web-based interaction: a review of three important human factors. Int. J. Infor. Manage. 3(2):2-3. |
|
|
Chen SC, Li SH, Li CY (2011). Recent Related Research in Technology Acceptance Model: A Literature Review. Aust. J. Bus. Manage. Res. 1(9):124-127. |
|
|
David,G.,W.Detmarand B.Marie-Claude, 2000.Structural equation modeling and regression: guidelines for research practice. J. Infor. Syst. 4(7):12-16. |
|
|
Davis FD, Bagozzi RP, Warshaw PR (1989). User Acceptance of Computer Technology: A Comparison of Two Theoretical Models. J. Manage. Sci. 35(8):982-1003. |
|
|
Deng J (2010). Reliability and validity of the sit-to-stand navicular drop test: Do static measures of navicular height relate to the dynamic navicular motion during gait? J. Student Phys. Therapy Res. 2(1). |
|
|
Engel KS, Moosbrugger H (2003). Evaluating the Fit of Structural Equation Models: Tests of Significance and Descriptive Goodness-of-Fit Measures. Methods Psychol. Res. Online. 8(2):23-74. |
|
|
Fathema N (2013). Structural Equation Modeling (SEM) of an extended Technology Acceptance Model(TAM) to report web technology adoption behavior in higher education institutions (Ph.D thesis). |
|
|
Farrell G, Shafika I (2007). Survey of ICT and Education in Africa: ICT Report Based on 53 Country Surveys. 2(1):45-54. |
|
|
Fetscherin M, Lattemann C (2008). User Acceptance of Virtual Worlds. Report designed by Second Life Research Team An Explorative Study about Second Life. Rollins College, University of Potsdam. 7-12. |
|
|
JarvisCB, SB, Mackenzie, Philip M (2005). Misspecification in Marketing and Consumer Research: Critical Review of Construct Indicators and Measurement Model. J. Consum. Res. 30(2):199-218. |
|
|
HU (2006). Haramaya University Facts and Figures Bulletin. |
|
|
Judy CL, Lu H (2008). Towards An Understanding of the Behavioral Intention to Use a Web Site. Int. J. Infor. Manage. 20(3):197-208. |
|
|
Kenny DA (2011). Measuring Model Fit. J. Infor. Syst. Res.1(9). |
|
|
Kim SW, Leet MG (2008). Validation of an Evaluation Model for LMSs. J. Comp. Assisted Learn. 24(4):284-294. |
|
|
Kin HS (2011). The Importance of Training Evaluation using SEM: The Case of Malaysian Public Hospitals. J. Infor. Syst. 32(2):17-33. |
|
|
Kripanont N (2007). Using technology acceptance model of Internet usage by academics Within Thai Business Schools. PhD Thesis, Victoria University. |
|
|
Morris ED, Rosenbluth D, Watson F (2004). Statistical methods in Select Sample in Small Population. Canad. J. Stat. 95(1):74-78. |
|
|
Planning Office (2012). Haramaya University Planning Office. Unpublished Report. |
|
|
Polit DF, Beck CT (2003). In Nursing Research: Principles and Methods. 7th Edition, Philadelphia press. USA. pp. 413-444. |
|
|
Ramayah T, Muhamad J, Ismail N (2009). Impact of intrinsic and extrinsic motivation on Internet usage in Malaysia. J. MIS Q. 27(1):25-37. |
|
|
Shih HP (2004). Extended Technology Acceptance Model of Internet Utilization Behavior. J. MIS Q. 30 (4):50-70. |
|
|
Suki N (2011). Exploring the Relationship Between Perceived Usefulness, Perceived Ease of Use, Perceived Enjoyment, Attitude and Subscribers' Intention Towards Using 3g Mobile Services. J. Infor. Technol. Manage. XXII(1):13-31. |
|
|
Šumak B, HeriÄko M, Pušnik M, PolanÄiÄ G (2009). Factors Affecting Acceptance and Use of Moodle: An Empirical Study Based on TAM. J. MIS Q. (27):91-100. |
|
|
Ullman JB (2006). Structural equation modeling Using Multivariate Statistics. 4th Edition, Bombay, Inida. 653-771. |
|
|
Venkatesh V, Morris MG, Gordon B, Davis FD (2003). User Acceptance of Information Technology: Toward a Unified View. MIS Q. 27(3):425-478. |
|
|
Moges B (2014). The Role of Information and Communication Technology (ICT) in Enhancing the Quality Education of Ethiopian Universities: A Review of Literature J. Educ. Res. Behav. Sci. 3(8):246-258. |
|
|
Yih MB, Syakira W, Hissan M, Ch'ng PE (2011). Developing a Mobile Curriculum Vitae Using Weblog: A Cross-disciplinary Survey on University Students' Perception Based on Technology Acceptance Model. |
|
|
Wangpipatwong S, Chutimaskul W, Papasratorn B (2008). Understanding Citizen's Continuance Intention to Use e-Government Website: a Composite View of Technology Acceptance Model and Computer Self-Efficacy. |
|
|
Weaver D, Spratt C, Nair C (2008). Academic and student use of a LMS: Implications for quality. Australasian J. Educ. Technol. 24(1):30-41. |
|
Copyright © 2024 Author(s) retain the copyright of this article.
This article is published under the terms of the Creative Commons Attribution License 4.0


