Full Length Research Paper

ABSTRACT
Most water utilities lose significant amounts of water in their distribution systems due to leakages, illegal consumption or accounting errors. These water losses are referred to as Non-Revenue Water (NWR) by the International Water Association. Efforts to reduce water loss levels are centered on the socioeconomic aspect (efficient water provision and profit maximization) while overlooking the environmental aspects because the effects are subtle; hence it is difficult to quantify or ascertain. This study examined the effects of non-revenue water on water quality, quantity and the general environment through purposive sampling of Key informants, Focus Group Discussion and desk review methods. The findings indicated a significant positive correlation between physical water losses and water quality parameters (p-value <0.05, rho=0.872); commercial losses had a moderate but positive correlation at P < 0.05, rho=0.432. Further results revealed that from May through October 2019, Kisumu Water and Sewerage Company lost approximately 158,500 cm3 equivalent to 31.17% water loss. Water loss was found to also affect environmental components such as land and soil leading to pollution and degradation. The study recommends the need for bridging the gap between the existing water resources management strategies and their implementation through further studies, capacity building and technological advancements.
Key words: Non-revenue water, water quality, water quantity, water loss, environmental effect.
INTRODUCTION
Water makes up approximately 70% of the earth and is one of the most essential natural resources that interconnect the earth’s natural system processes and it is indispensable to sustaining life (Baker et al., 2016). In 2010, the United Nations acknowledged water that is sufficient, safe, acceptable, physically accessible and affordable as a basic human right; however, this is usually not the case as some parts of the world still experience acute water shortage due to climate change, poor infrastructure maintenance, population growth, lack of funds and inadequate management making it difficult to extract, treat and distribute this water to consumers. Aside these sets of challenges, the water utilities tasked with the mandate of efficient water provision often experience high levels of water loss that derails their efforts towards meeting the consumers’ demands and conservation of water and its related resources (Frauendorfer and Liemberger, 2010). These water losses are often referred to as Non-Revenue Water by the International Water Association and it is a vital indicator of the performance and management efficiency of water utilities (Donkor et al., 2014). The lack of a standardized definition to represent water loss has been criticized over the years making The International Water Association to come up with a recommended international standard water balance with clear definitions of the components of non-revenue water. The water balance technique is vital for water utilities to be able to track their entire distribution systems and discover where, why and how the losses are occurring (AWWA, 2019).
The water balance described by IWA basically revolves around the system input which is the total amount of water put into the distribution system. The system input is further Classified into two 1) Authorized consumption that has two components; billed and unbilled authorized consumption where - billed (metered and unmetered) results into revenue and unbilled (metered and unmetered) describes a situation where water usage is authorized but not charged such as fire hydrants and other public services. Although this unbilled authorized consumption contributes to the amount of water that is lost, it is not usually characterized as non-revenue water by IWA. Authorized consumption is therefore described by IWA as the amount of water which was used for its intended purposes. 2) Water losses which contribute the most to NRW. These water losses are further divided by IWA into i) Apparent/ commercial losses where water is found to have got to the end-user but there was no payment for it probably due to meter inaccuracies or outright water theft along the distribution line. 2) Physical/ real losses which include overflow of the main storage tanks and pipe burst/leakages in the main distribution network up to consumers’ meter as indicated by Kingdom et al. (2006).
Water utilities around the world lose 35% of the water they produce on average but the level in some developing countries sometimes is recorded at 50-60% (USAID and WBI, 2010). A recent study by Liemberger and Wyatt (2019) indicated that the level of water loss has been constantly increasing over the years and is now at 346million m3 and 126million m3 for physical and commercial losses respectively. In Africa however, 45 million m3 of water is lost through pipe bursts/leakages per day while 16 billion m3 is lost due to water theft (commercial losses) (USAID and AfWA, 2015; USAID and WBI, 2010). In Kenya, the average level of NRW for major towns is 45% and it is, therefore, the National Water Service’s aims to provide strategies that will help in reducing NRW to under 30%; whereas the Kenyan vision 2030 however aims to reduce it to under 25% using countries with a success rate of below 20% levels as the benchmark (WASREB, 2019). Despite the rapidly increasing NRW levels, some countries such as Denmark, Germany, Netherlands, Singapore and Japan have managed to reduce the rate of water loss to below 10% which Fraunderfour and Liemberger (2010) emphasize that they should be used as the benchmarks when it comes to water resource management.
Fraunderfour and Liemberger (2010) further state that most water utilities lack the basic understanding of water loss and its components which contribute to the increasing levels of water loss and enhancing their negative environmental impacts. Due to the complexity of NRW components, the International Water Association Water loss specialist Group in their effort towards describing NRW issues and the related solutions provided a document to enhance the management of water resource and reduce water losses. Their documentation on NRW reduction further states that the management of NRW requires proper understanding of the water balance, efficient analysis of physical and commercial losses, and effective pressure management that enables the formation of strategies unique to each water utility for addressing NRW.
It is however important to note that these water losses not only cause huge financial losses for the water utilities but provide avenues or channels for introducing impurities that compromise the quality of water distributed to the consumers (AWWA, 2019). Konikow and Kendy (2005) also elaborated on how continuous water losses make depletion of water resources in the future inevitable as it forces the water utilities to extract and pump more water into the distribution system; the impact of which is often felt from water utilities that extract their water from rivers, streams or underground aquifers.This paper therefore attempts to provider further insights on how these water losses interact with other environmental components and the research was underpinned by three objectives: (1) To examine how water losses affect water quality; (2) To assess the effects of water loss on water quantity, and (3) To identify and discuss other environmental components affected by water losses.
MATERIALS AND METHODS
Study area
Kisumu City is located in Kisumu County (formerly port Florence, Kisumu District, Nyanza Province) along Lake Victoria shores in Kenya. Kisumu City covers approximately 427 km2 of land 120 km2 of which is covered by water mass otherwise known as Lake Victoria. Also given that it situated on the equator, the county experiences a hot and humid climate with night temperatures dropping to as low as 18% and an average annual rainfall of roughly 1,200 mm which occurs in 2 seasons.
Data collection methods
Desk review
For purposes of qualitative analysis, the researchers used existing data provided by Kisumu Water and Sanitation Company (KIWASCO) to achieve the research objectives. The first set of data were obtained from the meter test bench at Tom Mboya (KIWASCO branch) on all issues related to meter handling; another set of data were obtained from the human resource department to supplement data collected on measures and strategies, the finance department, production and distribution, networking department and the department that deal directly with non-revenue water. Reports on water quality done by KIWASCO laboratory at Dunga beach were also obtained to draw conclusions on the effect of non-revenue water loss on water quality. Other sources of desk review included the water Act 2016 and online resources such as journals and articles on related studies.
Key Informants Interview (KII)
The researcher used semi-structured guidelines for a detailed in-depth face to face to get responses from the key informants (KII) on the status of Non-Revenue Water, how and why these water losses occur and what the water utility has done so far to curb this menace of water loss. Purposive sampling was done during the KII and the participants were voluntarily interviewed. A total of 26 people were interviewed, 16 KIWASCO staffs, 4 residents in Manyatta and Millimani, 2 water vendors, 2 chief representatives, 1 representative from Lake Victoria South Water Services Board and 1 representative from National Environmental Management Agency.
Focus Group Discussion (FGD)
Two focus group discussions were conducted with 9 and 7 participants totaling 16 participants in Kisumu City. In the FGDs there were gender and age considerations, that is, 6 male and 10 female participants in the age bracket of 18 - 65 years. Opinions from water consumers on the effects of water losses due to non-revenue water were obtained and used to supplement data from KII and desk review. Participants at the FGDs were selected voluntarily based on the participants’ consent and the discussions lasted not more than one hour. The FGDs were held in a non-intrusive environment to make the participants feel comfortable and confident during the survey.
RESULTS
Effects of non-revenue water on water quality
Water utilities’ main mandate of extraction, treatment, storage and distribution of clean and safe water basically revolves around water as a natural resource based business. This makes it the main environmental component affected in terms of Non-Revenue Water. The study therefore first started by examining how water quality is affected by these water losses. The water quality standards used to measure the fitness of water in Kenya are set by the Water Services Regulatory Board (WASREB) based on the World Health Organization guidelines. The WHO outlines the following as the main water quality parameters; turbidity, alkalinity, suspended solids, dissolved solids, hardness, residual chlorine and bacteria. Therefore, any negative changes in these parameters will compromise the quality of water. Before water is distributed to consumers it is subjected to physical treatments which involve techniques such as filtration and screening to remove the solid matter and chemical treatments through coagulation, flocculation and chlorination to remove toxic organic and inorganic compounds. KIWASCO (Kisumu Water and Sanitation Company) has two water treatment plants. The main being Dunga treatment plant which extracts its water from Lake Victoria and the other being Kajulu water filter which extracts a substantial amount of its water from river Kibos. KIWASCO then does a 2-h interval water analysis to ensure that these parameters are always at par with the WASREB recommended levels in the storage system before distribution to the consumers. An analysis of these main parameters therefore indicated that they were all within the acceptable levels implying that indeed the water distributed by KIWASCO to its consumers is of quality standard and is fit for human consumption. Table 1 shows the status of water quality parameters before distribution to the consumers.
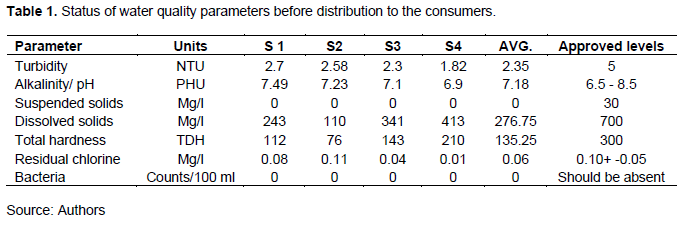
Analysis of four samples from different points of the distribution system where physical losses occurred indicated that some of the water quality parameters such as residual chlorine, turbidity, suspended solids and the amount of bacteria were well above the required limits. These findings are as stated below: -
Residual chlorine
The recommended level of chlorine by WASREB to be consumed is 0.10mg/l because chlorine is a widely used method of water purification not only by water utilities but also in the household. The water samples analyzed however indicated that residual chlorine was 0.17mg/l which does not comply with the set standards of 0.10mg/l.
Turbidity
No guidelines are provided for turbidity other than the fact that it has to be acceptable to the consumers. WASREB on the other hand recommends turbidity of not more than 5 units to be fit for consumption. The level of turbidity however can also be attributed to age and material of the pipes as corrosive pipes release iron oxides into the water thereby compromising its quality and therefore it can not only be attributed to leakages. The samples analyzed showed that the average level of turbidity was 5.64 NTU.
Suspended solids
Total solids of 30mg/l are recommended as they represent the water’s natural contact with soil, rocks and other inorganic salts. The study however found the average level of suspended solids to be 37.50mg/l indicating that it surpassed the required limits and hence consumption of this water can be harmful to the consumers over time.
Bacteriological quality
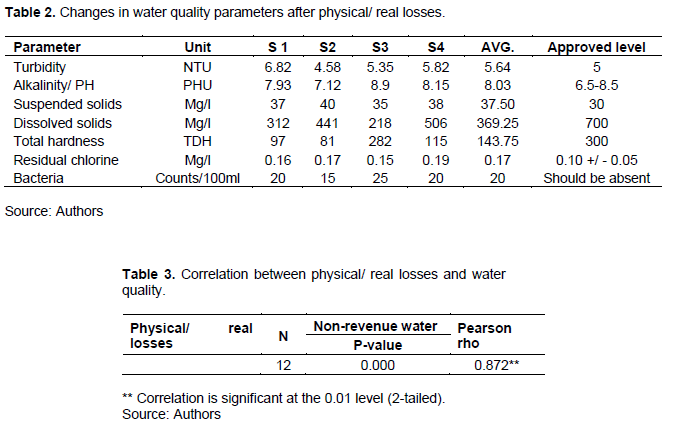
The water utility’s analyses report should indicate “no ecoli/100ml” which is the level recommended by WASREB; however the samples collected indicated the average level was as high as 20/100ml which indicated that the water was not fit for consumption as it would have serious health implications on the consumers and cause diseases such as diarrhea, anemia and urinary tract infections. These changes in water quality parameters due to physical water loss are as shown in Table 2.
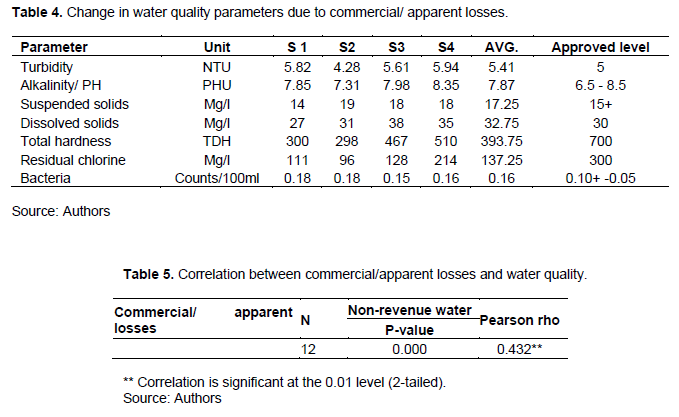
The study found that there was a significant positive correlation between physical/real losses and water quality parameters (p-value <0.05 and rho=0.872). The results of this correlation are as shown in Table 3.
Effects of apparent/commercial losses on water quality
Commercial/ apparent water losses as contributors to NRW were also investigated by the researcher to determine its effects on water quality parameters. The samples used here were taken from consumers who have illegally reconnected themselves to the network after disconnection, those who have illegally connected themselves to the main distribution channel, and those who have cases of meter tampering or vandalism and the points from which these illegal connections are connected to the main distribution system. The researcher also noted that these areas are prone to leakages because the pipes are not fitted properly or according to the standards required by KIWASCO. The findings indicated that turbidity 5.41NTU > 5, the amount of suspended solids 32.75mg/l > 30, residual chlorine 0.16mg/l > 0 and bacteria 2.75/100ml > 0/100ml were the parameters most affected by cases of apparent water losses because their units were higher than WASREB’s recommended levels (Table 4).
A Pearson's correlation coefficient computed on relationship between commercial/ apparent losses and NRW indicated that it has a moderate effect on water quality parameters (rho=0.432). Therefore, an increase in the level of commercial/apparent losses can also compromise water quality to moderate strengths. These results are as shown in Table 5.
Effects of water loss on water quantity
Water loss is one of the major factors that contribute to declining water volumes in the reservoirs especially if the source of water is streams and rivers which can sometimes be seasonal. Water loss coupled with other factors such as climate change and rapid population increase is described by the International Water Management Institute IWMI 2017) as why the world is fast approaching water crisis in the near future. The findings of this research show that in May, June, August, September and October the level of water loss in KIWASCO was recorded as 36.96, 29.41, 36.51, 28.99 and 33.33%, respectively all of which are higher than recommended levels. In July however, the level of water loss was 21.79% which was within the acceptable levels. On average, from May through October 2019, the water utility lost some 158,500m3 of water which is equivalent to a 31.17% of NRW contributing on a global scale to the 48.6 billion m3 of daily water loss as described by the World Bank. The results of these findings are shown in Figure 1.

Effects of non-revenue water on the general environment
Continued discussions in the FGDs and during the KII introduced some very interesting opinions on how these water losses aside compromising water quality parameters and reducing the volume of water (water quantity) also have effects that are visible in the general environment. These effects discussed in the FGD and KII were grouped by the researchers according to the various environmental components such as soil, land, air and the social environment.
DISCUSSION
Effects of physical losses on water quality parameters
The findings of this study indicated that the distributed water subjected to physical losses such as leakages/pipe bursts had noticeable changes in the level of residual chlorine, turbidity, suspended solids and the amount of bacteria making it unfit for human consumption. The correlation analysis between physical water losses and water quality parameters also supported these findings where p-value <0.05 and rho=0.872, indicating that an increase in the rate and amount of physical/ real losses will increase the level of parameters beyond the recommended levels, hence compromising water quality. This can also be supported by the fact that after severe pipe bursts and leakages, KIWASCO usually closes the main water valve for a period of time to allow the contaminated water to drain out and re-treat the water before distributing it to the consumers again. A similar research by Awopetu et al (2013) also indicated that turbidity, chlorine levels, suspended solids and E-coli are the most affected water quality parameters within the water utilities distribution network as a result of constant leakages. This study however indicated that the chemical and physical parameters are easier to manage as compared to the bacteriological aspect which remains to be a challenge for water utilities especially in Kisumu’s informal estates such as Nyalenda and Manyatta that are characterized by high density and poor sewerage connections. It is however important to note that the intensity of change in these water quality parameters varies depending on the duration of water loss and pressure in the distribution system as described by Fontanazza et al. (2015); they stated that when the pressure is low, instead of water being forced out through the parts of the pipe that are cracked, water from the surrounding areas like the ground water that has contaminants get sucked in and remain on the pipes until it reaches the consumer. This is owing to the fact that the materials used for and around the distribution systems may contain bacteria and viruses from human wastes. Findings by Saria (2015) emphasized on this by pointing out that pressure determines the extent to which these water losses affect water quality because when leakages occur during low pressure it provides an avenue for bacterial contaminants to be siphoned into the distribution system thereby compromising the quality of water. Similarly, the FGD participants also agreed that pipe burst/leakages have significant negative impacts on water quality where one of the discussants stated that “whenever a pipe burst occurs, the pressure with which that water is running will determine how many foreign particles will be washed away and infiltrated in the distribution channels; this also makes it easier to mix with the untreated sewer water and overflowing latrines thereby compromising water quality.” The KII however indicated that the quality can also be compromised when the pressure is high as this may corrode the distribution pipes and increase the intensity of the contaminants; the metallic taste that consumers sometimes feel/ smell when they drink tap water is as a result of this corrosion. Repairing of pipe bursts/leakages and installation of district metered area involves closing boundary valves which creates dead-ends that consequently affect the water quality. This can only be alleviated through flashing in order to restore water quality; hence the importance of warning the consumers when there is an ongoing pipe repair/ maintenance to beware of dirty water. Saria (2015) further explains that whenever there is a pipe burst/leakage, the re-installation of these pipes always make the water dirty and in some cases residents have reported noticing contaminants such as sand or charcoal from their tap water even after KIWASCO has done a flush program. At the FGD, some respondents however thought that pipe bursts/leakages had negligible effect on water quality and more on the surrounding environment. One of the discussants argued that “pipe bursts or leakages results in flooding of the immediate surrounding depending on the magnitude of the water lost. This is a major cause of pollution in urban centers and many instances of stagnant water and such situations distort the general aesthetic quality of the city”. IWA (2018) also states that the reduction in water loss can improve water quality due to less contamination and achieve environmental excellence.
Effects of commercial losses on water quality parameters
The IWA water balance describes commercial/apparent water losses as those that occur due to unauthorized consumption (illegal connection/meter by-passing/water theft) and metering inaccuracies caused by meter vandalism and meter tampering. The findings of the study indicated that the distributed water subjected to these commercial losses recorded slight changes in the water quality parameters where turbidity was higher by 0.41NTU, amount of suspended solids by 2.75 mg/l, residual chlorine by 0.16mg/l and bacteria by 2.75100 ml. Discussions in the Focus Groups supported these findings where most of the discussants argued that the reason this form of water loss affects water quality is because the consumers who practice these forms of illegal consumption have little to no knowledge on how the distribution system should look like as opposed to the trained KIWASCO engineers. This therefore, causes some consumers to end up putting their networks next to the sewer systems or making them overlap in such a way that their water is compromised because of its close proximity to the sewers, a situation described by KIWASCO as spaghetti connections. Further discussions also indicated that in cases where the consumers have attempted to connect themselves to the main distribution channel, they often do not do a proper cleaning of their pipes which may contain suspended particles. Also, sometimes, the type of materials that they use is not properly treated or is substandard and therefore reacts with the water as they are corroded by the chlorine. It is however important to note that billing/ accounting errors as a form of commercial/ apparent water loss does not affect the quality of water. Water that is lost through accounting and billing errors usually occur when water utilities miscalculate or misinterpret the information relayed by the meters and therefore does not represent the appropriate amount of water used. The KII and FGD respondents also agreed with these findings by stating that these kinds of errors are usually due to computer glitches or wrong readings and therefore have nothing to do with quality of water. These computer errors however sometimes lead consumers to using other sources of water which may not be fit for consumption or employ illegal means of accessing water. The consensus from the participants in the FGD was that the influence of this type of water loss is more on economic/ revenue and less on water quality and the environment. The KII informants on the other hand argued that some of the accounting/ billing errors are caused by corrupt staff who colludes with consumers to tamper with the meters by introducing impurities or boiling the water meters in order to miscalculate the actual readings. Therefore these crude methods were described as ways that could provide avenues for contaminants to get into the water. This in result interferes with the water quality parameters at the reading points which could still be harmful to the consumers.
Effects of water loss on water quantity
The World Bank report stated that water loss of 21-60% could otherwise be used to serve populations that do not have access to water and that the world water demand in the near future will be higher than the supply by at least 40% leading to an increase in the number of unserved population. Furthermore, WASREB recommends 20-25% of non-revenue water to be acceptable while below 20% to be good. This is contrary to the findings of the research where a 31.17% level of water loss was experienced within a period of only six months. This shows that in those 6 months KIWASCO lost water that was 6.17% more than the recommended amount. The KII however expressed their sentiments that this 31.17% of water loss may have less impact on water utilities that extract their raw water from larger water bodies such as Lake Victoria; but detrimental effects could be imposed on those that extract water from rivers or streams such as River Kibos which is the main water source for Kajulu filter in Kisumu. During the dry months of January to March most Kisumu residents who are supplied by KIWASCO water from Kajulu filter can go for weeks with dry taps because the volume of water in the river is so low that it cannot be pumped. A report by the Environmental Consulting & Technology Inc. (ECT, 2016) also noted that the impacts of water withdrawals can have detrimental effects if the rate of withdrawal exceeds the rate of replacement of the said water. Therefore, it does not matter how big of a source the water is, its continuous and unsustainable use will affect these sources over a period of time and make the water resource even scarcer than it already is. Also, in places where water is pumped from underground aquifers, depletion of these resources is considered to be inevitable as the economy strives for their people to live a comfortable life with an ability to access clean water for their daily use (Konikow and Kendy, 2005). The depletion in these ground water aquifers also directly or indirectly impacts the surface water making both water sources unsustainable especially in the face of the rapidly growing population according to Liu et.al, (2020). They further explain that the impacts of groundwater abstractions on stream flow depletion is often underestimated as the water utilities are only focused on meeting the demand.
These ideologies are also supported by some of the discussants in the FGD where it was observed that KIWASCO increases the water tariffs in cases where water is lost to make up for the unaccounted for water and improve their revenue collection while also increasing the level of supply to meet the demand regardless. The FGD participants also argued that in trying to reduce water loss, KIWASCO should consider them as the major stakeholders and put their needs first.
Effects of water loss on the general environment
Soil, the effects of which included soil erosion where the participants argued out the fact that during pipe bursts/leakages, the water not only carries wastes into other water bodies but also carries away the top soil if the pipe burst occurs in a steep place during high pressure; hence contributing to the level of soil erosion that eventually leads to increased sedimentation in nearby water bodies. Increased levels of sedimentation also interfere with the flow regime of the water thereby reducing the quality of water for downstream communities.
Land, the effects of which included destruction of the water catchment areas through over abstraction of water in order to make up for the amount of water lost and meet the demands of the population. Also, water losses in areas with poor drainage lead to an increase of the patches of stagnant water, hence creation of artificial wetlands that reduce the general aesthetic value of the environment.
Air – Water utilities use a lot of energy to extract, treat and distribute water to the consumers. The use of non-renewable sources of energy for pumping water was flagged by the International Water Association as a major contributor to the greenhouse effect as the pumps are always left running. Increase in the levels of water loss therefore contributes to global warming as the water utilities will need to pump more water into the distribution network to make up for the amount of water lost and meet consumers’ demand. This water pumps on non-renewable forms of energy that emit environmental pollutants such as carbon dioxide, methane and nitrous oxides that trap heat into the atmosphere thereby contributing to the level of global warming over time. A report by IWA further stated that “increase in the energy use by the water utilities to meet the population demand and make up for the water lost contributes to the carbon footprints robbing us of a cleaner, better world stating that between 2005 and 2013 there was a total of 21,000t CO2 emissions in the production, treatment and distribution of water to consumers by the water utilities.”
Effects on the social environment – this involves the human aspect which is mostly impacted by water logging and increased decline in water quality. When pipe bursts/ leakages occur in areas with poor drainage, the water stagnates there for quite some time creating temporary breeding sites for disease vectors such as mosquitoes, hence the increased cases of malaria in the surrounding areas and bilharzia snails which are harmful to general human health. Also the decline in water quality due to leakages will lead to an increase of other water-borne related diseases such as typhoid and cholera especially in the high density estates where there is no proper sewerage system and thus the water that is lost through leakages may easily come into contact with wastes and become polluted. Pollution was also the most common effect identified by all the participants where one of the discussants stated that “as an expert in community development, the issue of pipe bursts and sewer systems is a real problem especially in low income neighborhoods where there is a lot of congestion and poorly structured social amenities.” Again, depending on the intensity, pressure, size of the pipe and duration of the leakages, water from these leakages may carry wastes along the way and deposit them in nearby water bodies such as river/ streams hence pollution. The compounded impacts of these water losses also affect the social well-being of the consumers in that the water shortage created by these water losses leads to decline in sanitation and the general standards of living on the consumers. Sometimes, the water service providers also increase water tariffs so as to make up for the revenue lost. This becomes a problem to individuals who cannot afford it and they therefore seek alternative ways of accessing water for their daily use which usually involves stealing of the said water.
CONCLUSION
Non-revenue water loss has significant effects on water quality parameters which are majorly attributed to the physical water losses such as leakages, pipe bursts and overflows in the storage tanks that create avenues through which contaminants get into the distribution network. Continued water loss that exceeds the rate of renewal also leads to the decline of the said water at source and also affects other environmental components albeit some of the effects being hard to detect and quantify. These impacts could range from the mere fact that the water lost can be used to supply people with limited access to water hence reduced level of water shortage to cumulative impacts such as increased amount of carbon footprints. This is because more energy is required to replace the water that is lost to meet the supply and demand curve, hence increase in the emission of greenhouse gases.
RECOMMENDATION
Quantifying environmental effects may prove to be a challenge and therefore there should be detailed analysis of factors such as the change in the water catchment areas over a period of time by using GIS systems to map the effects of the rates of water withdrawal at source. There is also need to ascertain whether these environmental changes are solely due to the water loss experienced by water utilities or if they are enhanced by other external factors. The enhancement of water quality by water utilities requires the use of technological advancement and modernized equipment to improve water distribution.
CONFLICT OF INTERESTS
The authors have not declared any conflict of interests.
REFERENCES
|
Awopetu MS, Coker Ao, Aribisala JO, Awopetu SO (2013). Water Quality In A Pipe Distribution Network: A Case Study Of A Communal Water Distribution Network In Ibadan, Nigeria. Water Resources Management 171:175-186. |
|
|
AWWA (2019). Key performance indicators for Non-Revenue Water. AWWA Water Loss Control Committee 112(1):20-30. |
|
|
Baker B, Aldridge c, Omer A (2016). Water: Availability and use. Mississippi State University Extension 2016. P 3011. |
|
|
Donkor EA, Asce SM, Mazzuchi TA, Soyer R, Roberson JA (2014). Urban Water Demand Forecasting: Review of Methods and Models. Journal of Water Resources Planning and Management 140(2):146-159. |
|
|
Fontanazza C, Notaro V, Puleo V, Nicolosi P, Freni G (2015). Contaminant intrusion through leaks in water distribution system: Experimental analysis. Procedia engineering 119(1):426-433. |
|
|
Frauendorfer R, Liemberger R (2010). The issues and challenges of reducing Non Revenue Water. Mandaluyong City, Philippines. Asian Development Bank. |
|
|
IWMI Annual Report (2017). Why the world is fast approaching water crisis in the near future. Colombo, Sri Lanka. International Water Management Institute (IWMI). ISSN 1017-5954. P 36. |
|
|
Kingdom B, Liemberger R Marin P (2006). The Challenge of Reducing Non-Revenue Water (NRW) in Developing Countries. How the Private Sector Can Help: A Look at Performance-Based Service Contracting, Washington DC, The World Bank. |
|
|
Konikow L, Kendy E (2005). Groundwater depletion: A global problem. Hydro geology journal 13(1):317-320. |
|
|
Liemberger R, Wyatt A (2019). Quantifying the global Non-Revenue Water problem. Water Supply 19(3): 831-837. |
|
|
Liu W, Park S, Bailey R (2020). Quantifying the stream flow response to groundwater abstractions for irrigation or drinking water at catchment scale using SWAT and SWAT-MODFLOW. Environment Sciences Europe 32(113):1-25. |
|
|
Saria J (2015). Effects of water pipe leaks on water quality and on Non-Revenue Water: Case of Arusha municipality. Journal of Water Resources and Ocean Science 4(6): 86-91. |
|
|
USAID and African Water Association (AfWA) (2015). USAID Further Advancing, The Blue Revolution Initiative (FABRI) (2015). Africa Non- Revenue Water Program Synthesis Report. |
|
|
Water Services Regulatory Board (WASREB) (2019). Final report on Non-Revenue Water audit of the Water Service Providers. Kenya. |
|
Copyright © 2024 Author(s) retain the copyright of this article.
This article is published under the terms of the Creative Commons Attribution License 4.0


