ABSTRACT
Under conditions of high pressure on water resources, it is essential to quantify the water balance. There are tools to perform the water balance, but unfortunately, they are expensive and hardly accessible in developing countries. The objective of this study was to quantify the water balance using a low-cost lysimeter (LCL). Rainfall was measured using rain gauge. Soil water content (SWC) and infiltration were measured in the LCL, which was out in the open. The site of study was a place in La Malinche volcano (Mexico). Evaporation was calculated using the water balance equation. In order to evaluate the LCL efficiency, measurements were registered for two years (2015-2016). The distribution of the rainfall data was assessed using Kolmogorov-Smirnov test (K-S). The Mann-Whitney test (M-W) was used to compare rainfall, SWC and infiltration for the two years. HYDRUS-1D software was used to simulate soil water storage (SWS) in the LCL. The efficiency of HYDRUS-1D was evaluated with Nash-Sutcliffe test (N-S). The total annual rainfall was 992.1 mm for 2015 and 1025.1 mm for 2016. The K-S test showed that rainfall data had exponential distribution in both years. The M-W test evidenced that rainfall, SWC and infiltration were not significantly different (p>0.05) for the two years. Rainwater infiltration was 6.4% for 2015 and 5.9% for 2016. Most of the rainfall was evaporated, reaching percentages around 94%. N-S test showed that there was a good simulation of the LCL by HYDRUS-1D software. The water balance indicated that currently, La Malinche recharge area is insufficient to compensate the water consumption of Puebla and Tlaxcala. The use of low cost lysimeter would be of great help in expanding basin-scale water balance studies.
Key words: La Malinche volcano, low-cost lysimeter, water balance, HYDRUS-1D.
Rainfall is the most important water input to the semiarid and arid environments. Mexico is located between the temperate and intertropical zones, and two-thirds of its territory is classified as arid or semiarid with annual rainfalls nearly to 500 mm. The other third is humid with greater rainfalls than 2000 mm (NWC, 2015). The Northern and Central parts of Mexico suffer water scarcity, and its availability is diminishing due to continuous population growth, water reservoir pollution, overexploitation of water resources and climatic change (Martínez-Austria and Patiño-Gómez, 2012). NWC (2015) reported that in Mexico, the rainfall was approximately of 1.45 Gm3/year, which 72.5% evaporated, 21.2% flowed into the rivers and 6.3% infiltrated and recharged the aquifer. Thus, the knowledge of hydrological cycle elements in detail is essential to estimate water availability locally and regionally. Hydrological cycle elements include precipitation, evaporation, soil water content ( , runoff, infiltration, and aquifer recharge. These elements are interdependent and occur with different intensity considering the environmental conditions. Precipitation patterns affect water balance at both local and catchment scales (Liu et al., 2016). Precipitation characteristics (that is, amount, intensity, and duration) influence soil water movement. Antecedent soil moisture condition can act as a threshold to trigger preferential flow (Zhu et al., 2014). The evaporation influences water and energy distribution of the land-atmosphere interface (Xiao et al., 2011). Soil evaporation and soil moisture are two related variables. Soil moisture is a key variable of the climatic system (Mittelbach et al., 2011), and it encompasses the effects of climate, soil and plant community composition and function (Liu et al., 2016).
Soil moisture controls many hydrological processes, especially runoff generation, soil evaporation and plant transpiration (Longobardi 2008). is a key variable that influences the partitioning of solar energy (that is, latent and sensible heat flux) and the partitioning of the precipitation (that is, runoff and percolation) (Koyama et al., 2010). Characterization of has implications for hydrological modelling of soil water dynamics and sustainable management of soil water resources in arid and semiarid areas (Wang et al., 2014). The initial soil water content has a direct influence on the infiltration capacity and on surface runoff (Descroix et al., 2002). Infiltration is the process whereby water enters the soil. It has a direct effect on the quantity of surface runoff, soil erosion, and the recharge of groundwater (Huang et al., 2013). It is necessary to know the amount of water entering into the system under arid or semiarid conditions, as it occurs in Northern and Central of Mexico, particularly in La Malinche volcano, where water scarcity might occur in the future. La Malinche is an isolated quaternary strato-volcano located in the eastern central part of the Trans-Mexican Volcanic Belt (Castro-Govea and Siebe, 2007). Water balance studies have been conducted in Mexico (Muñoz-Villers et al., 2012; Cruz-Falcón et al., 2013; López-Lambraño et al., 2017). It is quite difficult to investigate multiple factors of hydrological cycle elements at once. Studies using lysimeters may help to improve the understanding of water and energy exchange processes (Schrader et al., 2013). The objective of this study was to quantify the water balance using a low-cost lysimeter under environmental conditions of La Malinche volcano in Mexico.
Lysimeter
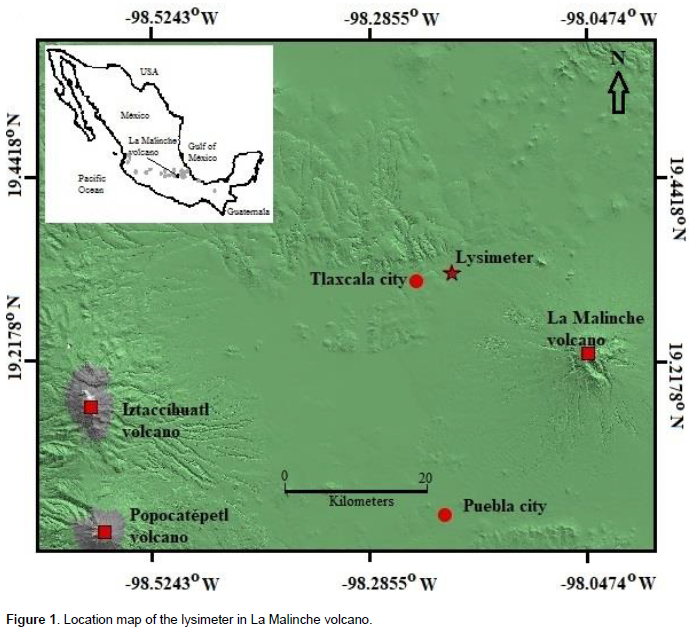
It is a nonweighing, disturbed, and free drainage lysimeter (Hopmans et al., 1999; Abdulkareem et al., 2015). The lysimeter was built with a high-density polyethylene container of 28.1 cm diameter and 35 cm height. A soil layer of 24.4 cm thickness was placed in the inner container with a bulk density of 1.32 g/cm3. The bulk density was similar to the field condition and it was measured using core method (Blake and Hartge, 1986). In order to store rainfall infiltration, a layer of 4 cm of sand was laid at bottom of the lysimeter. The soil surface remained without vegetation eliminating any herbal sprouts. The soil layer was taken from a plot (19°19’ 30.9’’ N, 98°09’ 02.6’’ W) (Figure 1) located in the northwest hillside of La Malinche national park (SEMARNAT, 2013). According to Serie II pedological chart published by INEGI (2017), the soil is a fluvisol with sandy loam textural class: 8% clay, 26% silt and 66% sand, and covers 61.7% of La Malinche volcano area. The lysimeter was out in the open so that the rainfall was the only source of water.
Data collection
In order to measure the rainfall, a rain gauge was placed near the lysimeter. After each rainfall event, the rainfall depth and water volume of the infiltration were measured immediately. Soil evaporation was calculated using the water balance equation:
The daily variations of soil water content

in the lysimeter was registered using a dielectric sensor plugged to a data logger ECH
2O
® (Decagon Devices Pullman WA). The sensor length was 24.9 cm with ±0.04% of accuracy. It was inserted vertically, with its head partially in the air (2 cm) and its body fully inside the lysimeter (22.9 cm). Prior the recording of the

measurements, the sensor response was tested at soil saturation and dry soil conditions. The soil saturation condition was reached out by upward flow. For the analysis of

, the data recorded at 8:00 AM were considered. The study was conducted during two years (2015-2016) in order to evaluate the lysimeter functionality.
Data analysis
The distribution of rainfall events was analyzed using a histogram and the Kolmogorov-Smirnov goodness of fit test (K-S). The statistical comparison between the two years of measurements of rainfall, and infiltration data was made using the Mann-Whitney test (M-N) (McBean and Rovers, 1998).
Simulation of soil water storage
The total amount of water that was stored in the soil layer (soil water storage, was simulated using the HYDRUS-1D software package version 4.16 (Šimůnek et al., 2013). The HYDRUS-1D is a computer software package for simulating the one-dimensional movement of water, heat, and solutes in variably saturated media (Šimůnek et al., 2016). (cm) was calculated from (cm3/cm3) according to the equation:
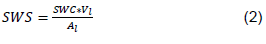
where

is the volume (cm
3) and

is the area (cm
2) of the soil layer. In HYDRUS-1D software, the following parameters were selected: (a) the van Genuchten-Mualem model; (b) parameters of water flow according to a sandy soil; (c) atmospheric boundary conditions with a surface layer as upper boundary conditions, and (d) seepage face as lower boundary conditions. The initial condition of soil profile was equal to field capacity. The resulting data of the HYDRUS-1D

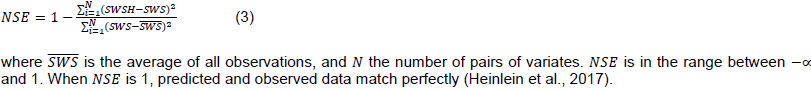
was compared with using Nash-Sutcliffe efficiency coefficient

, as described in Heinlein et al. (2017):

Rainfall events
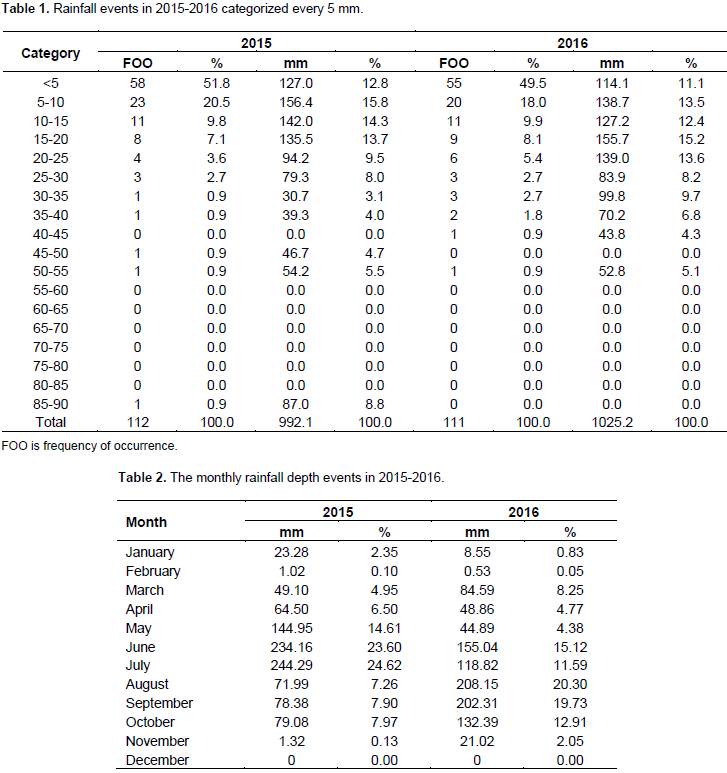
The number of rainfall events was similar in the two years of this study (Table 1), but higher amount of total annual rainfall was recorded in 2016 (1025.1 mm) than 2015 (992.1 mm). Mercado-Mancera et al. (2014) reported similar results for the Mexican Highland. According to CONAGUA (2016), in the years 2015 to 2016, the annual rainfall amounts were greater than the Mexico´s normal rainfall (740 mm). As shown in Table 1, low rainfall events (<5 mm) were the most frequent but did not contribute substantially to total annual rainfall. Events ranged between 5 and 10 mm were less frequent but contrary to events <5 mm contributed more water. In this same way, high rainfall events (>10 mm) were even less frequent but they contributed three-quarters of the annual rainfall. Rainfall events between 50 and 100 mm classified as strong (Wu et al., 2015) occurred rarely. Synthesizing, although there were rainfall events in approximately 33% of the days of 2015 and 2016 years, most of them did not contribute with a significant amount of water in La Malinche volcano. The monthly distribution of rainfall events is presented in Table 2. July and August were the rainiest months during the two years of the study. In July (2015) and August (2016) the rainfall values were 244.3 and 208.2 mm, respectively. In the two rainy periods, May to July (2015) and June to September (2016), it rained more than the mean reported for the whole country (CONAGUA, 2016).

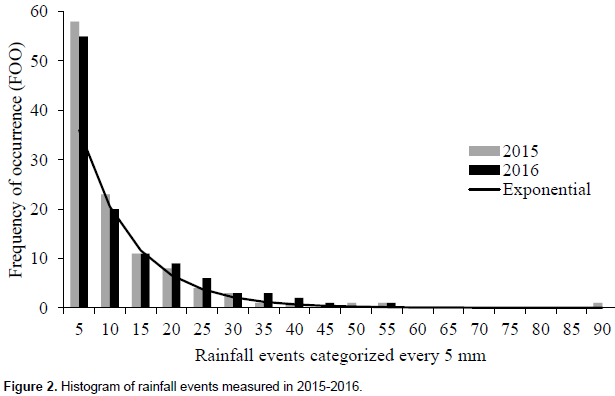
The driest months were December in 2015 and February in 2016. Notwithstanding the monthly rainfall distribution changed in each year; the M-W test showed that the annual rainfall was not significantly different (p>0.05) between the two years. The histogram in Figure 2 shows the frequency of rainfall events which occurred in intervals of 5 mm. The data graphed are positively skewed since the long tail is to the right, the skewness values were 3.46 for 2015 and 1.74 for 2016. Data with skewness from 0.5 to 1 are considered moderately skewed (McBean and Rovers, 1998), and K-S test confirmed that the rainfalls distributions were significantly different from the normal distribution (p<0.05). Similarly to the gamma distribution reported by Sharma and Singh (2010), the data were fitted a negative exponential distribution described by the following equation: with λ=0.1129, for both years. The negative exponential distribution is a particular case of gamma distribution when α is equal to 1, α is the shape parameter in gamma distribution. Negative exponential distribution shows that strong rainfall events are scarce (Wainwright and Mulligan, 2004), as occurred in this study. The positively skewed distribution of rainfall events and their variability of around 40% have serious implications for , soil evaporation and therefore in the infiltration.

Infiltration and evaporation
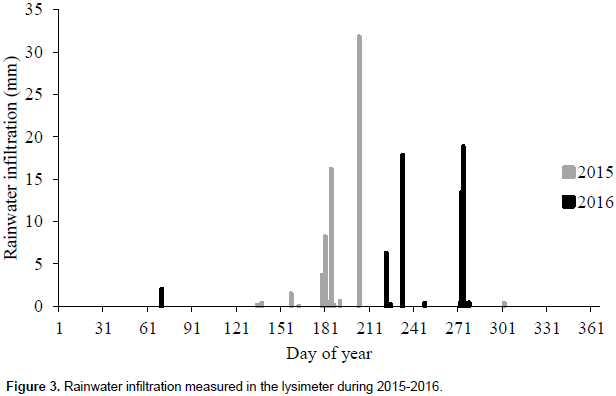
The low cost and simplified lysimeter responded according to the distribution and variability of rainfall. Rainwater infiltration occurred when the sum of water stored in the soil and rainfall was greater than the water storage capacity of the soil. The infiltration events were registered 13 times during 2015 and 11 times for 2016. Figure 3 shows the rainwater infiltrations events >1 mm. The amount of rainwater infiltration was 63.4 mm in 2015 and 60.1 mm in 2016; these values represented 6.4 and 5.9% of the annual rainfall, respectively. According to M-W test, the amount of infiltration was not significantly different (p>0.05) between the two years. The similar behavior of the infiltration in the two years, as it happened with the rain, reinforce the idea that the lysimeter used in this study worked properly and it is an option to estimate the recharge of the aquifer. Moreover, this type of lysimeter can be a tool to measure the amount of rainwater that infiltrates by each rainfall event. The percentage of rainwater infiltration for each rainfall event ranged from 0.5 to 65.8% in 2015 and from 2.7 to 55.9% in 2016. The lowest was recorded in the drought and the highest in the rainy seasons. Two meteorological events occurred in June and July of 2015. During June, four days of continuous rainfall recorded 70.4 mm and the infiltration was 28.0 mm (39.7%). During July, an extreme rainfall event recorded 87.0 mm and the infiltration was 31.8 mm (36.6%). Both events represented 93.7% of the annual infiltration. Similarly, in August 2016, an extreme rainfall event of 52.8 mm occurred, of which 17.8 mm (33.7%) infiltrated. During September and October of 2016, five days of continuous rainfall recorded 99.5 mm and the infiltration was 33.5 mm (33.6%). Both events represented 85.2% of the annual infiltration. These percentages of infiltration by rainfall event were similar to those reported in the literature (Flores-Mangual et al., 2016).
As mentioned by Eilers et al. (2007), the infiltration is not only predictable with the annual rainfall, but also with distribution and magnitude of rainfall and soil moisture deficit, that precedes each rainfall event. The water balance equation (Equation 1) showed that evaporation was 927.7 mm (93.6% of annual rainfall) in 2015 and 962.9 mm (94.1%) in 2016. Between both years, there was a difference of ~0.05%. These percentages indicate that in La Malinche a considerable amount of rain evaporates and are not comparable with those reported in the literature (Kerridge et al., 2008). Moreover, in shrub vegetation and arid conditions, evaporation can be equal to rainfall (Qiu et al., 2015). This water balance method, with more accurate information, will help to take actions in good water management. For example, in the year 2015, it was obtained that 63 L/m2 (1 mm of water depth * 1 m2 = 1 L) were recharged to the aquifer, while the annual per capita consumption in Mexico is 49 410 L, so a recharge surface of 7840 ha per one million inhabitants must be allocated to covers its annual demand. La Malinche national park has an area of 46 112 ha (SEMARNAT, 2013), therefore it has the capacity to recharge water for 5.88 million people. In the cities of Puebla and Tlaxcala (Figure 1) live approximately 7 318 883 inhabitants, so the surface of the La Malinche is insufficient to prevent the depletion of the aquifer and ensure water for future generations.
Soil water content
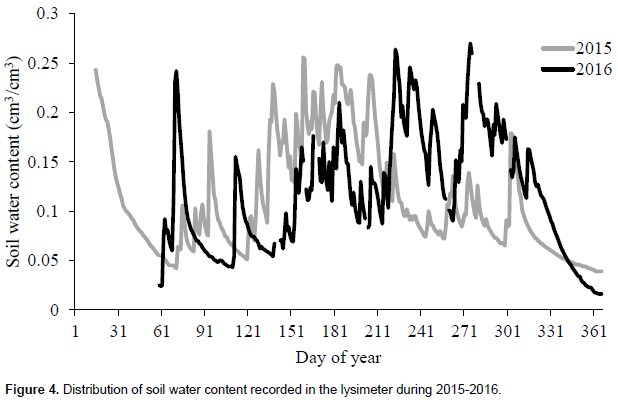
Figure 4 shows trend lines during 2015 and 2016. Due to artificial saturation of soil prior to measurements, the sensor registered a value of 0.248 cm3/cm3 at the beginning of 2015. As mentioned by Zhu et al. (2014), when low rainfall events (3-4 mm) the sensor did not register changes of , due to rainwater did not infiltrated the whole soil layer (24.4 cm). The variations of were associated with rainfall events > 4 mm and evaporation. The non-linear decrease of , as it has been reported in the literature (Engda et al., 2016), was also observed in this lysimeter. During rainy seasons, average ranged 0.146-0.137 cm3/cm3 and its coefficient of variation ranged between 38.4 and 40.0%. According to M-W test, was not significantly different between the years (p>0.05). The analysis of the rainfall events and showed similar results of coefficients of variation and of M-N test, which indicates that both variables were linked and that the lysimeter responded appropriately according to the rainfall events.
Soil water simulation
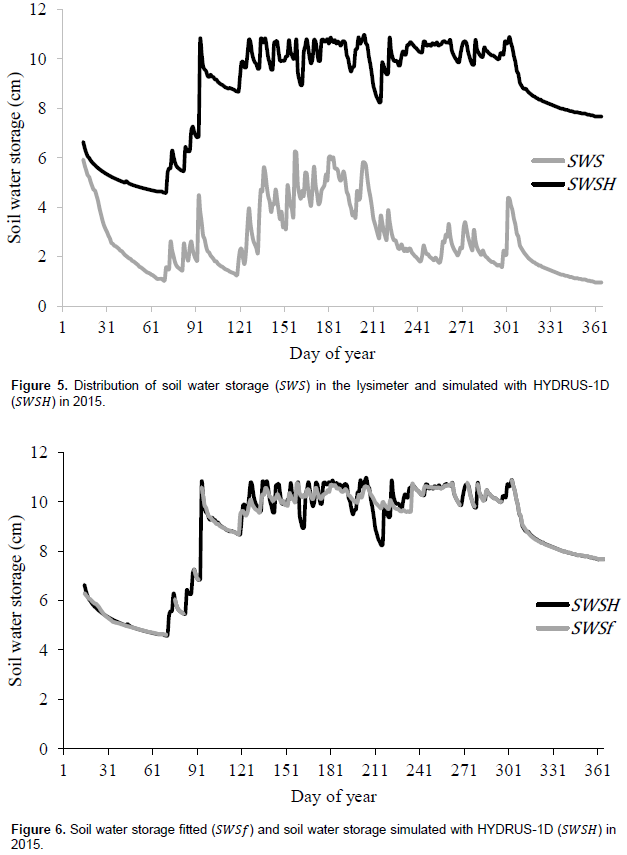
As shown in Figure 5, the HYDRUS-1D software overestimated during the simulation in 2015. A similar result was obtained in 2016 (not presented here). The difference between and might be caused by the distance to the lysimeter wall (12 cm) and the vertical orientation of the sensor. As mentioned by Vaz et al. (2013), the distance and the orientation of the sensor produce important deviations of dielectric permittivity and therefore of value. In days without rainfall and unsaturated soil, and trend lines were parallel and had positive correlations coefficients close to 1. On the other hand, in days with rainfall and saturated soil, the correlation coefficient between and diminished to values of 0.5. As pointed out by Mittelbach et al. (2011) and Fares et al. (2016), this result may be related to the sensor sensitivity that decreases in saturated soil conditions. Taking advantage of the strong correlation between and , was fitted to using the following regression equation: , where is fitted, and m and b are constant. and lines trend are showed in Figure 6. As result of this procedure, N-S coefficients were equal to 0.973 and 0.931 for 2015 and 2016, respectively. The acceptable values of N-S test indicated that the parameters selected in HYDRUS-1D software were adequate. The simulation of the process, as occurs in nature, provided information that could be used in other research, for example, to study the temporal and spatial variability of the water balance, to obtain the parameters that govern the flow of water in the soil, to study the transport of pollutants in the soil, among others.
The total annual rainfall was 992.1 mm in 2015 and 1025.2 mm in 2016; these values were higher than the national mean (740.0 mm) of 1981 to 2010. Low rainfall events (< 5 mm) were the most frequent, and strong rainfall events rarely occurred. K-S test showed that the rainfall events had an exponential distribution. Rainwater infiltration accounted for 6.4% in 2015 and 5.9% in 2016 of the annual rainfall. Soil evaporation was the most important in the water balance, reaching values of 94% of the annual rainfall. variations were associated to rainfall and evaporation, and in dry periods decreased non-linearly. According to M-W test, the rainfall, infiltration, and were not significantly different between the years 2015 and 2016 (p>0.05). values were consistently below values, probably due to the vertical orientation of the sensor and the distance between it and the wall of the lysimeter. As demonstrated by N-S test, the soil water storage of the lysimeter was simulated properly with the HYDRUS-1D software. Therefore, the simulation of the lysimeter could be used to estimate the parameters that govern the flow of water in the soil. The measurements of water flow parameters in the soil require expensive equipment. As shown by M-N tests and the concordance of the results of infiltration, evaporation and , the lysimeter worked properly. The water balance indicated that currently, La Malinche recharge area is insufficient to compensate the water consumption of Puebla and Tlaxcala. The proposed lysimeter could be used to study the spatial and temporal variability of the water balance, and the transport of contaminants in the soil.
The authors declare no conflict of interest.
REFERENCES
|
Abdulkareem JH, Abdulkadir A, Abdu N (2015). A review of different types of lysimeter used in solute transport studies. Int. J. Plant Soil Sci. 8(3):1-14.
Crossref
|
|
|
|
Blake GR, Hartge KH (1986). Bulk density. In: Klute A. (ed.): Methods of soil analysis. Part 1 (2nd ed.). Agron. Monogr. 9. Madison, WI, ASA, and SSSA: 363-375.
|
|
|
|
Castro-Govea R, Siebe C (2007). Late Pleistocene–Holocene stratigraphy and radiocarbon dating of La Malinche volcano, Central Mexico. J. Volcanol. Geotherm. Res. 112:20-42.
Crossref
|
|
|
|
CONAGUA (Comisión Nacional del Agua) (2016). Statistics on water in Mexico 2016 edition. SEMARNAT.
View
|
|
|
|
Cruz-Falcón A, Troyo-Diéguez E, Fraga-Palomino H, Vega-Mayagoitia J (2013). Location of the rainfall recharge areas in the basin of La Paz, BCS, Mexico. In: Wurbs R. (ed.): Water resources planning, development and management. Vienna. InTech pp. 143-156.
Crossref
|
|
|
|
Descroix L, Nouvelot JF, Vauclin M (2002). Evaluation of an antecedent precipitation index to model runoff yield in the western Sierra Madre (North-west Mexico). J. Hydrol. 263:114-130.
Crossref
|
|
|
|
Eilers VHM, Carter RC, Rushton KR (2007). A single layer soil water balance model for estimating deep drainage (potential recharge): An application to cropped land in semi-arid North-east Nigeria. Geoderma 140:119-131.
Crossref
|
|
|
|
Engda TA, Kelleners TJ, Paige GB (2016). Soil water monitoring and numerical flow modeling to quantify drought conditions in a rangeland ecosystem. Vadose Zone J. 15:1-12.
Crossref
|
|
|
|
Fares A, Awal R, Bayabil HK (2016). Soil water content sensor response to organic matter content under laboratory conditions. Sensors 16:1-11.
Crossref
|
|
|
|
Flores-Mangual ML, Lowery B, Bockheim JG (2016). Episodic rainwater movement in a hydrophobic sparta sand under three ecosystems in Lower Wisconsin River Valley. Soil Sci. Soc. Am. J. 80:1443-1462.
Crossref
|
|
|
|
Heinlein F, Biernath C, Klein C, Thieme C, Priesack E (2017). Evaluation of simulated transpiration from maize plants on lysimeters. Vadose Zone J. 16:1-16.
Crossref
|
|
|
|
Hopmans JW, Hendrickx JMH, Selker JS (1999). Emerging measurement techniques for vadose zone characterization. In: Parlange MB, Hopmans JW (eds.): Vadose Zone Hydrology: Cutting Across Disciplines. New York, Oxford University Press: 279-316.
|
|
|
|
Huang J, Wu P, Zhao X (2013). Effects of rainfall intensity, underlying surface and slope gradient on soil infiltration under simulated rainfall experiments. Catena 104:93-102.
Crossref
|
|
|
|
INEGI (2017). Edaphological vector data set scale 1:250 000 series II. INEGI.
|
|
|
|
Kerridge B, Hornbuckle JW, Christen EW, Faulkner RD (2008). Soil spatial variability effects on irrigation efficiency.
View
|
|
|
|
Koyama CN, Korres W, Fiener P, Schneider K (2010). Variability of surface soil moisture observed from multitemporal C-Band synthetic aperture radar and field data. Vadose Zone J. 9:1014-1024.
Crossref
|
|
|
|
Liu X, He Y, Zhao X, Zhang T, Li Y, Yun J, Wei S, Yue X (2016). The response of soil water and deep percolation under Caragana microphylla to rainfall in the Horqin Sand Land, northern China. Catena 139:82-91.
Crossref
|
|
|
|
Longobardi A (2008). Observing soil moisture temporal variability under fluctuating climatic conditions. Hydrol. Earth Syst. Sci. Discuss. 5: 935-969.
Crossref
|
|
|
|
López-Lambra-o AA, Fuentes C, González-Sosa E, López-Ramos AA (2017). Rainfall-interception loss-runoff relationships in a semi-arid catchment. Tecnologia Y Ciencias Del Agua 8(4):37-56.
|
|
|
|
Martínez-Austria PF, Pati-o-Gómez C (2012). Effects of climate change on water availability in Mexico. Tecnologia Y Ciencias Del Agua 3(1):5-20.
|
|
|
|
McBean EA, Rovers FA (1998). Statistical procedures for analysis of environmental monitoring and risk assessment. Upper Saddle River, Prentice Hall: 3:245-247.
|
|
|
|
Mercado-Mancera G, Ramírez-Rodríguez M, Vizcarra-Hernández IF, López Antonio H, López-Vargas DM, Granados-Mayorga AK, Reyes-Landa D, Chaires-Montecinos BE (2014). Distribution and probability of rain in Cuautitlán Izcalli, Mexico State. OMMAC.
View
|
|
|
|
Mittelbach H, Casini F, Lehner I, Teuling AJ, Seneviratne SI (2011). Soil moisture monitoring for climate research: Evaluation of a lowâ€cost sensor in the framework of the Swiss Soil Moisture Experiment (SwissSMEX) campaign. J. Geophys. Res. 116:1-11.
Crossref
|
|
|
|
Mu-oz-Villers LE, Holwerda F, Gómez-Cárdenas M, Equihua M, Asbjomsen H, Brujinzeel LA, Martín-Castro BE, Tobón C (2012). Water balances of old-growth and regenerating montane cloud forests in central Veracruz, Mexico. J. Hydrol. 462-463:53-66.
Crossref
|
|
|
|
National Water Commission (NWC) (2015). Statistics on water in Mexico 2015 edition. SEMARNAT.
View
|
|
|
|
Qiu GY, Li C, Yan C (2015). Characteristics of soil evaporation, plant transpiration and water budget of Nitraria dune in the arid Northwest China. Agric. For. Meteorol. 203:107-117.
Crossref
|
|
|
|
Schrader F, Durner W, Fank J, Gebler S, Pütz T, Hannes M, Wollschläger U (2013). Estimating precipitation and actual evapotranspiration from precision lysimeter measurements. Procedia Environ. Sci. 19:543-552.
Crossref
|
|
|
|
SEMARNAT (2013). Management program La Malinche national park o Matlalcuéyatl. SEMARNAT-CONANP.
|
|
|
|
Sharma MA, Singh JB (2010). Use of probability distribution in rainfall analysis. N. Y. Sci. J. 3:40-49.
|
|
|
|
Šimůnek J, Šejna M, Saito H, Sakai M, van Genuchten MT (2013). Interactive Graphics-Based User Interface HYDRUS1D Version 4.0. In: Šimůnek J, Šejna M, Saito H, Sakai M, van Genuchten MT (eds.): The HYDRUS-1D software package for simulating the one-dimensional movement of water, heat, and multiple solutes in variably-saturated media. Department of Environmental Sciences University of California Riverside, Riverside pp. 287-308.
|
|
|
|
Šimůnek J, van Genuchten MT, Šejna M (2016). Recent developments and applications of the HYDRUS computer software packages. Vadose Zone J. 15:1-25.
Crossref
|
|
|
|
Vaz CMP, Jones S, Meding M, Tuller M (2013). Evaluation of standard calibration functions for eight electromagnetic soil moisture sensors. Vadose Zone J. 12:1-16.
Crossref
|
|
|
|
Wainwright J, Mulligan M (2004). Modelling and model building. In: Wainwright J, Mulligan M (eds.): Environmental Modelling Finding Simplicity in Complexity. West Sussex, John Wiley & Sons Ltd.: 7-73.
|
|
|
|
Wang B, Wen F, Wu J, Wang X, Hu Y (2014). Vertical profiles of soil water content as influenced by environmental factors in a small catchment on the Hilly-Gully Loess Plateau. PLoS ONE. 9(10):1-12.
Crossref
|
|
|
|
Wu M, Lam H, Li K (2015). Characterization and indexing of heavy rainstorms in Hong Kong. Meteorol. Appl. 22:25-36.
Crossref
|
|
|
|
Xiao X, Horton R, Sauer TJ, Heitman JL, Ren T (2011). Cumulative soil water evaporation as a function of depth and time. Vadose Zone J. 10:1016-1022.
Crossref
|
|
|
|
Zhu Q, Nei X, Zhou X, Liao K, Li H (2014). Soil moisture response to rainfall at different topographic positions along a mixed land-use hillslope. Catena 119:61-70.
Crossref
|


 in the lysimeter was registered using a dielectric sensor plugged to a data logger ECH2O® (Decagon Devices Pullman WA). The sensor length was 24.9 cm with ±0.04% of accuracy. It was inserted vertically, with its head partially in the air (2 cm) and its body fully inside the lysimeter (22.9 cm). Prior the recording of the
  measurements, the sensor response was tested at soil saturation and dry soil conditions. The soil saturation condition was reached out by upward flow. For the analysis of
  , the data recorded at 8:00 AM were considered. The study was conducted during two years (2015-2016) in order to evaluate the lysimeter functionality.
 is the volume (cm3) and
  is the area (cm2) of the soil layer. In HYDRUS-1D software, the following parameters were selected: (a) the van Genuchten-Mualem model; (b) parameters of water flow according to a sandy soil; (c) atmospheric boundary conditions with a surface layer as upper boundary conditions, and (d) seepage face as lower boundary conditions. The initial condition of soil profile was equal to field capacity. The resulting data of the HYDRUS-1D
  was compared with using Nash-Sutcliffe efficiency coefficient
  , as described in Heinlein et al. (2017):