ABSTRACT
The Jaffna Peninsula depends largely on groundwater resources for domestic as well as agricultural purposes. On several instances, it was pointed out that the groundwater is deteriorating due to overuse and is polluted by excessive usage of agrochemical, fertilizers, waste oil and improper sewage disposal. Hence, an experimental study was undertaken to assess the analysis of groundwater quality. To achieve this, water samples were collected from the area around the Power Station, Chunnakam. All selected 16 wells were contaminated with coliforms. Tested chemicals concentrations are not in risk level even though Average Nitrate nitrogen concentration of tested 16 well ranges from 8.2 to 29.8 mg/l with the mean value of 19.25625. However the SLS gives that the maximum permissible level of drinking water is 10 mg/l. Groundwater condition of Valikamam area, Jaffna peninsula is not much suitable for drinking purpose.
Key words: Chemical parameters, drinking water, groundwater pollution, groundwater quality, microbial contaminations.
Groundwater is the major natural water resource in the Jaffna Peninsula and is used for home, agricultural and manufacturing purposes. The Jaffna Peninsula lies in the northern part of Sri Lanka and is dependent on groundwater for all its water requirements. Today’s vast chemical industries and their production of synthetic organic chemicals, have introduced new problems to all living organisms to get good quality drinking water. Based on this, scientists engaged in providing and protecting the Nation's supply of pure water (Middleton and Rosen, 1956). Groundwater is an extremely valuable resource and pollution of groundwater resources is a matter of serious concern. Among the major threats to groundwater from which drinking water supplies are obtained, are leachates from human and animal waste matter, along with other chemical pollutants. Agricultural leachates often contribute significantly to groundwater pollution. These originate mainly from human and animal wastes, oil contamination as well as from nitrogenous fertilizers that are often used in large quantities in agriculture.
Rapid urbanization, especially in developing countries, has affected the availability and quality of groundwater due to its overexploitation and improper waste disposal, especially in urban areas. According to World Health Organization (WHO), about 80% of all the diseases in human beings are caused by water. Once the ground-water is contaminated, its quality cannot be restored by stopping the pollutants from the source (Ramakrishnaiah et al., 2009). The quality of drinking water is normally analyzed by physical, chemical, and microbiological parameters. To ensure the safety of drinking water, quality standards for physical, chemical, and microbiological parameters have been analyzed via this study. Chemical parameters of water involve pH, electrical conductivity, chloride, nitrate content, total iron, and total phosphorous. Water is thus examined for total coli forms and Escherichia coli.
Microbial analysis
Location and selection of wells
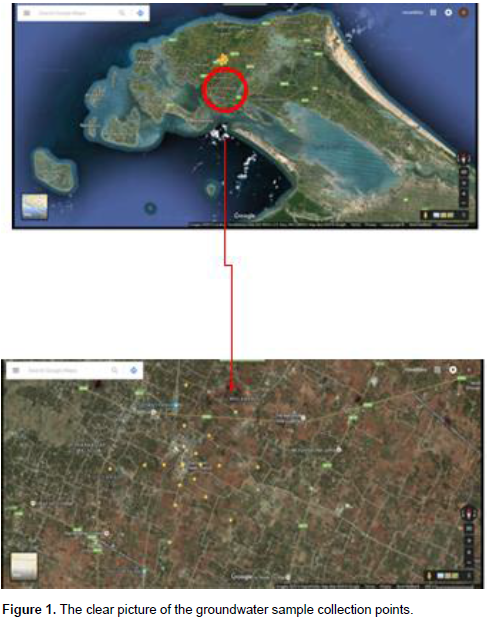
Groundwater samples were collected from wells located around Chunnakam, Sri Lanka Power Station for this research study. Altogether 16 wells were selected to collect the groundwater samples. Figure 1 shows the clear picture of the groundwater sample collection points.
Determining the aerobic and anerobic bacterial count
The aerobic bacterial count in the water samples were determined by spreading plate method (Sinclair and Ghiorse, 1989). After the inoculation, it was incubated in the inverted position at 37°C for 24 h. After 24 h, the colonies were counted in each dish. Same procedure was followed for all well water samples, thereafter the total anaerobic bacterial count in the water samples were determined by Pour plate method (Aranki et al., 1969).
Testing for coliform bacteria
Multiple fermentation tube technique was used (Eckner, 1998) in testing for coliform bacteria. It is customary to report results of the multiple fermentation tube tests for coliforms as a most probable number (MPN) index. This is an index of the number of coliform bacteria that would more probably than any other number, give the results showing that MPN method is based on taking the original sample, dividing it by orders of magnitude and assessing presence/ absence of organisms.
Measuring chemical characters of the water samples
The chloride content was estimated by silver nitrate titration (Cotlove, 1964). The amount of chloride present in water can be easily determined by titrating the given water sample with silver nitrate solution. Cadmium reduction method was used for nitrate-nitrogen analysis (Green et al., 1982). Cadmium metals reduce nitrates in the sample to nitrite. The nitrite ion reacts in an acidic medium with sulfanilic acid to form an intermediate diazonium salt. The salt couples with gentisic acid to form an amber colour solution. Whereas ascorbic acid method was used to measure the phosphorous (John, 1970), phenanthroline method was used to measure the iron, pH was analyzed using Thermo Orion pH meter and electrical conductivity (EC) was measured using CE470 conductivity meter. The determination of total dissolved solids can be measured using multi meter. Total conductance is easily measured and gives results that are convenient as a general indication of dissolved solids.
Chemical characteristics of water
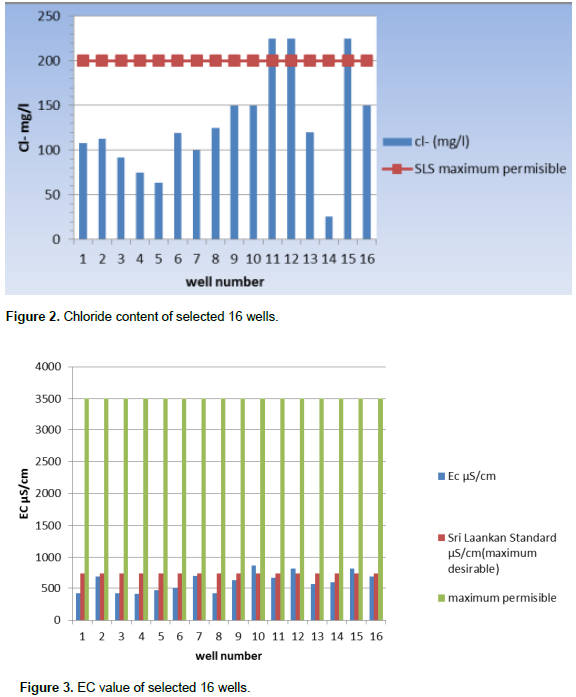
Chloride concentration ranged from 25.927 to 225.24 mg/L. Figure 2 shows the concentration of chloride of all measured wells with Sri Lankan standards of drinking water. All tested wells results showed that 100% of well water contains chloride concentration of less than 600 mg/L. Chloride concentration in excess 250 mg/L can give rise to detectable taste in water (De Silva and Ayomi, 2004). The WHO recommended and maximum limits are 200 and 600 ppm, respectively (Dissanayake and Weerasooriy, 1985) and the action level is 250 ppm. EC levels vary in all wells and range from 418 to 823 µs/cm. Figure 3 shows the average EC value of all sampled wells. Since the measured values of most of the wells were less than Sri Lankan permissible level of 750 µS/cm, few domestic wells had relatively high value of 824 µS/cm, which is an indication of abundant dissolved ionic species. Based on EC, 18.75% of wells are not suitable for drinking. The total dissolved solids variation and comparison with WHO level was shown for 16 domestic wells in Figure 4. The total dissolved solids (TDS) values of selected wells water were determined as ranging from 210 to 412 mg/L. TDS values of all selected wells were below WHO level as 500 mg/L.
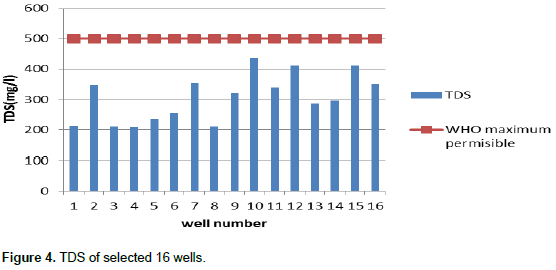
So according to the results of TDS values, all selected wells were considered as under fresh water well (<1000 mg/L). The physical and chemical properties of water mainly depend on the total TDS contents. Water containing more than 1000 mg/L of TDS (WHO, 2004) is generally not recommended for drinking purpose. The average pH value variation in the 16 selected wells is as shown in Figure 5. These values were compared with Sri Lankan Standard, a result that indicates pH values of the selected domestic wells ranges from 6.69 to 7.63 which was slightly alkali. All sampled wells water were within acceptable pH values for drinking. Drinking water with a pH between 6.5 and 8.5 is generally considered satisfactory (Sri Lankan Standards [SLS], 2013). Waters with a pH above 8.5 may have a bitter or soda-like taste. Alkalinity pH can cause several health hazardous effects to human. According to the Sri Lankan Standards (SLS) (2013), total phosphate content must be below 2 mg/L in drinking water. The total phosphate variation and comparison with Sri Lankan Standard levels for the selected domestic wells are as shown in Figure 6.
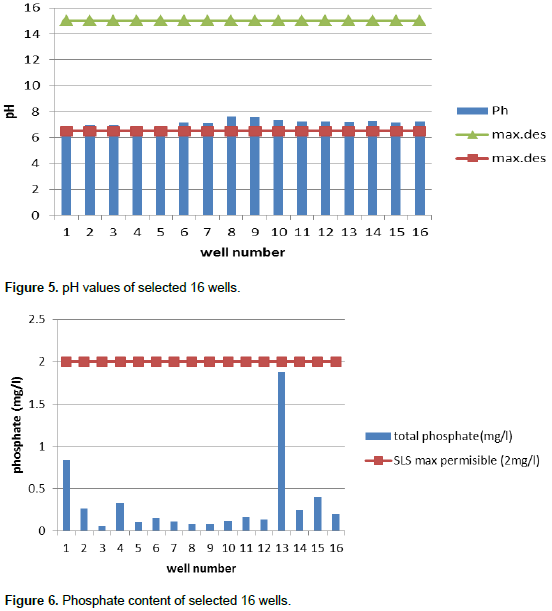
Algae may become a problem in water with more than 0.05 to 0.09 mg/L phosphate depending on other conditions. Algae blooms form in fresh water when cyanobacteria (blue-green algae) grow quickly and form scums or mats in the water. Some blooms can produce toxins harmful to people and animals (Neal et al., 2002). Figure 7 shows the total iron content of selected wells with the comparison of Sri Lankan Standard. Drinking water iron levels should not exceed 0.2 to 0.3 mg/L, because iron can give water an unpleasant taste, odor and color. Iron causes reddish-brown stains on laundry, porcelain, dishes, utensils, glassware, sinks, fixtures and concrete. Detergents do not remove these stains; and chlorine bleach and alkaline builders (such as sodium and carbonate) may even intensify the stains (Mark and Monty, 1996).
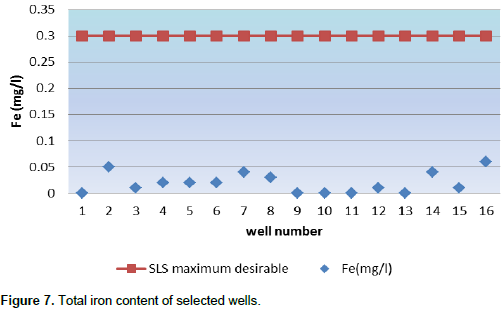
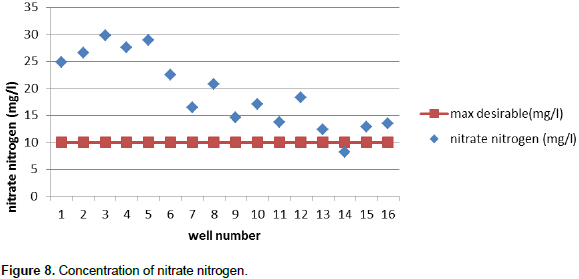
Some guidelines suggest that 0.2 mg/L is the upper limit. According to the SLS standard, all selected wells were suitable for drinking purpose. High concentrations of nitrates may be a health problem for infants. Nitrates, in combination with phosphates are largely responsible for eutrophication, an excessive production in waterways sometimes involving blue-green algae. For drinking water, 10 mg/L is considered the upper limit (Kross et al., 1990). In unpolluted water, nitrate is rarely above 1 mg/L, hence higher levels may indicate contamination. Nitrates are very soluble in water and adhere weakly to soils, so they are often quickly leached. Nitrate concentrations of over 20 mg/L have been recorded in most of the wells. Average nitrate nitrogen concentration of the tested 16 well ranges from 8.2 to 29.8 mg/L with the mean value of 19.25625. However, the SLS gives that the maximum permissible level of drinking water is 10 mg/L. Most of the tested wells show that the concentration is higher than the SLS (Figure 8).
Aerobic and anaerobic bacterial counts
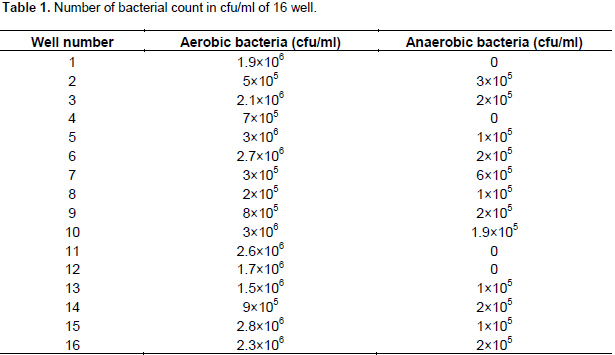
Table 1 shows the aerobic bacterial count present in different well water samples. Total aerobic count varied from 2×10⁵ to 3×10⁶ cfu/ml with a mean value of 1.6875×10⁶ cfu/ml. Total anaerobic bacterial count varied from 0 to 6×10⁵ cfu/ml, whereas some of the wells did not show anaerobic bacterial contamination.The maximum acceptable concentration for bacteria is zero organisms detectable per 100 ml of water. According to the Sri Lankan Standard 894 (2003), acceptable aerobic count is from 1×10² to 1×10⁴ cfu/ml. Based on the SLS requirement, all wells water were not suitable for drinking. The selected 16 wells were contaminated.
Total coliforms and fecal coliform
Total coliforms are a group of bacteria commonly found in the environment, for example, in soil or vegetation, as well as the intestines of mammals. The presence of E. coli in water indicates recent fecal contamination. According to the results, all the selected wells were affected by bacterial contamination severely. No well was suitable for drinking. Well numbers 1, 2, 3 and 6 showed higher MPN/100 ml, because these wells were located very close to the toilet pits. Well numbers 13, 14, 15 and 16 were given positive results for coliform test with low number of MPN/100 ml (Table 2), however, these wells water were not given red colour ring on top of the tryptone water with Kovac’s Indole reagent. This means that these wells were free from fecal coliforms contamination (Figures 9 and 10).
Selected 16 wells did not have the water quality problem in case of physical and chemical properties except nitrate nitrogen content. wells numbers 11, 12 and 15 have higher chloride content than maximum desirable level and other remaining wells have chloride content below this level. In the case of pH, all 16 wells have pH content between maximum desirable levels. Since measured values of most of the wells were less than Sri Lankan permissible level of 750 µS/cm, well numbers 10, 12 and 15 had relatively high value of 824 µS/cm. Based on EC, 18.75% of wells are not suitable for drinking. Water containing more than 1000 mg/L of TDS (WHO, 2004) is generally not recommended for drinking purpose. From this statement, all the selected wells are suitable for drinking purpose because all wells contain TDS below WHO recommended level. Total phosphate and nitrate nitrogen contents of the all selected wells are higher than recommended level except Well number 14 which contains nitrate nitrogen below maximum permissible level. All the selected 16 wells have total iron content below WHO recommended level. When considering the bacteriological contamination of wells, all wells were severely contaminated by normal coliform as well as faecal coliforms except well numbers 13, 14, 15 and 16 having only normal coliform contamination. However, the selected 16 wells at Valikamam area were not suitable for drinking water. Within those 16 wells, well numbers 2 and 3 have shown higher MPN/100 ml for normal coliform examination. This is because these wells are located close to their toilet pits.
The authors have not declared any conflict of interests.
REFERENCES
|
Aranki A, Syed SA, Kenney EB, Freter R (1969). Isolation of anaerobic bacteria from human gingiva and mouse cecum by means of a simplified glove box procedure. Appl. microbial. 17(4):568-576.
|
|
|
|
Cotlove E (1964). Determination of chloride in biological materials. Methods Biochem. Anal. 12:277-391.
Crossref
|
|
|
|
De Silva CS, Ayomi N (2004). Impact of intensive vegetable cultivation on agrowell water quality in Malsiripura region of Kurunegala district. in Proceedings of water professionals' symposium. 2004.
|
|
|
|
Dissanayake C, Weerasooriya S (1985). A geochemical classification of groundwater of Sri Lanka. J. Natl. Sci. Con. Sri Lanka 13:147-186.
|
|
|
|
Eckner KF (1998). Comparison of membrane filtration and multiple-tube fermentation by the Colilert and Enterolert methods for detection of waterborne coliform bacteria, Escherichia coli, and enterococci used in drinking and bathing water quality monitoring in southern Sweden. Appl. Environ. Microbiol. 64(8):3079-3083.
|
|
|
|
Green LC, Wagner DA, Glogowski J, Skipper PL, Wishnok JS, Tannenbaum SR (1982). Analysis of nitrate, nitrite, and [15N] nitrate in biological fluids. Anal. Biochem. 126(1):131-138.
Crossref
|
|
|
|
John MK (1970). Colorimetric determination of phosphorus in soil and plant materials with ascorbic acid. Soil Sci. 109(4):214-220.
Crossref
|
|
|
|
Kross B, Hallberg GR, Bruner DR, Libra RD, Rex KD, Weih LM, Vermace ME, Burmeister LF, Hall NH, Cherryholmes KL, Johnson JK (1990). The Iowa state-wide rural well-water survey water quality data: Initial analysis. Tech. Info. Series 19:142.
|
|
|
|
Mark LM, Monty CD (1996). Drinking Water Problems: Iron and Manganese. Extension Water Resources Specialist The Texas A&M University System. L-5451.2-04.
|
|
|
|
Middleton FM, Rosen A (1956). Organic contaminants affecting the quality of water. Public health reports 71(11):1125.
Crossref
|
|
|
|
Neal C, Jarvie HP, Williams RJ, Neal M, Wickham H, Hill L (2002). Phosphorus calcium carbonate saturation relationships in a lowland chalk river impacted by sewage inputs and phosphorus remediation: an assessment of phosphorus self-cleansing mechanisms in natural waters. Sci. Total Environ. 282:295-310.
Crossref
|
|
|
|
Ramakrishnaiah C, Sadashivaiah C, Ranganna G (2009). Assessment of water quality index for the groundwater in Tumkur Taluk, Karnataka State, India. J. Chem. 6(2):523-530.
Crossref
|
|
|
|
Sinclair J, Ghiorse W (1989). Distribution of aerobic bacteria, protozoa, algae, and fungi in deep subsurface sediments. Geomicrobiol. J. 7(1-2):15-31.
Crossref
|
|
|
|
Sri Lankan Standard 894 (2003). Second revision: Specification for bottled (packaged) drinking water. pp 5-7.
|
|
|
|
Sri Lankan Standards (SLS) (2013). Sri Lanka Standards Institution http://www.slsi.lk/
|
|
|
|
World Health Organization (WHO) (2004). Guidelines for drinking-water quality (Vol. 1). World Health Organization. Recommendations. 3rd edn, World Health Organization, Geneva.
|


