ABSTRACT
The hydrology of Holetta River and its seasonal variability is not fully studied. In addition to this, due to scarcity of the available surface water and increase in water demand for irrigation, the major users of the river are facing a problem of allocating the available water. Therefore, the aim of this research was to investigate the water availability of Holetta River using Geographical Information Systems (GIS) tool and hydrological model. The rainfall runoff process of the catchment was modeled by using Soil and Water Assessment Tool (SWAT). According to SWAT classification, the watershed was divided in to 6 subbasins and 33 hydrological response units (HRUs). The only gauged subbasin in the catchment is subbasin one that is found in the upper part of the area. Therefore, sensitivity analysis, calibration and validation of the model were performed at subbasin one and then the calibrated model was used to estimate runoff at the ungauged part of the catchment. The performance of SWAT model was evaluated by using statistical (coefficient of determination [R2], Nash-Sutcliffe Efficiency Coefficient [NSE] and Index of Volumetric Fit [IVF]) and graphical methods. The result showed that R2, NSE and IVF were 0.85, 0.84 and 102.8, respectively for monthly calibration and 0.73, 0.67 and 108.9, respectively for monthly validation. These indicated that SWAT model performed well for simulation of the hydrology of the watershed.
Key words: Holetta River, SWAT, runoff, rainfall, variability.
Ethiopia is endowed with a huge surface and ground water resources. Many perennial and annual rivers exist in the country. A number of lakes, dams and reservoirs also exist in various parts of Ethiopia. Holetta River is one of the rivers found in the upper part of Awash basin facing challenges of runoff variability and scarcity of water availability during the dry season. The Holetta River is the main source of surface water in the study area and it is a perennial river having three major users. These are Holetta Agricultural Research Center (HARC), Tesdey Farm and Village Farmers. The annual rainfall of the study area ranges between 818-1226 mm, with a bimodal pattern of main rainy season from June to September and short rainy season from January to May. There is relatively intensive rainfall during June to August with the highest mean monthly rainfall recorded in July - 243 mm. The months with the lowest rainfall are November and December. The average annual river flow at Holetta River was 44 million cubic meters (Mcm). The flow was low from January to May and it started to increase at June. The peak flow was 17 Mcm, which occurred in August, and the minimum flow was 0.524 Mcm in February.
In addition to increasing water demand in the area, there is no facility to store the water in the rainy season for future use in the dry season. Therefore, the competition for water is increasing due to scarcity of water and increasing pressure by expanding populations and increasing irrigation. In order to alleviate this challenge, integrated water resources management, and effective water allocation system is essential. Therefore, the aim of this research was to investigate the seasonal variability of runoff and water availability in the catchment using GIS tool and hydrological model.
Theoretical background
Description of SWAT model
Soil and Water Assessment Tool (SWAT) is a river basin scale model developed by Dr. Jeff Arnold for the US Department of Agriculture (USDA) - Agricultural Research Service (ARS) (Neitsch et al., 2005). Soil and Water Assessment Tool is used to predict the impact of land management practices on water, sediment and agricultural chemical yields in large, complex watersheds with varying soils, land use and management conditions over long periods. Soil and Water Assessment Tool is physically based on distributed model requiring specific information on soil, topography, weather and land management practices within the watershed. The physical process associated with water movement, sediment movement, crop growth and nutrient cycling is directly modeled by SWAT using this input data (Arnold et al., 1998). For modeling purposes, the watershed is divided into a number of sub watersheds or subbasins. Input information for each subbasin is organized into the following categories: climate, hydrological response units (HRUs); ponds/wetlands; groundwater; and the main channel or reach.
Simulation of the hydrology of a watershed can be separated into two major divisions. The first division is the land phase of the hydrological cycle. The land phase of the hydrological cycle controls the amount of water, sediment, nutrient, and pesticide loadings to the main channel in each subbasin. The second division is the water or routing phase of the hydrological cycle, which can be defined as the movement of water, sediments, etc. through the channel network of the watershed to the outlet (Neitsch et al., 2005).
The application of SWAT in predicting stream flow and sediment as well as evaluation of the impact of land use and climate change on the hydrology of watersheds has been documented by various studies (Dessu and Melesse, 2012; Dessu et al., 2014; Wang and Melesse, 2006; Behulu et al., 2013, 2014; Setegn et al., 2014; Getachew and Melesse, 2012; Assefa et al., 2014; Grey et al., 2013; Mohammed et al., 2015).
Description of the study area
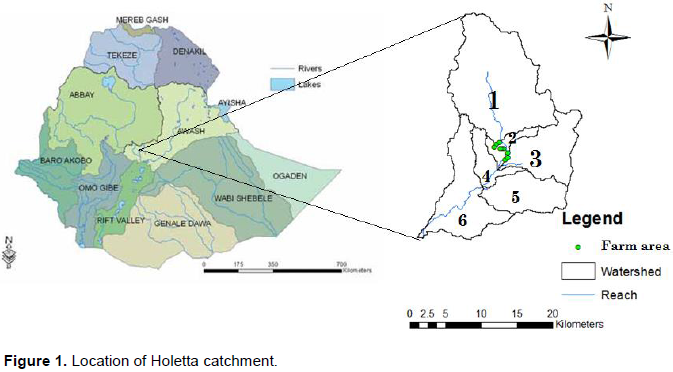
The study was conducted at Holetta catchment, which is located in the upper part of Awash River basin, Ethiopia. The study area lies at an altitude of 2069 - 3378 m above sea level and located at a latitude range of 8°56'N to 9°13'N and longitude range of 38°24'E to 38°36'E. It is a catchment with drainage area of 403.47 km2. The annual rainfall of the study area ranges between 818-1226 mm. The climate of the study area is described with the air temperature ranging from 6 to 230C with the mean of 14°C (Figure 1).
Data collection
All meteorological data (rainfall, temperature, relative humidity, wind speed and sunshine hour) were collected from National Meteorology Agency and Holetta Research Center. Flow data and data (topographic, land use/cover data and map, soil map) were collected from Ministry of Water and Energy.
SWAT model input
Soil and Water Assessment Tool required the following data to be defined for the physical watershed representation, topography data (Digital Elevation Model), climate (daily measured and monthly statistical weather data), flow data, soil and land use data (maps and physical parameters).
Digital elevation model data
The Digital Elevation Model (DEM) of Awash basin was taken from Ministry of Water and Energy GIS department. Then, a 90 m resolution DEM was used in SWAT model to delineate the Holetta catchment and to analyze the drainage patterns of the land surface terrain.
Land use map
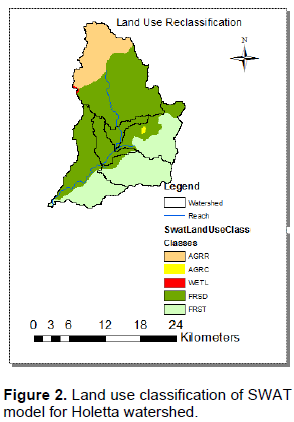
The land use map of Awash basin was clipped and dissolved in Holetta River catchment. Then, the clipped land use map was used for SWAT land use reclassification. According to SWAT land use classification, the catchment has five categories. These are, Agricultural Land-Row Crops (AGRR) with an area of 13.54%, Agricultural Land-Close-Grown (AGRC)- 0.17%, Wetlands-Mixed (WETL)- 0.14%, Forest-Deciduous (FRSD)- 57.26% and Forest-Mixed (FRST)- 28.9% (Figure 2).
Soil map
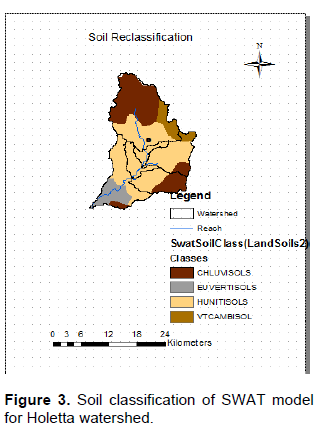
The soil map of Awash basin was clipped and dissolved in Holetta River catchment. Then, the clipped soil map was used for SWAT soil reclassification. Based on SWAT reclassification, the catchment has four soil categories. These are Chromic Luvisols (Chluvisols) with an area of 33.26%, Humic Nitisols (Huntisols) with an area of 56.57%, Vertic Cambisols (Vtcambisol) with an area of 1.71% and Eutric Vertisols (Euvertisols) with an area of 8.27% (Figure 3).
Meteorological data
One of the meteorological stations (Holetta) was found inside the catchment. The other meteorological stations, which were found outside the catchment, were Addis Alem, Kimoye and Welenkomi. The meteorological data measured from Holetta station were rainfall, maximum and minimum temperature, relative humidity, wind speed and sunshine hour. All the other meteorological stations were used for only rainfall data. The consistency, homogeneity and outlier test for the data was performed by using Excel software and XLSTAT software. The percentage of missing data for rainfall was 14% at Addis Alem station, 13% at Kimoye station, 1% at Holetta station and 18% at Welenkomi station. Therefore, missing data were filled from observations at the three nearby stations by using the normal ratio method. The normal ratio method is a better method than the arithmetic mean method and is usually applied when the normal annual precipitation at the site with the missing record differ by more than 10% of the normal annual precipitation at the other sites where the concurrent data are available (Chow et al., 1988).
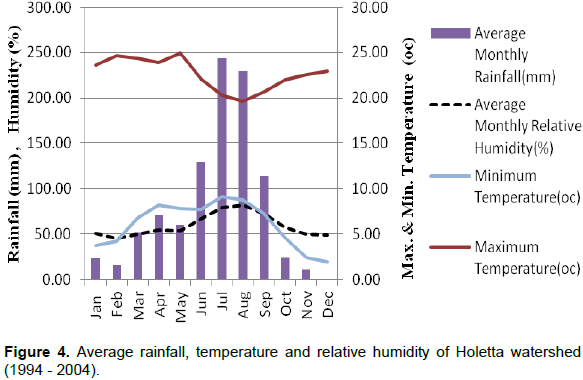
The climate data obtained from Holetta station showed that the air temperature in the area ranges from 6 to 23°C. The mean maximum temperature was 25°C. Based on meteorological data from 1994 to 2004, the mean monthly relative humidity value varied from 45 to 85% (Figure 4).
Flow data
The Holetta River is a tributary of the larger Awash River, which joins it after travelling about 25 km downstream of the gauging station. The Holetta River is the main source of surface water in the study area. The river was gauged since 1975 and for this study, the 1994 - 2004 time series of the river discharge data was used. The daily flow data in million cubic meters from gauging station was used for sensitivity analysis, model calibration (1994 – 1999) and validation (2000 - 2004).
Figure 4 shows that there is relatively intensive rainfall during June to August with the highest mean monthly rainfall recorded in July - 243 mm. In all other months, there were only meager or almost zero rain fall.
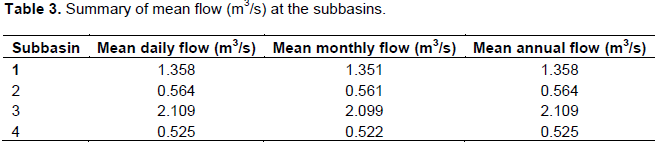
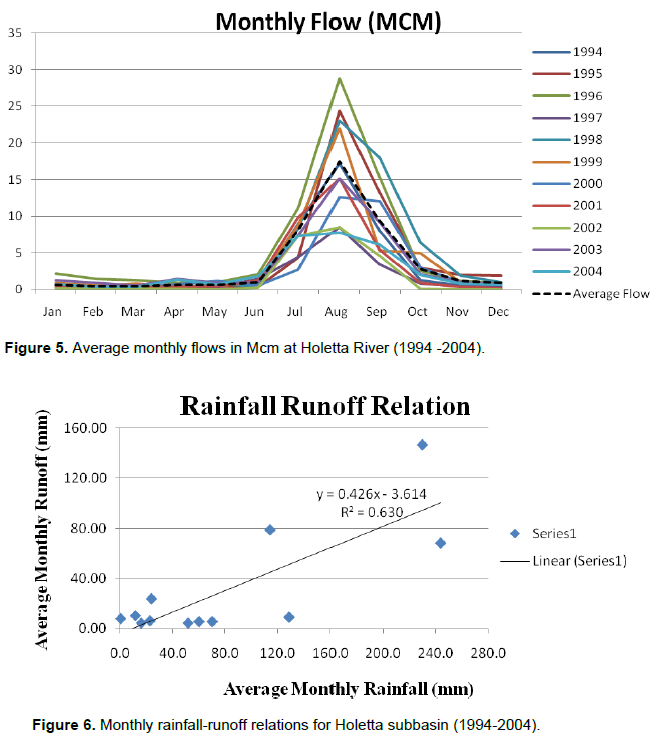
The average annual river flow at Holetta River was 44 Mcm. The flow was low from January to May and it started to increase at June. The peak flow was 17 Mcm, which occurred in August, and the minimum flow was 0.524 Mcm in February (Figure 5). Both Figures 4 and 5 have the same pattern and the river flow rises in the same season when the rainfall increases. The rainfall runoff relation showed that there was a positive relation between rainfall and surface runoff in the watershed (Figure 6).
SWAT data preparation and model setting
First new SWAT project was set up and saved, and then watershed delineation was performed. In order to delineate the watershed, automatic watershed delineation was selected. Then, the DEM was added and stream network was defined. Finally, the watershed outlet was selected to delineate the basin. The next step in setting up a watershed simulation was to divide the watershed into subbasins. The subbasins possess a geographical position in watershed and they are spatially related to one another. In this study, the DEM of Awash basin was used to delineate the watershed. Once the subbasin delineation is completed, the user has the option of modeling a single soil, land use and management scheme for each subbasin or partitioning the subbasins into multiple hydrological response units (HRUs). Hydrological response units are portion of a subbasin that possesses unique land use, management and soil attributes. A subbasin will contain at least one HRU, a tributary channel and a main channel or reach. Hydrological response units are used in most SWAT runs because they simplify a run by lumping all similar soil and land use areas into a single response unit and it will increase the accuracy (Neitsch et al., 2004).
After that, land use/soil/slop definition and HRU definition was performed by using the land use and soil map in combination with look up tables. By using these data, SWAT classified the watershed. Then, writing of input tables was continued by defining weather data. The first step to proceed was to define the weather generator data. To define the weather generator data, the user weather station was created through edit SWAT database section. Then, the weather station parameters were fitted in the new station.
In order to prepare the station parameters, different software were used. These are WGNmarker4.Xlsm, dew.exe and pcpSTAT.exe. WGNmaker4.Xlsm was used to calculate the weather station statistics needed to create user weather station files. The program dew.exe was used to calculate the average daily dewpoint temperature per month using daily temperature and humidity data. The program pcpSTAT.exe was used to calculate statistical parameters of daily precipitation data used by weather generator of SWAT model (Stefan, 2003). Then, SWAT weather generator to fill in missing information and to simulate weather data was used to arrange the data. To finalize the weather writing part, all sections written in the weather-writing window were selected and then all the watershed data was written and the model was made ready to be run. Once the model was run with default parameter setting, the sensitivity analysis and calibration was performed. The sensitivity analysis was performed by selecting the SWAT simulation, subbasin, sensitivity parameters and observed data. In this study, manual calibration was used. This was done by changing the sensitive parameters manually until the simulation was better fit with the observed data.
Sensitivity analysis
Sensitivity analysis explores how changes in parameter values affect the overall change in the output of the model. This can be done by using simple sensitivity analysis, where only one parameter is changed or more complex arrangements that explore the relationships between multiple parameters. Thus, a sensitivity analysis for SWAT model was performed for the entire data (1994 -2004). Then, the most sensitive parameters was identified and used for calibration of the model.
Model calibration and validation
After sensitivity analysis was carried out, the calibration of SWAT model was done manually. The calibration was carried out using the output of the sensitivity analysis of the model and by changing the more sensitive parameter at a time while keeping the rest parameters constant. The analysis of simulated result and observed flow data comparison was considered daily and monthly. The calibration was performed until the best-fit curve of simulated versus measured flow was obtained. The sensitive parameters were adjusted based on the allowable range until the best fitting value was found.
In this process, model sensitive parameters varied until recorded flow patterns were accurately simulated. For this study, the calibration was carried out for six years (1994 - 1999) with one-year warm up period and it was done based on the result of sensitivity analysis. Then, validation of SWAT model was performed for the next five years (2000 -2004).
Model evaluation
The SWAT model performance was evaluated by using statistical measures and graphical methods of comparing simulated with observed data. The goodness-of-fit statistics was used in describing the model’s performance relative to the observed data. These statistical measures used during the calibration and validation periods were the coefficient of determination (R2), Nash-Sutcliffe Efficiency Coefficient (NSE), and Index of Volumetric Fit (IVF) between the observations and the final best simulations.
Runoff estimation
The Holetta catchment was divided into six subbasins. Only one of the subbasin which is found in the upper part of the catchment was gauged. The calibration and validation of SWAT model was performed at subbasin 1. Then, regionalization approach was used to estimate runoff for the ungauged subbasin's of the catchment.
Watershed delineation and determination of HRUs
In this study, a multiple HRU definition with a threshold value of 15% for land use, 20% for soil class, 5% for slope were given and as a result, 33 HRUs were identified.
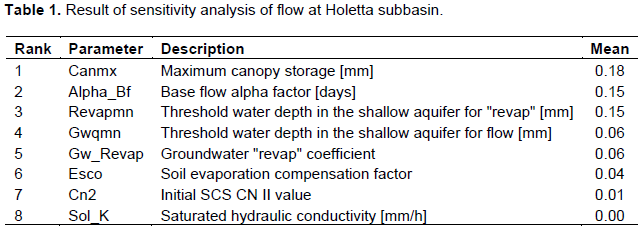
Sensitivity analysis
Among these 26 parameters, eight had more effect on the simulated result when changed. Based on the result of sensitivity analysis, Table 1 shows the most sensitive parameters for the watershed. Then, these parameters were used for calibration.
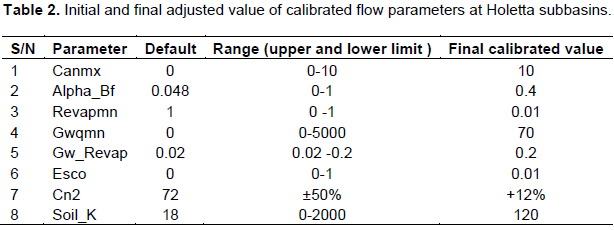
Model calibration
In this study, the calibration of SWAT model was done manually and Table 2 shows the initial/default and finally adjusted parameter value.
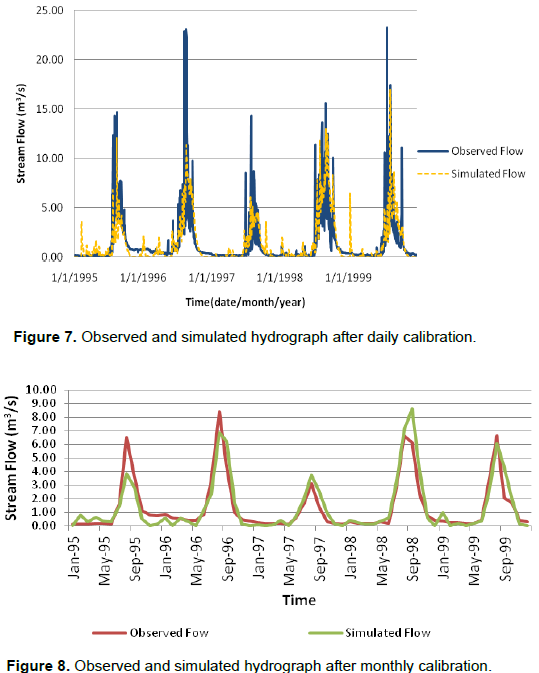
Figures 7 and 8 shows the daily and monthly graphical performance evaluation of SWAT model during calibration period, respectively. Both the daily and monthly graphs implied that the model simulation is best fitted with the observed flow measurement. During some years on daily bases, it was shown that the model did not exactly capture the peak values, which is because the catchment has only one gauging station and fail to represent the rainfall for the whole area.
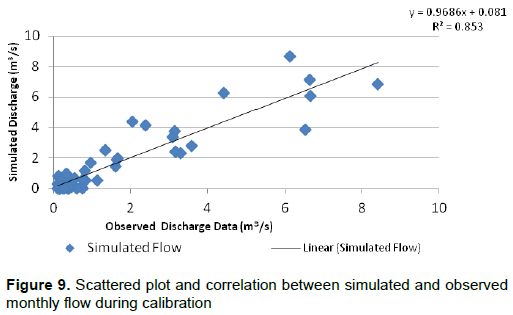
The daily calibration result showed that the regression coefficient (R2) was 0.57; Nash-Sutcliffe Efficiency Coefficient (NSE) was 0.55 and Index of Volumetric Fit (IVF) was 102.62%. In addition, based on monthly calibration, the result showed that the regression coefficient (R2) was 0.85; Nash-Sutcliffe Efficiency Coefficient was 0.84 and Index of Volumetric Fit was 102.8% (Figure 9). These indicated that the model performance was very good and highly acceptable.
Model validation
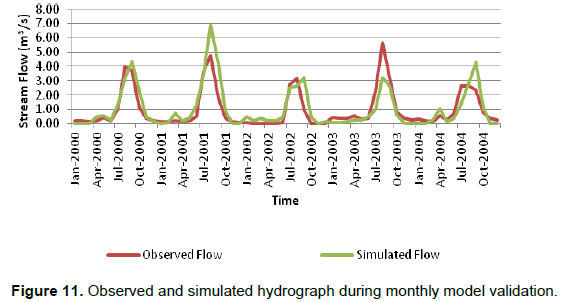
Figures 10 and 11 showed the daily and monthly graphical performance evaluation of SWAT model during validation period respectively. Both the daily and monthly graphs implied that the model simulation is best fitted with the observed flow measurement.
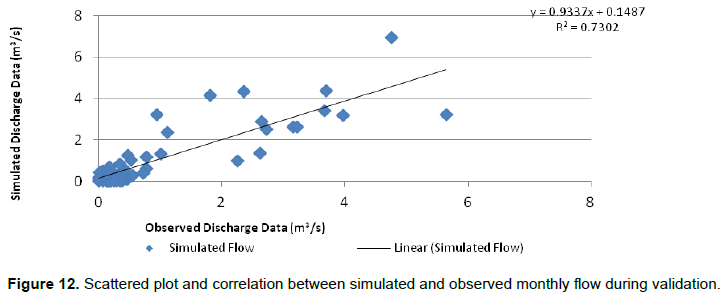
The three goodness-of-fit measures were also calculated for the validation period. The daily calibration result showed that the regression coefficient (R2) was 0.44; Nash-Sutcliffe Efficiency Coefficient (NSE) was 0.4 and Index of Volumetric Fit (IVF) was 108.9%.In addition, based on the result of monthly validation, the regression coefficient was 0.73; Nash-Sutcliffe Efficiency Coefficient was 0.67 and Index of Volumetric fit was 108.9% (Figure 12). These results indicated that the model performance was good in the acceptable limit.
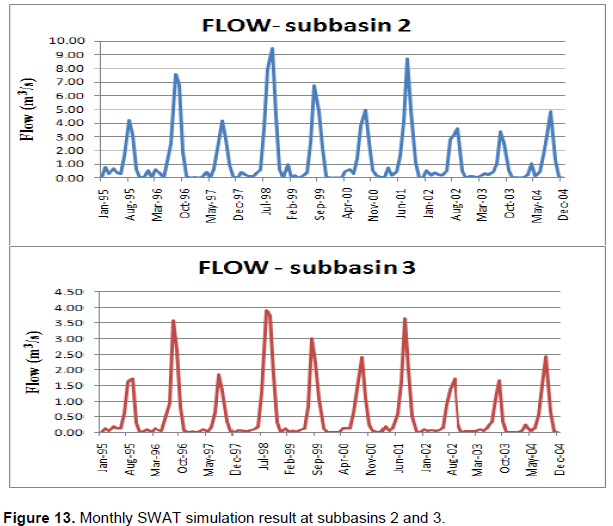
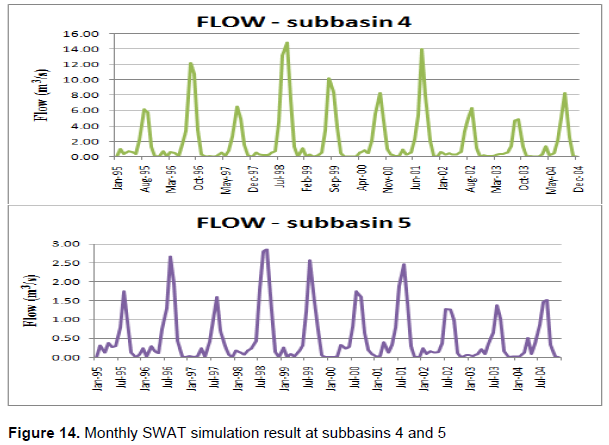
Runoff estimation for Holetta catchment
In this study, spatial proximity method was used to estimate runoff at subbasins 2, 3, 4 and 5 where majority of the users are located. Figures 13 and 14 showed the monthly simulation result of SWAT model at the subbasins.
The mean flow (m3/s) that was simulated by SWAT model at the subbasin 2, 3, 4 and 5 is shown in Table 3.
CONCLUSION AND RECOMMENDATION
This study was conducted to estimate runoff at Holetta catchment and to model rainfall runoff relation in the area. The rainfall runoff process of the catchment was modeled by SWAT. According to SWAT classification, the watershed was divided into 6 subbasins and 33 hydrological response units (HRUs). Only subbasin one was gauged which is found in the upper part of the area. Therefore, sensitivity analysis, calibration and validation of the model were performed at this subbasin and then the calibrated model was used to estimate runoff for the ungauged part of the catchment. The result of sensitive analysis showed that 26 parameters were sensitive; out of 26, eight were the most sensitive ones. These parameters were used for model calibration.
The performance of the model was evaluated by statistical and graphical method. The statistical methods used were coefficient of determination (R2), Nash-Sutcliffe Efficiency Coefficient (NSE) and Index of Volumetric Fit (IVF). The result showed that R2, NSE and IVF were 0.85, 0.84 and 102.8, respectively for monthly calibration and 0.73, 0.67 and 108.9, respectively for monthly validation. Therefore, this indicated that SWAT model performed well for simulation of the hydrology of the watershed. Then, the calibrated model was used to estimate runoff for the ungauged part of the catchment, that is, subbasin 2, 3, 4 and 5.
SWAT model was used to estimate runoff at Holetta catchment and the performance was evaluated based on statistical and graphic methods. Even though the model performance was good, the accuracy was highly dependent on quality of data. The Holetta catchment has only one gauging point and the total area is 403.47 km2. Therefore, in order to improve data quality, it is better to increase the gauging station in the catchment. In addition to this, in poorly gauged areas, use of satellite data is very advantageous.
The SWAT model performed well for simulation of the hydrology of the watershed, therefore it can be used for further study to estimate sediment yield in the area and to evaluate the effect of different catchment changes on the river.
The authors have not declared any conflict of interests.
REFERENCES
|
Assefa A, Melesse AM, Admasu S (2014). Climate change in upper Gilgel Abay river catchment, Blue Nile Basin Ethiopia, In: Melesse AM, Abtew W, Setegn S (eds) Nile river basin: ecohydrological challenges. Clim. Change Hydropolitics pp. 363-388.
|
|
|
|
Arnold JG, Sirinivansan R, Muttiah RS, Williams J (1998). Large area hydrologic modeling and assessment, Part 1: Model development. J. Am. Water Resour. Assoc. 34(1):73-89.
Crossref
|
|
|
|
|
Behulu F, Setegn S, Melesse AM, Fiori A (2013). Hydrological analysis of the upper tiber basin: a watershed modeling approach. Hydrol. Process 27(16):2339-2351.
Crossref
|
|
|
|
|
Behulu F, Setegn S, Melesse AM, Romano E, Fiori A (2014). Impact of climate change on the hydrology of upper Tiber river basin using bias corrected regional climate model. Water Resour. Manage. pp. 1-17.
|
|
|
|
|
Chow VT, Maidment DR, Mays LW (1988). Applied Hydrology, Mc Graw Hill Book Company, ISBN 0-07-010810-2.
View
|
|
|
|
|
Dessu SB, Melesse AM (2012). Modeling the rainfall-runoff process of the mara river basin using SWAT. Hydrol. Process 26(26):4038-4049.
Crossref
|
|
|
|
|
Dessu SB, Melesse AM, Bhat M, McClain M (2014). Assessment of water resources availability and demand in the mara river basin. CATENA 115:104-114.
Crossref
|
|
|
|
|
Getachew HE, Melesse AM (2012). Impact of land use/land cover change on the hydrology of Angereb watershed, Ethiopia. Int. J. Water Sci. 1(4):17.
|
|
|
|
|
Grey OP, Webber DG, Setegn SG, Melesse AM (2013). Application of the soil and water assessment tool (SWAT model) on a small tropical island state (Great River Watershed, Jamaica) as a tool in integrated watershed and coastal zone management. Int. J. Trop. Biol. Conserv. 62(3):293-305.
|
|
|
|
|
Mohammed H, Alamirew T, Assen M, Melesse AM (2015). Modeling of sediment yield in Maybar gauged watershed using SWAT, northeast Ethiopia. CATENA 127:191-205.
Crossref
|
|
|
|
|
Neitsch SL, Arnold JG, Kiniry JR, Srinivasan R, Williams JR (2004). Soil and Water Assessment Tool Input/ Output file Documentation. Texas Water Resources Institute, Collage Station, Texas.
View
|
|
|
|
|
Neitsch SL, Arnold JG, Kiniry JR, Srinivasan R, Williams JR (2005). Soil and Water Assessment Tool Theoretical Documentation. Texas Water Resources Institute, Collage Station, Texas.
View
|
|
|
|
|
Setegn SG, Melesse AM, Haiduk A, Webber D, Wang X, McClain M. (2014). Modeling hydrological varibility of fresh water availability in the Rio Cobre watershed, Jamaica. CATENA 120:81-90.
Crossref
|
|
|
|
|
Stefan L (2003). a) Program pcpSTAT, user's manual. b) The Programs dew.exe and dew02.exe, user's manual. Berlin.
View
|
|
|
|
|
Wang X, Melesse AM (2006). Effects of STATSGO and SSURGO as Inputs on SWAT model's snowmelt simulation. J. Am. Water Resour. Assoc. 42(5):1217-1236.
Crossref
|
|