ABSTRACT
Shambu town has faced a problem of potable water supply, still large number of people did not have access to adequate amount of potable water and frequent water interruption is a common problem. The objective of this research was to evaluate the existing water pressure map and water demand. To achieve this goal, the following input data were collected, base population, growth rate, and pressure map of the area, water production data, and reservoir data. The pipe network and junction network system was simulated to understand its behavior for different inputs using EPANET 2.0. The results showed that the water pressure were not feasible enough to provide adequate water. Replacing the appropriate diameters to the distribution as well expanding the distribution network in necessary engagements, the total water demand was projected to be 567648 m3/year or 18 L/s and the total water supply was estimated to be 252288 m3/year or 8 L/s. Only 44% of the population was covered by water supply .Thus, use of ground water, or boreholes with an estimated yield of 8 L/s are to be drilled.
Key words: EPANET, water demand, water supply, distribution network.
Water is a natural resource without which all living things cannot exist. This is so because 70% of our planet, earth, is covered by water; though the world population is facing water scarcity. Many countries in both the developed and developing world face significant problems in maintaining reliable water supplies, and this is expected to continue in future years.
Growing populations and lack of available cost effective supply augmentation options make reliable estimates of residential water demand important for policy making (Dharmaratna and Harris, 2010). Problems of providing safe water supply to the urban poor in developing cities are increasing with the increase in population. As a result, demand for additional water sources and infrastructure is growing. Very often, urban poor are not the users of the existing water supply facilities satisfactorily.
Ethiopia’s population is now surpassing 100 million and is the second populous country in Africa next to Nigeria. As a result, reliable estimates of residential water demand, water source choice decisions and effects have become more important for policy making in the water supply sector.
Ethiopia is blessed with ample water resources. The country has 12 river basins with an annual runoff volume of 122 billion m3 of water and an estimated 2.6 to 6.5 billion m3 of ground water potential, which makes an average of 1575 m3 of physically available water per person per year, a relatively large volume.
However, distribution and availability of water is erratic both in space and time. Hence, despite the abundance, the country is highly water-scarce (Seleshi, 2006). Of the total water resources available to Ethiopia, only 9% remains in the country; the bulk flows downstream to neighboring countries, and is particularly important for Somalia, Kenya, Sudan and Egypt (World Bank, 2006; Seleshi, 2006).
Furthermore, the mountainous nature of the topography, the uneven spatial distribution of the surface water and increasing seasonal variability have limited the utilization of the fresh water resources and thus Ethiopia is projected to become a water-scarce country during the 21st century (USAID, 2003). Provision of safe and adequate water contributes to better health and increased individual productivity (Israel and Awdenegest, 2012).
In order to ensure the availability of sufficient quantities of good quality water to the increased population of the country, it becomes imperative, to evaluate the technical performance of existing schemes by using computer software such as EPANET that can be easily accessed to evaluate the performance of the water pressure and water quality simulation. Even though, the software can help to evaluate water pressure map and water quality simulation, this paper focused only on the water pressure map evaluation due to time and budget constraints. Therefore, the scope of this research was limited to water supply distribution and water demand prediction.
In addition, the present and future population projection should be done to design and build suitable water supply schemes which will provide potable water to the various sections of the community in accordance with their demands. The Ethiopian water supply system fails due to inappropriate design of the system and lack of population projection when designing water supply. Most of the projects were implemented by considering only the existed population. The pipe installations, did also not consider the population pressure.
As the authors’ experience of the area for 10 years, acute water shortages were experienced in the study area. Residents adopted various coping strategies notably the use of ground water and drilling boreholes. Some residents had to walk for long distance and queue the whole day to get water from the surrounding source. Still no reseach was conducted in the area on evaluation of supply and demand. Therefore, this study was initiated to contribute a research idea by filling this gape.
The objectives of this research were (1) to evaluate existing water pressure map and (2) to forecast the water demand for the next ten years.
Study area description
Location and relief
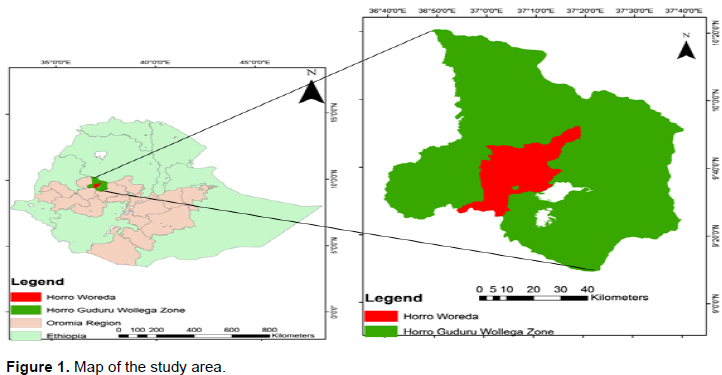
Shambu town is geographically located at latitude of 9° 38 N and longitude of 37° 4’E. It is found at a distance of about 325 km from Addis Ababa. Shambu is bounded by Kombolcha Chancho, Laku Higu, Haro Shote, and Tenno Peasant Associations. The area under study is having an average altitude of 2400 m above sea level. The mean annual temperature is 15.7°C; the mean monthly rainfall is 126.4 mm and the mean annual rainfall of 1543.4 mm (Figure 1).
Existing source of water supply
The source for the existing water supply system since its establishment is deep ground water. At present, there are two boreholes drilled by government organizations and spring and bore holes were also implemented. Because of the absence of electric power system in the town, so far generators are used as a source of electric power for the pumps at boreholes. The pumping station located in a place called FinchDebsa which produces 432 m3/day and the spring and boreholes produces 259 m3/day amount of water productions. At the existing condition, the town has a total water production of 691 m3/day to be supplied to the Shambu town.
There are two reservoirs currently serving the town. The first reservoir serving Old Shambu is a steel reservoir having 25 m3 capacity and is 6 m elevated. The second reservoir serving the New Shambu is a circular concrete ground reservoir having 50 m3 capacities. As to the rising main, there are two main lines, one directed to a 25 m3 steel elevated reservoirs and the other to a 50 m3 ground reservoirs. From the two existing reservoirs, water is supplied to the distribution system by gravity. The distribution system is constructed with galvanized steel pipes the sizes of which vary between 3 and 1 inches.
Population
Based on the projection done by CSA (2007), the town has a total population number of 36,584 by the year 2015 from which 17,303 are men and 19,281 women with an average family size of 4 persons per house. The average population growth rate of the region was taken for the predication of Shambu town population for the year 2025.
Data collection and methodology
Data collection
Both primary and secondary data were collected, including, population data, water pressure map of the area, volume of water delivered, reservoir data, pipe size pipe length, pumping hour, elevations, and pipe diameter. The demand was obtained after considering the population of the study area as 36584, also the study area falls under the category of urban settlement. As a result of this development, the standard from the Federal Ministry of Water Resources manual on water demand was used. For this research, 180 L/capital/day was considered.
Methodology
Water pressure
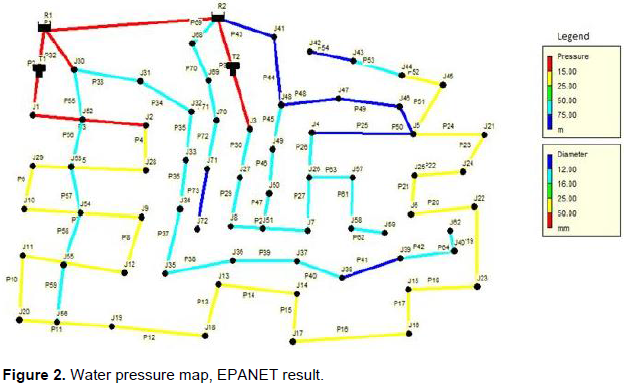
The water demand at particular junction was obtained by dividing (the total population by the number of junctions and multiplying by 180 L/capital/day. After that, the following steps were carried out to analyze the water distribution network. Draw a network representation of the distribution system or import a basic description of the network. Edit the properties of the objects that make up the system. The (X, Y, Z) coordinates in each junction, the length of the pipes between each junction, and the node elevation, were all collected by using the existed pressure map of Shambu town and some missed values from the map were obtained by the help of geographical positioning system (GPS instrument) and analyzed by using Epanet-2 software (Figure 2).
Water demand and population projection
Water demand
The per capital water demand of urban areas varies depending on population size, economic, social and climatic factors as well as mode of service of the town (MoWR, 2006). Three mode of service were identified for domestic water consumers of Shambu town. These are yard connection (YC), house connection users (HCU) and public tap users (PTU). The rate established for Oromia region were used to forecast the population of Shambu town. Population and water demand projection were done making use of the geometric growth rate method with base population as recorded by CSA and depending on the existing demand of water. This method is mostly applicable for growing towns and cities having vast scopes of expansion (Bradley, 2004.). The geometric growth method is given by:
where P=projected population, P0=base population, r=annual growth rate in percent, and n=number of years (annual rate of growth).
The water demand is projected for design period based on the following assumptions. There is no water shortage (water source is sufficient). The people have the ability to pay for the service. There is breakdown of population between the various standards of supply like house connection, yard connection, and public taps.
Other water demands
These water demands include non-domestic water demand, fire-fighting water demand, non-revenue water demand and industrial water demand. For all cases of percentage water demand in this research, the standard set by Ministry of Water Resource 2006 was considered to take the percentage of each demand category from the domestic demand.
Data analysis tools
Water supply distribution system was analyzed using EPANET-2 software. To generate pressure map, surfer-8 software was applied. The water demand was analyzed using Microsoft excel and presented using graphs.
Water pressure map
The result showed that the water pressure in some of the junctions and pipes were not functional and not working according to the standard set by MoWR (2006) which states that for adequate water supply, the water pressure should be between 15 and 70 m for Ethiopian condition. As a result, the residents accessed water only twice a week or once a week only for a few hours. In places like Wollega Sefer, Jerba Sefer, Adebay, Mogn Sefer and around Medhanialem area (indicated by the red color), the pressure of the water could not be delivered to the community properly. There was negative pressure generated from the result (indicated by blue color). This indicated that during the design of water supply system, diameter of the pipe, length of pipe, topography of the area and population settlement were not considered. During field observation and interview with the community, it was also confirmed that people who lived at higher topography suffered from continuous water interruption than those who lived at lower topography.
Population and water demand projection
Population projection
According to CSA (2007), the base population of the town was 36,584 in the year 2015. The population estimation of the town for the year 2025 was projected by using (p=36, 584, n=10, and r=4%) (Equation 1) which resulted in 54,153 total population numbers.
Water demand projection
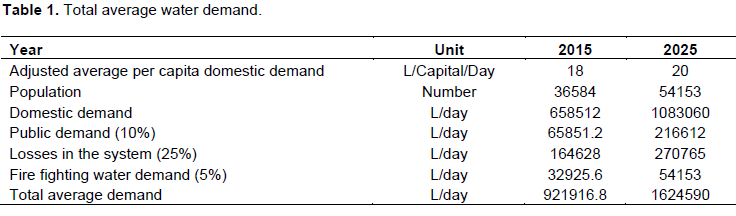
The water demand was calculated by taking into account the different categories and per capital demand standard set by WHO (2006). The result showed that by the year 2025, the average water demand was estimated to be 1625 m3/day (Table 1).
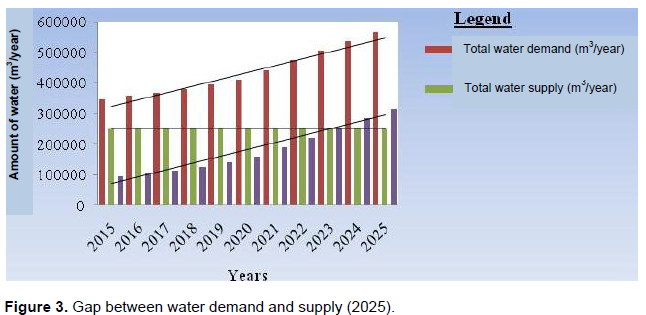
Comparison of water demand and supply
Figure 3 revealed that there was a big difference in water demand and supply of water that is being delivered to the Shambu town community. Series of water supply problems will happen during the year 2025 unless some problem solving mechanisms are designed.
Determination of required number of bore holes
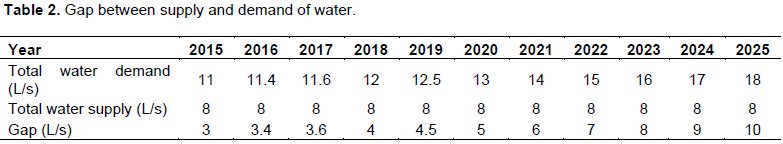
The result revealed that at the end of the design period, the water demand was estimated to be 18 L/s. The ground water source investigations previously studied at the site indicated that from existing well sites, there was a possibility of abstracting ground water at an average rate of 8 L/s. Therefore, there was deficiency of 10 L/s of water that must be designed to satisfy the water demand of the population by the year 2025 (Table 2).
The result of EPANET showed that at some parts of the study area, there was a serious water supply problem. The main reasons for the inadequate delivery of water to those areas where the topography is a bit higher, the water has no power to reach to the top (Lansey et al., 2014).
Moreover, the following situations were observed in the distribution pipe line network which could cause inadequate supply of water to the area. It was observed that the pipes connected to the tanks as distribution pipes to the other pipes have smaller diameters. It was also observed that the network on the topographical map did not have a wider coverage of water distribution to some parts of the area; this as well, can cause water crisis as a result of rapid expansion of the area. Similar research was done by Vipinkumar et al. (2015). It was observed that the pipes connected to the tanks as distribution pipes to the other pipes have smaller diameters. Comparison of these results indicates that the simulated model seems to be reasonably close to the actual network.
To alleviate the problem of inadequate water pressure, Re analysis of the EPANET was under taken by the researcher. By changing the pipe diameter from 12 to 16 mm and making the tanker always at full level or improve the tanker elevation from 6 to 8 m showed that there was satisfactory pressure set by the Ethiopian standard of water at these low water pressure areas. The result was supported by Kassa (2015) who has found out that when the height of the tanker was increased by some height, satisfactory water pressure was generated. Replacing the appropriate diameters to the distribution main as well expanding the distribution network in order to obtain a proper coverage in the area, will save the consumers in having the water shortages. About 44% of the population in Shambu is covered by the town’s water supply from different types of sources. However, the service that the population is receiving is very poor. Thus, considering the use of ground water, 3 boreholes with an estimated yield of 8 L/second was recommended to be developed for water demand of 18 L/second despite the fact that the actual safe yield of each production borehole determines the ultimate number of boreholes to be drilled. Therefore, discharge should be increased to achieve the base demand. The quantity of fresh water available is sufficient to satisfy the need, but the real problems lie in the supply chain. Disruptions in this supply chain can result from strained and undeveloped infrastructure or deliberate interferences in water supply. This can pose difficulties in finding solutions to increasing population pressures.
This research work concluded that the water supply system of Shambu town has now serious problem to give satisfactory service to the community due to a number of reasons such as the system covers only very small area of the town despite the large size of the population, insufficient budget allocation to upgrade the system and cover organizational matters and lack of skilled manpower for the maintenance of generators, wells, and installed pumps. Re-analysis of pressure map of the water by changing the diameter of the pipe and relocating the tanker elevation improves the water supply to rich with adequate pressure to those low water pressure areas.
The water demands of Shambu town exceed supply by about 44% and its water supply distribution network reaches only about 35% of the capital. More than half of its population has less than 2 h of water service a day and has no service at all according to the standard set by WHO guideline. On account of the vital role of water to socio-economic life of humans, the author recommended an overall involvement of the private sector, the public sector, women, the local inhabitants, and the donor institutions to play their supportive roles in the improvement of the provision of water to the urban dwellers in the study area.
The authors have not declared any conflict of interests.
REFERENCES
|
Bradley RM (2004). Forecasting Domestic Water Use in Rapidly Urbanizing Areas in Asia. J. Environ. Eng. 130(4):465-471.
Crossref
|
|
|
|
CSA (2007). Summary and statistical report of the 2007 population and housing census. Ethiopia: Addis Ababa.
|
|
|
|
|
Dharmaratna D, Harris E (2010). Estimating residential water demand using the Stone Geary functional form: the case of Sri Lanka, Discussion paper, 46/10, Department of Economics, and Monash University.
|
|
|
|
|
Israel D, Awdenegest M (2012). Assessing water quality of rural water supply schemes as a measure of service delivery sustainability: A case study of WondoGenet district. Southern Ethiopia Afr. J. Environ. Sci. Technol. 6(5):229-236.
|
|
|
|
|
Kassa M (2015). Assessment of Water Supply and Sanitation: The Case of Embacho Town, Gidan Woreda, Northern Ethiopia. Sci. Technol. Arts Res. J. 4(2):259-262.
Crossref
|
|
|
|
|
Lansey KE, Duan N, Mays LW (2014). Water Distribution System Design under Uncertainties. ASCE J. Water Resour. Planning Manage. 115(5):630-645.
Crossref
|
|
|
|
|
MoWR (2006). Ministry of Water Resources Water Sector Development Program; Main Report, Volume 1. Ethiopia, Addis Ababa.
|
|
|
|
|
Seleshi B (2006). Assessment of water resources and recommendation to improve water resources management, Ref. Adaa Pilot Learning Site of the project Improving Productivity and Market Success of Ethiopian Farmers, Oromia, Ethiopia. Final Draft Report, 2006, (IWMI).
|
|
|
|
|
USAID (2003). Ethiopia Drought Facts Sheet Number 9. USAID, Ethiopia, Addis Ababa.
|
|
|
|
|
Vipinkumar GY, Darshan M, Sahita IW (2015). To assess theprevailing Water Distribution Network using EPANET. 02:08 | Nov-2015.
|
|
|
|
|
World Bank (2006). Global Economic Prospects. Economic Implications of Remittances and Migration. World Bank, Washington, D. C.
|
|
|
|
|
WHO (2006). Meeting the MDG drinking water and sanitation target: the urban and rural challenge of the decade. WHO, Geneva.
|
|