Full Length Research Paper
ABSTRACT
Farmers’ life without livelihood diversification into off-farm and non-farm income activities becomes difficult due to unstable and meagre agricultural context of the study area. Farm income alone cannot feed the ever increasing population. Hence, livelihood diversification is a matter of life or death for majority of the households in the study district. The objectives of the study were to identify household livelihood diversification options; to identify reasons why smallholder farmers need to diversify; and to analyze the implication of livelihood diversification strategies on smallholder farmers’ income. A multistage sampling technique was used to select the study area and 485 sample respondents. Data was collected using structured interview and key informants interview. The poor and less poor households’ livelihood diversification was primarily for survival whereas the objective of the better-off households was for better wealth accumulation. It was found that 43% of the overall annual income of the farmers comes from off-farm and non-farm activities. This implies that non-farm and off-farm activities have significant implication on improving farmers’ livelihood. Therefore, more efforts are required from the regional government on supporting livelihood diversification into off-farm and non-farm activities than sticking on the drought vulnerable, limited farm-land and rain dependent farm income.
Key words: Livelihoods, diversification strategies, income, Saesietsaeda Emba, Ethiopia.
INTRODUCTION
Africa as a continent is identified by subsistence farm households involved in livestock, crop or fish production as their main source of livelihood and in other non-farm income generating activities to augment their main source of income. Previous empirical studies found that rural residents across the developing world earn about 35 to 50% of income from non-farm activities and confirmed that more than 50% of income in rural farming communities in developing countries comes from non-farm sources (Haggblade et al., 2010; IFAD, 2010). In Ethiopia, empirical studies also indicate that non-farm income accounts for as much as 40 to 45% of average household income (Bezabih et al., 2010; Kassie, 2017). Furthermore, agriculture is highly dependent on weather patterns and given the very high number of people depend on rain-fed agriculture in sub-Saharan Africa (SSA) (FAO, 2015). Any impacts of climate change may potentially affect all aspects of food security, including food availability, access, utilization, and stability (Challinor et al., 2010; IPCC, 2012; 2014).
In many parts of Ethiopia including the study district in particular, agriculture is plagued with problems of soil infertility, drought, erratic rainfall, seasonal migration, risks of climatic uncertainty, and the challenge of feeding the rapidly growing population of the country. Contrary to this, the government of Ethiopia often believe that agriculture on its own could achieve the goals of poverty reduction by raising agricultural productivity continuously overtime. However, given the context of the study area which is drought prone and high rain fed dependence coupled with the ever increasing population and limited cultivable farm-land, agriculture by its own cannot provide the means of poverty alleviation and improving household livelihood. Thus, smallholder farmer’s livelihood diversification of income sources is necessary to cope with increasing vulnerability associated with agricultural production through diversification and/or moving out of farming into non-farm income sources.
It is against this backdrop this study was undertaken if smallholder farmers need to participate in other off-farming and/or non-farm productive economic activities to enable them generate better income for their sustainable livelihood. This is very important to protect and improve the livelihoods of the poor and to ensure food security at household level, although the motivations and outcomes may vary significantly (FAO, 2015). It is also understood that different households adapt different livelihood strategies according to their particular asset and asset status (Barrett et al., 2001, Ellis, 2000; Gebru and Beyene, 2012), and the prioritized objective they have. In fact, access to natural and man-made resources is also different from place to place and determines the capacity of the household on which livelihood diversification strategy to choose and apply. For this research, smallholder farmer’s income livelihood diversification strategies were the main focus. For the poorest, who have the least capacity to effectively manage risk, diversification may be a response to constraints imposed upon them by increasing climate risk and unstable farm income. In this sense they are pushed into diversification by lack of alternatives for risk coping and it is necessary for their survival. In contrast, wealthier households may be pulled into diversification by the existence of welfare increasing diversification options as well as their own capacity to access the better income generating non-farm activities (Eshetu and Mokonnen, 2016; FAO, 2015 Loison, 2015, Khatun and Roy, 2016).
Before now, location and context specific understandings of what exactly constitutes the choices and needs of livelihood diversification strategies and its implication on-farm households income were lacking. Here, relative community based wealth ranking criterion was used in selecting poor, less poor and better off sample households. Because, households’ wealth status has a pivotal role in household’s choice and practice of better income earning livelihood strategies and then able to improve their standard of living. Therefore, the objectives of the study were: (1) to identify household livelihood diversification options by their community based relative wealth ranking; (2) to assess the main reasons why smallholder farmers need to diversify into off-farm and non-farm livelihood strategies; and (3) to analyze the implication of household livelihood diversification strategies on smallholder farmer’s income.
RESEARCH METHODS
The study area
The study was conducted during the year 2016/2017, in Saesietsaeda Emba district, Eastern Zone of Tigray National Regional State of Ethiopia at about 883 km north of Addis Ababa (FDRE, 2011). The district has population size of 157,099, of which 73,997 are male and 83,102 are female (CSA, 2013). Of the total human population in the district, 26,853 (17.1%) and 130,246 (82.9%) are urban and rural dwellers, respectively (CSA, 2013). Economy of the study district largely depends on how its smallholder farmers perform. The average farm size is approximately less than 0.5 ha, which is too small to achieve food self-sufficiency. The agro-ecology of the district experiences semi-arid climate which is characterized by spares and irregular rainfall, low vegetation cover, poor quality of soil fertility and severe degradation, and highly drought prone area (FDRE, 2011). The district receives an average annual rainfall ranging from 350 to 500 mm and temperature ranging from 13 to 20°C. There is a single cropping season lasting between late June and August, and a dry season that spans between September and June. The predominantly unimodal rainfall from June to August is characterized by high temporal and spatial variability (CSA, 2013).
Types and methods of data collection
The study used multi-stage sampling, a combination of purposive, stratified, systematic random and proportional sampling techniques to select the study area and sample respondents. The study district, Saesietsaeda Emba, was purposively selected from the seven districts in Eastern Tigray region of Ethiopia. This is because of its drought proneness (FDRE, 2011), high population pressure, land degradation, high cultivable land scarcity, existence of high out-migration, prevalence of food insecurity and dependence on food aid programmes (FDRE, 2011). Of the total twenty five rural Kebele administrations (KAs) (lowest administrative unit in Ethiopia), five namely Sewne from low-land, May-Megelt and Sendeda from Middle land, and Hawile and Raele from High land agro-ecological zones were selected using stratified sampling technique. In addition, community based relative wealth ranking criteria was used in selecting the relatively better off (n=130), less poor (n=177) and poor (n=178) sample households.
In fact, wealth status of the household is essential for households to choose and adopt certain livelihood diversification strategies and able to earn better income. Finally, 485 sample households were selected using proportional sampling followed by systematic random sampling technique from the five Kebele administrations of the study district.
Primary data was collected from the 485 households using structured interview triangulated with data collected from focus group discussion and key informant interviews. Head of the study district of agricultural office, extension experts, elders, model farmers and Kebele administration chairmen and representatives from NGOs working in the district were part of the focus group discussion. On the other hand, the secondary data were retrieved from relevant journals, books, conference proceedings and project reports.
Data analyses
Data were collected using structured interviews which were coded and processed using SPSS software version 20 for further analysis. Descriptive statistics such as percentage, frequency, mean, standard deviation, minimum, maximum, t-test and chi-square test were used for further an. Narrative/Content based analysis was also used to analyze qualitative type of data collected from key informant interviews and focus group discussion to enrich and illustrate qualitative conclusion.
RESULTS AND DISCUSSION
Community based wealth ranking of sample households in the study district
Relative community based wealth ranking was conducted to understand the wealth status difference among the better off, less poor and poor households in the study area. Because understanding wealth status of the household plays a vital role to clearly indentifying the reasons for why farm households need to diversify, who are diversifying their livelihood activities and why the others, and to know the crucial role of wealth played for smallholder farmers to choose and adopt certain livelihood diversification strategies and assess its implication on improving households income.
Farmers in the study area have their own relative community based wealth grouping criterion. For instance, the better-off households are those who are more food secure at least for ten months and above, own greater than 0.5 ha of farm land, have access to irrigation, better annual income and diverse sources of income (e.g. get regular remittance income that can be used for economic resilience to drought). They have also access to market centre, have collateral capacity to access credit from relatives and formal saving and credit institutions, have strong social network or bond with different groups of people, able to save money in bank, own more than eight tropical livestock unit (TLU), own basic farm equipments, own quality house with permanent roofing (stone walled and zinc sheeting roofed house). In addition, they also own valuable household assets like TV, radio, bed, sofa, wives wear gold made jewellery weighing more than
45 gram, have access to electric city, have access to public clinic centres, able to send both their boys and girls above five years to school, have family members who have successfully completed their education and got employed; and have large size productive household members who can participate in diversified livelihood strategies.
On the other hand, the less poor households are those who are moderately food secure at least for six months, own less than 0.5 ha of farm land, have no access to irrigation, less annual income and diverse sources of income (e.g. do not receive remittance income regularly that can be used for economic resilience to drought). In addition to this, they have limited access to market centre, have no collateral capacity to access credit from formal saving and credit institutions, and have poor social network or bond with different groups of people. Further-more, less poor farmers were unable to save money in bank, own at least 4 tropical livestock unit (TLU) including oxen, own basic farm equipments, own stone walled and wood with soil roofed house), own household assets like radio but no bed, sofa, and their wives do not wear a gold-made jewellery. Besides, they have no access to electricity, have little access to public clinic centres, highly illiterate, unable to send all their sons and girls above five years equally to school, and may have family members who have successfully completed their education and but unemployed; and have large-sized dependent household members and participate in temporary, low return and unskilled labour based diversified livelihood strategies. They also have a serious lack of initial capital and business skills.
The poor households share all the characteristics of the less poor but differ in some points. Here, the poor are characterized by severe food insecurity and can only feed themselves for only less than 4 months at good production season. They are confronted with regular seasonal and transitional period of stress due to drought and low harvest, lack of rural job opportunities, have very limited access to protein and vitamin foods e.g. meat and forced to reduce the quantity and quality of their food type and meal frequency consumption. It is also clear the life of the poor household is regularly dependent on productive safety net program and emergency food aid programmes. Let alone to save many almost all they do not even have a personal bank account. They are people forced to diversify their livelihood income primarily for their survival and own less than 2 tropical livestock unit (TLU) and have less than 0.35 ha of farm-land and forced to reduce the quantity and quality of their food type and meal frequency consumption. It is also clear the life of the poor household is regularly dependent on productive safety net and emergency food aid programmes. Most of them do not even have accounts with any bank, let alone saving money in the banks. They are people forced to diversify their livelihood income primarily for their survival. In all, it does not mean all the better off households are food food secure. It is only relative comparison among the people made by the community based wealth criterion to know household asset ownership and status. Otherwise, the majority of the households are poor, food insecure and dependent on external support for their survival and will continue being dependent unless sustainable measures are taken. Moreover, using the aforementioned community based relative wealth ranking criterion, better off (n=130), less poor (n=177) and poor (n=178) sample households were selected for the purpose of this study.
Rural household livelihood diversification strategies
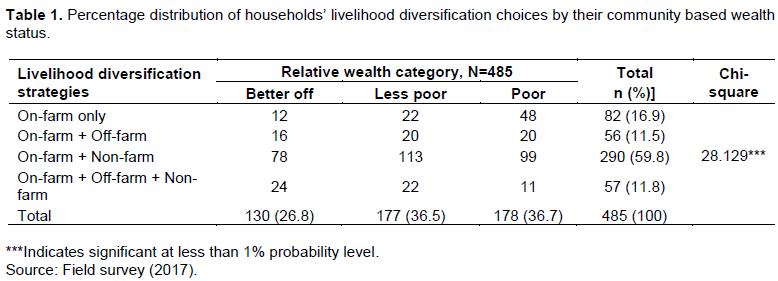
The study found out that about 1.5, 59.8 and 11.8% of the sample households were able to diversify into on-farm + off-farm, on-farm + non-farm and combination of on-farm + off-farm + non-farm income generating liveli-hood strategies, respectively (Table 1). Whereas 16.9% of the sample households were unable to diversify their livelihoods, often lacking the means to engage in any form of income generating activity aside agriculture.
Consistent with this, households’ livelihood diversi-fication strategy has been strong bond with income. The sample households receive mean annual income of ETB 8036 from on-farm income alone, ETB 16258 from on-farm + off-farm income, ETB 19480 from on-farm + non-farm and ETB 20980 from combined usage of on-farm + off-farm + nonfarm income livelihood strategies (Figure 1).
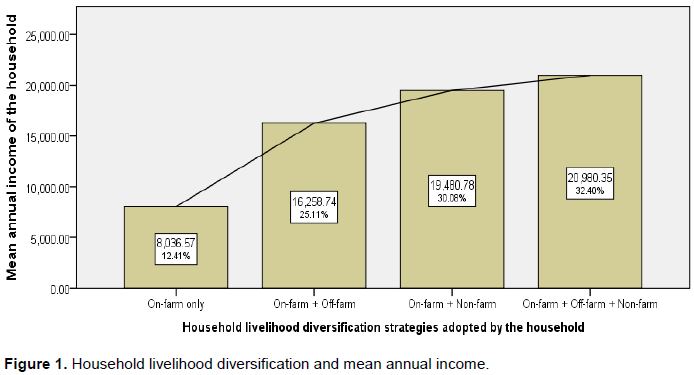
The result confirmed that households who diversify their livelihood strategies into on-farm + off-farm + non-farm income sources get more than two fold of the households who are only dependent on agricultural income and 25% better than households who used on-farm + off-farm livelihood activities. This is an indication of the more you diversify out of farming the better income you again. Therefore, the aim of livelihood income diversification can be either a deliberate household strategy to smooth income or to manage risks, or it may be as a response to opportunity by the existence of diversification options (FAO, 2015). However, household livelihood diversification is dependent on households’ ownership of the particular asset and the value of assets they owned. It also depends on the prioritized objectives they need to achieve.
Reasons for household livelihood diversification
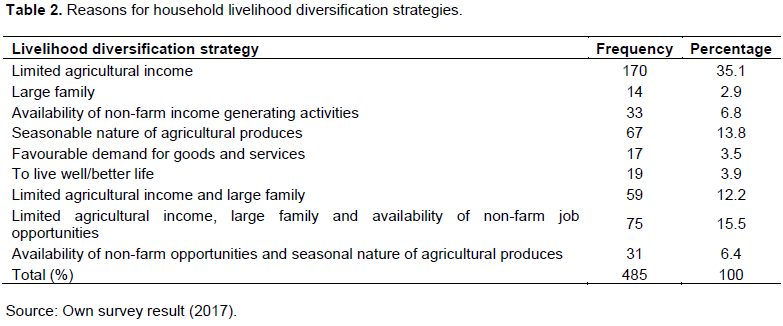
The survey result depicted that of the total sample households interviewed, limited agricultural income (35.1%), existence of large family size (2.9%), availability of non-farm income generating activities nearby (13.8%), seasonable nature of agricultural produces (12.2%), favourable demand for goods and services (6.8%), to live well (6.4%), limited agricultural income and large family (3.9%), limited agricultural income, large family and availability of non-farm opportunities (15.5%), and availability of non-farm opportunities and seasonal nature of agricultural products (2.9) were the major reasons for livelihood diversification strategies in the study area (Table 2 ). This clearly showed that some few households participate in different livelihood diversification strategies besides agriculture to get rich shortly and live well whereas the other majority households are forced to diversify to fulfil their basic human needs for their survival. As shown in Table 2, majority (35.1%) indicated that limited agricultural income as the key reason for livelihood diversification and of course the combined limited agricultural income, large family and availability of non-farm job opportunities with limited agricultural income and large family are the factors for diversification next to limited agricultural income.
This clearly shows that the main objective of diversification into off-farm and non-farm income livelihood diversification strategies in the study area is therefore primarily for survival, reducing climatic related risks like drought, looking for additional money to cover family expenditure like educational fee whereas the primary objective of the very few relatively wealthier smallholder farmers is for wealth accumulation and better living. Therefore, smallholder farmer’s livelihood diversification is a matter of life or death for many of the households in the study area. It is very difficult for them to live depending on agricultural income alone unless they can diversify into off-farm and non-farm income sources.
It was underlined that high illiteracy rate, lack of working capital, lack of entrepreneurship skill, poor social cooperatives, limited access to irrigation, water scarcity due to drought, and poor rural road expansion were mentioned as the bottlenecks of livelihood diversification strategies for the farm households (Table 2). For instance, access to irrigation can guarantee farmers livelihood income during bad season by increasing the cropping frequency from one to two or three times a year. Besides, it can also help farmers to switch from low to high value production and get more income and build good livelihood asset which is very important to attain sustainable livelihood and motivated to diversify into non-farm activities. However, farm households have limited access to small irrigation due to less effort made by the government on irrigation.
Rural households have many reasons for livelihood diversification. Some of the households need to diversify their livelihood strategies because manmade and natural factors push them to diversify for the purpose of their survival. On the other hand, some few farmers need to diversify into off-farm and non-farm livelihood activities basically for the purpose of more wealth accumulation.
Households income composition by relative community based wealth category
The household survey result revealed that 26.8, 36.5 and 36.7% of the sample households were found better off, less poor and poor, respectively (Table 3 ). Based on the relative community based wealth category, the better off households receive a mean annual income of Ethiopian Birr (ETB; equivalent to 22.4 USD) 14663.15 with a minimum of no income and maximum of ETB 216880 from on-farm activities (Table 1). Similarly, the less poor households receive a mean annual income of ETB 9485.52 with a minimum of no income and a maximum income of ETB 33620 from on-farm activities while the poor households gain ETB 6783.44 with no minimum income and maximum of ETB 42400 (Table 3 ). The fact is that very few households were unable to get income from on-farm activities because they have no own farm-land and livestock. The statistical analysis also showed the existence of significant income difference among the poor, less poor and better off households. For instance, the mean annual income of the better off households from on-farm activities is more than two fold of the poor household income.
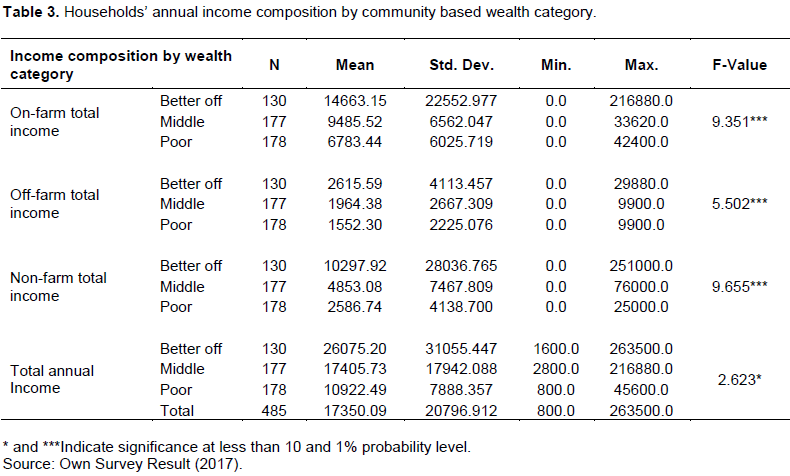
On the other hand, the mean annual income of the better off households from off-farm activities was ETB 2615.59 with a minimum of no income and maximum of ETB 29880. Whereas the annual mean income of the less poor from off-farm was 1964.38 with a minimum of no income and maximum of ETB 990. Similarly, the poor household’s annual mean income from off-farm was ETB 1552.30 with no minimum income and a maximum of ETB 990. The statistical analysis also confirms that there is a significant income difference among the poor, less poor and better of households. The better off households are the ones who get a better income. Furthermore, the non-farm mean annual income of the better off, less poor and poor households was ETB 10297.92, ETB 4853.08 and ETB 2586.74, respectively. The maximum non-farm income of the better off was ETB 251000, the less poor ETB 76000, and the poor ETB 25000 with a minimum of no income for all the three wealth categories (Table 3).
Moreover, the overall on-farm plus off-farm plus non-farm annual income of the better off, less poor and poor households were ETB 26075.20, ETB 17405.73 and ETB 10922.49, respectively. It was also clearly shown that the maximum total annual income of the better off was ETB 263500, the less poor ETB 216880 and the poor ETB 45600. Here, the survey result revealed that the overall mean annual income of the households was ETB 17350.09 with a total minimum annual income of ETB 800 and a maximum annual income of ETB 263500 (Table 3). The better off households were the most dominant relative wealth category of the households who receive the highest annual income from the three broad livelihood diversification strategies. Of note is that the better-off households have greater freedom to choose and combine diverse range of livelihood strategies and are able to earn better income than the poor and less poor households. It is also true that the poor smallholder farmers meanwhile has little choice but observed to diversify their income sources out of farming into temporary, low return and unskilled labour based off-farm and non-farm income activities in order to cope with drought associated risks, seasonality and other adverse factors in agriculture.
Implication of livelihood diversification strategies on smallholder farmer’s income
Result of the survey depicted that the mean annual income per household head earned by the sample respondents from crop production was about Ethiopian Birr (ETB) 570. It also revealed that sample households earn an average annual in-come of ETB 612, ETB 332, ETB 2155, and ETB 1716 from irrigation, cactus fruit, livestock live sale, and livestock product sales, respectively. In the entire on-farm share mean annual income of the sample households their minimum income was zero and the maximums were ETB 39500, ETB 48250, ETB 25000, ETB 37000 and ETB 27040 from crop production, irrigation, cactus, and livestock live sale and livestock product sale, res-pectively (Table 4). In addition to this, the annual mean in-come of households by income share of the broad on-farm livelihood strategies was ETB 9882.
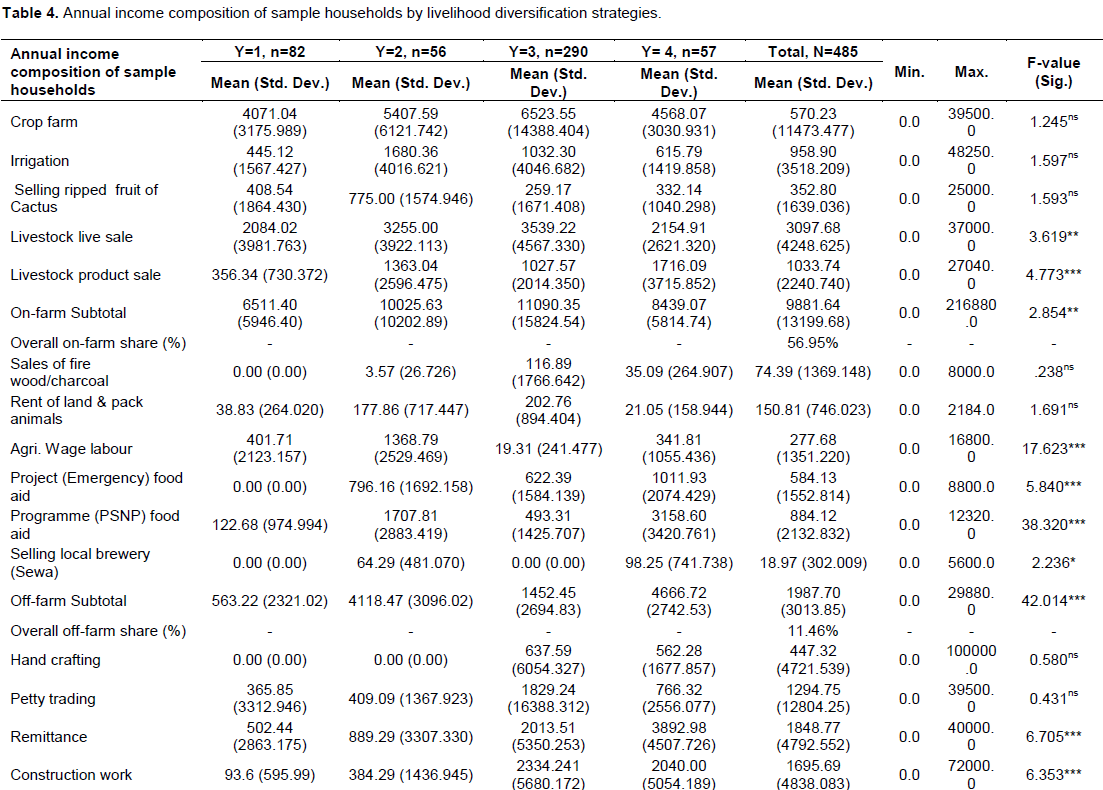
It also indicated that households who participated in different on-farm income generating activities got much more income than those who did not diversify. This is statistically significant at 5% level of significance and shows that even within farming diversification of income is an essential component of smallholder farmers’ livelihood in the study area (Table 4).
Furthermore, except 82 (16.9%) of the sample households, all of them participated in diversified income generating livelihood strategies. The particular off-farm income sources of sample household’s were sales of fire wood/charcoal, rent of land and pack animals (e.g. Donkey and camel), agricultural wage labour, project (emergency food aid), programme (PSNP) food aid, and selling locally made drink like ‘Sewa’. The survey data revealed that the mean annual income of the households across the four livelihood strategies from sales of fire wood/charcoal, rent of land and pack animals, agricultural wage labour, project (emergency food aid), productive safety net programme (PSNP) food aid, and selling local brewery like ‘Sewa’ off-farm livelihood strategies is ETB 74.39, ETB 151, ETB 278, ETB 584, ETB 884 and ETB 19, respectively (Table 4). Besides this, the annual mean income of households by income share of the broad off-farm livelihood strategies was ETB 1988. The results of the descriptive statistical analysis depicted that there is high income difference at less than 1% significance level among the sample households who participate in different off-farm livelihood strategies (Table 4). This clearly indicates existence of huge income variation among the households that emanates from livelihood diversification and its practices. It seems surprising to see some rural households who are exclusively dependent on on-farm income without getting any income from sale of fire wood and charcoal. Of the different off-farm income sources, sample households in the area get relatively the highest share of mean annual income from PSNP and project food aid than agricultural wage labour, sale of fire wood, rent of land and pack animals and sale of locally made drink ‘sewa’ and factory produced drinks beer.
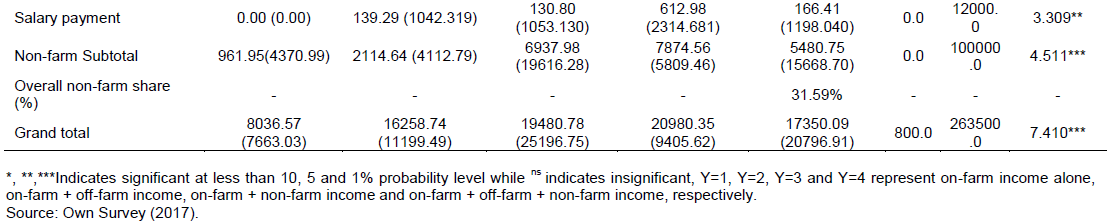
In fact, agricultural households use non-farm income to diversify risk, minimize seasonal income fluctuation and finance agricultural input purchases and then to improve their livelihood. Result of the survey depicted that sample households get a mean annual income of ETB 447, ETB 1295, ETB 1849 and ETB 166 from hand crafting, petty trading, remittance, construction work and salary payment, respectively (Table 4). Of the non-farm income sources, the mean annual income shares from remittance, construction work and petty trading are relatively higher than the income share received from hand crafting and salary. The statistical analysis showed that there is a positive and significant income difference among the sample households who diversify their income to non-farm income at less than 1% significance level. The sample households also received a total mean annual income of ETB 5488 from non-farm income with a minimum income of zero and maximum income ETB 100000 (Table 4).
In line with this, the average total annual income of sample households rely their livelihood on on-farm, on-farm plus off-farm, and combination of on-farm plus off-farm plus non-farm comprises ETB 8036, ETB 16258, ETB 19480, and ETB 20980, respectively. And the total mean annual income of the sample households per one household head is ETB 17350 with a minimum of ETB 800 and maximum of ETB 263500. It means one household member of the sample respondents earns an approximate mean annual income of ETB 2892 per year since the average household size is 6. The standard deviation (20796.91) clearly indicated that there is high income difference among the households who diversify their means of livelihood income strategies and even between those who did not diversify (Table 4). Moreover, the mean annual income of the sample households by income share of the broad on-farm, off-farm and non-farm livelihood diversification strategies comprise ETB 9881.64 (56.95%), ETB 1987.70 (11.46%) and ETB 5480 (31.59%) of income from on-farm, off-farm and non-farm, respectively.
It was not surprising to see farm households in the study area forced to diversify their livelihood income sources beyond agricultural income. Because agriculture in the particular study area is subsistence in nature, land is fragmented, highly degraded and rain fed dependent and unable to absorb the growing population pressure. In addition, farm income was unable to provide sufficient means of survival in rural areas due to climatic variability and change associated risks such as drought coupled with limited farm-land and high population growth in the area. Accordingly, rural households in the area are forced to use off-farm and non-farm livelihood diversification strategies as survival option, earn better income and to improve their living standards from diverse allocation of their natural, physical, financial and human livelihood assets.
Despite the negligence of the non-farm sector by the government, its role on the livelihood of the majority of the rural farm household’s income is enormous. For instance, the overall income contribution of household livelihood diversification strategies into off-farm + non-farm activities on the annual income of the household is 43%. This is consistent with findings of Bezabih et al. (2010) and Haggblade et al. (2010)who found that rural residents across the developing world earn 35 to 50% of their income from non-farm activities. Similar to this, em-pirical studies conducted in Ethiopia also found non-farm income accounts for as much as 40 to 45% of average household income (Bezabih et al., 2010; Kassie, 2017). The fact is that depending on the event and the wealth in capitals, the family may be able to build only agricultural portfolio or a combination of on-farm, off-farm and non-farm activities during times of stress and even at good seasons.
CONCLUSIONS AND RECOMMENDATIONS
The study concludes that smallholder farmers in the study district use diverse livelihood diversification strategies to achieve their prioritized livelihood objectives depending on their wealth status. The objective of the poor and less poor household’s livelihood diversification was primarily for survival, reducing drought associated risks, and to cover all family running costs. Whereas the objective of the few better off households was for wealth accumulation and better life. On the other hand, limited agricultural income due to severe drought and small farm size coupled with high population growth were found the most prioritized reasons for the smallholder farmers to diversify their livelihood income sources.
Furthermore, it was found that households in the study area have unevenly diversified sources of income. For instance, the overall on-farm + off-farm + non-farm annual income of the better off, less poor and poor households was ETB 26075.20, ETB 17405.73 and ETB 10922.49, respectively. In addition to this, all but 16.9% of the sample households were unable to diversify their livelihoods, often lacking the means to engage in any form of income generating activity aside from agriculture mainly livestock husbandry and crop production. Similarly, the mean annual income of the sample households by income share of the broad livelihood diversification strategies covers 56.95% on-farm income, 11.46% off-farm income and 31.59% non-farm income. It means off-farm + non-farm income contributes 43% to the total annual income share of the households. It should be noted that the relatively better off households have greater freedom to choose and combine among the diverse range of livelihood strategies and are able to earn better income than the poor and less poor households. It is also true of the sample households that the poor smallholder farmers meanwhile has little choice but observed to diversify their income sources out of farming into temporary, low return and unskilled labour based on off-farm and non-farm income activities in order to cope with drought associated risks, seasonality and other adverse factors in agriculture.
Moreover, despite the negligence of the non-farm sector by the government its role on the livelihood of the majority of the rural farm household’s income is enormous. It helps them to build livelihood capitals and become less vulnerable to risks associated with climate changes than those who do not diversify their livelihood strategies. Hence, this paper concludes that in the context of unstable, drought prone, and poor agricultural income, limited farm-land, and high population growth environment, diversification of household livelihood strategies is a must and has positive implication on smallholder farmer’s income and in minimizing risks and getting better livelihood. It is also difficult for smallholder farmers to live without external support depending on agricultural income alone unless they can diversify their income sources into off-farm and/or non-farm income activities. In fact, in the context of the study area, livelihood diversification is a matter of life and death for many of the smallholder farmers.
Therefore, more efforts are required from the government on facilitating and supporting livelihood diversification into off-farm and non-farm options via providing enough credit and working place for petty traders and handcraft men and linking them with market rather than sticking on the drought vulnerable agricultural income alone. Moreover, much investment is needed on labour intensive factories that can attract more job opportunities for the landless and jobless youths as part of mitigation option to break illegal out-migration as a response to drought.
CONFLICT OF INTERESTS
The authors have not declared any conflict of interests.
ACKNOWLEDGEMENTS
This work was supported by Mekelle University, RUFORUM and Association of African Universities (AAU). The authors would like to thank farmers of the area for furnishing them with sufficient information during the research fieldwork.
REFERENCES
|
Barrett BC, Reardon T, Webb P (2001). Non-farm income diversification and household livelihood strategies in rural Africa: concepts, dynamics, and policy implications. Food Policy 26:315-331. |
|
|
Bezabih M, Gebreegziabher Z, Gebremedhin L, Kohlin G (2010). Participation in Off-Farm Employment, Rainfall Patterns, and Rate of Time Preferences: The case of Ethiopia. Environment for Development Discussion Paper Series, EfD DP 10-21. |
|
|
Challinor AJ, Simelton ES, Fraser ED, Hemming D, Collins M (2010). Increased crop failure due to climate change: Assessing adaptation options using models and socio-economic data for wheat in China. Environmental Research Letters 5:1-8. |
|
|
CSA, Central Statistical Agency (2013). Central Statistical Agency Population Projection of Ethiopia for All Regions At Wereda Level from 2014-2017. Federal Democratic Republic of Ethiopia, Addis Ababa. https://doi.org/10.1007/s13398-014-0173-7.2 |
|
|
Ellis F (2000). The Determinants of Rural Livelihood Diversification in Developing Countries. Journal of Agricultural Economics 51:289-302. |
|
|
Eshetu F, Mekonnen E (2016). Determinants of off-farm income diversification and its effect on rural household poverty in Gamo Gofa Zone, Southern Ethiopia. Journal of Development and Agricultural Economics 8:215-227. |
|
|
FAO, Food and Agriculture Organization (2015). Livelihood diversification and vulnerability to poverty in rural Malawi. In: (eds.), Asfaw S., McCarthy N., Paolantonia A., Cavatassi R., Amare M. and Lipper. ESA Working Paper No. 15-02. Rome. |
|
|
FDRE, Federal Democratic Republic of Ethiopia (2011). Federal Democratic Republic of Ethiopia Ministry of Agriculture: Agriculture Sector Programme of Plan on Adaptation to Climate Change, Addis Ababa. |
|
|
Gebru GW, Beyene F (2012). Rural household livelihood strategies in drought-prone areas: A case of Gulomekeda District, eastern zone of Tigray National Regional State, Ethiopia. Journal of Development and Agricultural Economics 4:158-168. |
|
|
Haggblade S, Hazell PBR, Reardon T (2010). Transforming the Rural Non-farm Economy: Opportunities and Threats in the Developing World. American Journal of Agricultural Economics 92:288-290. |
|
|
International Fund for Agricultural Development (IFAD) (2010). Rural Poverty 2011. New realities, new challenges: new opportunities for tomorrow's generation. International Fund for Agricultural Development (IFAD) 317 p. Rome, Italy. |
|
|
Intergovernmental Panel on Climate Change (IPCC) (2012). Managing the risks of extreme events and disasters to advance climate change adaptation. A special report of Working Groups I and II of the Intergovernmental panel on climate change. Cambridge University Press, Cambridge, UK. 30(11):7575-7613. |
|
|
Intergovernmental Panel on Climate Change (IPCC) (2014). Climate Change 2014: Synthesis Report. Contribution of Working Groups I, II And III To The Fifth Assessment Report of the Intergovernmental Panel on Climate Change. IPCC, Geneva, Switzerland 151 p. |
|
|
Kassie WG (2017). The Nexus between livelihood diversification and farmland management strategies in rural Ethiopia. Cogent Economics and Finance 5:1-16. |
|
|
Khatun D, Roy BC (2016). Rural Livelihood Diversification in West Bengal: Nature and Extent. Agricultural Economics Research Review 29:115-124. |
|
|
Loison SA (2015). Rural Livelihood Diversification in Sub-Saharan Africa: A Literature Review. Journal of Development Studies 51:1125-1138. |
|
Copyright © 2024 Author(s) retain the copyright of this article.
This article is published under the terms of the Creative Commons Attribution License 4.0


