This study focused on knowledge and perception of farmers on information and communication technology (ICT) use in Ife Central Local Government Area of Osun State. A pretested and validated interview schedule was used to source information from 150 farmers selected through a multi-stage sampling procedure. Descriptive and inferential statistical tools were used to analyze the data collected. The result revealed among others, that the mean age of the respondents was 47.29 years, while the mean income was 505,600 Naira. Furthermore, majority (76.0%) of the farmers had a low awareness of ICT use, while majority (76.0%) of the farmers had a low knowledge of ICT. Also, majority (84.7%) of the farmers had an indifferent perception on ICT use. Number of year of formal education of farmers, knowledge on ICT and perception on ICT use explained 38.8% of the change in farmers’ awareness on ICT in the study area. The study recommended that anytime programme that should improve the awareness of farmers’ on ICT is being planned, the significant variables should be considered.
The world is witnessing an era of globalization as well as explosion in information and communication technology (ICT). Most public offices, urban and rural areas are now well connected in terms of ICTs such that the whole world is just like a small village. ICTs could be described in various ways. ICTs are computer based tools used by people to work with information and communication processing needs of an organization. It purview covers computer hardware, software, the network and other digital devices like video, audio, camera, etc., which convert information (text, sound, motion, etc.) into digital form (Moursund and Bielefeldt, 1999). Rodriguez and Wilson (2000) defined ICT as a set of activities which facilitate by electronic means the processing, transmission and display of information. Ogunsola and Aboyade (2005) viewed ICT as a cluster of associated technologies defined by their functional usage in information access and communication of which one embodiment is the internet. ESCAP (2000) in its own definition defined ICT as techniques people use to share, distribute, and gather information and to communicate through computers and computer networks.
Marcelle (2000) described ICT as a complex varied set of goods, applications and services used for producing, distributing, processing, transforming information (including) telecoms, TV and radio broadcasting, hardware and software, computer services, and electronic media. Furthermore, Michiels and Van Crowder (2001) defined ICTs ‘as a range of electronic technologies which when converged in new configurations are flexible, adaptable, enabling, and capable of transforming organizations and redefining social relations. Therefore, ICTs have become a significant factor in development having profound impact on the political, economic, and social sectors of the country.Many (63.7%) people in Nigeria according to 1991 census live in the rural areas (Ekong, 2003) and have little or no access to telephone, computer or internet based services. In the words of Mansoor and Kamba (2010), “access to information in rural communities is affected by a number of barriers, such as infrastructure, low level of literacy, lack of proper information services, technical competencies, and lack of proper information policy and governance directed to rural communities.
However, ICTs have the capacity of positively influencing agriculture and rural development through provision of information that will enhance efficiency and high production. The term ‘farmer’ usually applies to the person who is at the centre of agricultural production which is the main occupation in the rural area. He/She takes decision on what to produce, when to produce, what quantity to produce and optimal combination of actual resources to achieve stated objectives (Alabi, 2010). Farmers, therefore, are at the forefront of the sustainable agricultural movement. Their present knowledge, passion, management and marketing skills are affecting their business negatively, coupled with the fact that these people are mostly rural dwellers, where there is little or no access to information and knowledge necessary to enhance efficiency in production, marketing, distribution and consumption of agricultural produces (Torimiro et al., 2007).
Since information is prerequisite for sustainable development and agriculture inclusive, farmers’ access to ICTs’ infrastructure is important to increasing the flow of information and this information could serve as a means of empowering the farmers to face the challenges of their immediate environment in the process of carrying out their business effectively. The contribution of ICTs to the overall improvement and arrangement of the farming business and the changes visible in the farmers’ environment cannot be over emphasized. In the light of this, farmers’ awareness of various ICTs must be looked into with a view to analyzing their knowledge and perception on ICTs as it applies to different aspects of their lives and enterprises.
Therefore, the following specific objectives were set for the study.
(1) Describing the socio-economic characteristics of farmers in the study area;
(2) Determining the level of knowledge of farmers of the various ICTs available in the study area;
(3) Determining the perception of farmers towards ICT use in the study area;
(4) Determining farmers awareness on various ICTs in the study area; and
(5) Identifying the constraints to ICT use in the study area.
Furthermore, the study seek to determine whether a significant relationship exists between the various independent variables of the study and the dependent variable of the study, the awareness of farmers on various listed ICTs in the study. This statement provided guidance for the research work.
Study area
Ife Central Local Government Area (LGA) of Osun State was the area studied. The Local Government Area is one of the thirty LGAs in Osun State. The LGA is at the centre of Ile-Ife town believed to be the ancestral home of the Yoruba race one of the ethnic tribe in sub Saharan Africa. The LGA also hosts the Obafemi Awolowo University, Ile-Ife, currently the leading university in Nigeria and number fourteen in Africa (Webometric Ranking, 2013). All manners of farming activities take place within the LGA ranging from arable crop production to tree crop production to livestock production and also some processing of various agricultural produce.
Sample selection and data collection
The population of the study was the total number of farmers within the Local Government Area. Sampling was done through a multi stage sampling technique. In the first stage, three communities were purposively selected due to their pronounced involvement in arable crop production. At the second stage, simple random sampling technique was used to select 150 farmers from the selected communities: thirty respondents from Iremo, ninety respondents from Tonkere and thirty respondents from Akarabata, respectively according to the size of the communities. Both part time and full time farmers were sampled. The sampling was not gender biased as both male and female were interviewed. Test-retest method was used to validate the instrument used for data collection. Ten respondents selected from a different community from the study area were interviewed twice at interval of two weeks. The results were compared to remove any ambiguity and to ensure that the questions asked elicit the responses intended. The duly validated interview schedule was then used to elicit information from the selected respondents of the study. Primary data were collected on the socio-economic characteristics of the respondents, the level of awareness of various ICTs, their level of knowledge on ICTs, their perception on ICTs use and the constraints to and benefits of ICT usage. The approval and support of each of the farmers before the interview was ensured. One hundred and fifty interview schedules were administered. The interview schedule was framed in English but interpreted to the farmers in Yoruba, this is because majority of the farmers’ were illiterates. Trained enumerators were used in the collection of data.
Measurement of variables and data analysis
Independent variables such as age, number of years of formal education, annual income from agriculture, farm size, and type of farming activity were measured with the use of absolute values provided by the respondents. The awareness of respondents on various ICT was measured through their responses to some standardized relevant statements on a five point Likert scale with have you heard of it (1), do you have the skill to use it (1), have you seen it (1), have you used it (1), and do you have it (1). The maximum obtainable score for each ICT is five. Respondents’ score for the variable were further grouped into high, medium and low categories using mean plus/minus standard deviation. Knowledge score was gotten from the summary of respondents’ response to questions on knowledge in the use of ICT and perception score was gotten from the summary of respondents’ response to questions on perception towards ICT use. The mean scores of knowledge and perception was further calculated and using overall mean and one standard deviation, the two variables were grouped into high, low and medium levels. Descriptive and inferential statistics were used to analyze the data collected. The descriptive statistics: frequency, mean and standard deviation were used to summarize the data while inferential statistics: Pearson Product Moment Correlation and Regression Analysis were used to test the relationships between the dependent variable (awareness of various ICTs) and the independent variables like age, farm size, years as a resident and number of years of formal education.
Socio-economics characteristics of respondents
The result in Table 1 showed that 58.7% were male and 41.3% were female. This indicates that there were more males involved in farming than females in the study area. The result in Table 1 also revealed that 14.7% of the respondents were below 31 years old, while 26.7 and 22% were between 32 to 42 years old and 42 to 53 years old, respectively. Also, 21.3 and 12.7% were between 54 to 64 years old and 65 to 75 years old, respectively and only 2.7% were 76 years and above. The mean age of the respondents was 47.29±14.68 years. The implication of this finding is that a larger number of the farmers were strong able-bodied males and females capable of doing farm work. The results in Table 1 further revealed that about 9.3% of the respondents were single while 76.0% were married. Also, 4.7% were divorced, 6% were separated and only 4% were widowed. This indicates that most of the farmers were married. The results in Table 1 also revealed that majority (70.0%) of the respondents were Christian, while 26.7% were Islam and 3.3% were traditional worshippers.
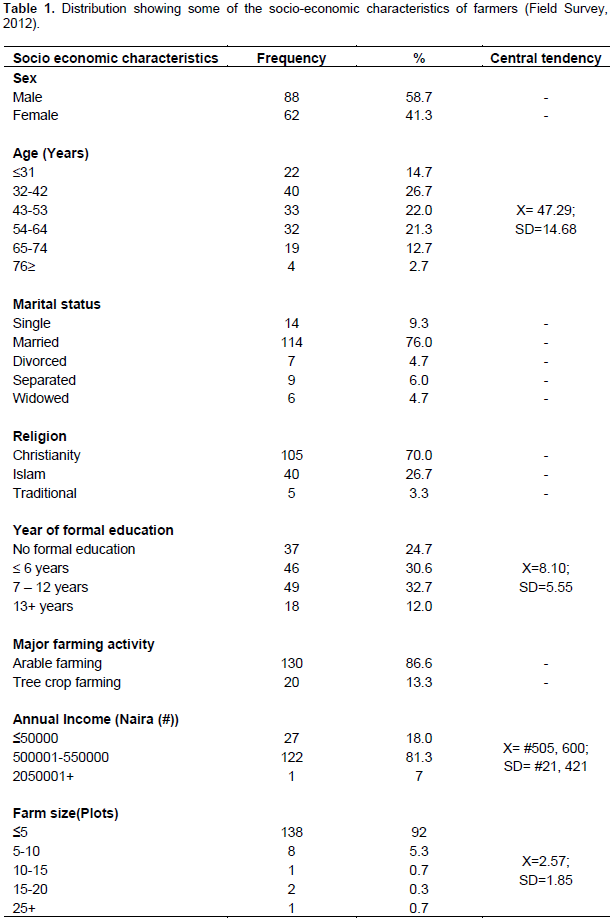
This indicates that the respondents were highly religious however the dominance of western religion over the traditional religion of the respondents is noted in the study area. Furthermore, the results in Table 1 revealed the number of year of formal education of the respondents. About 24.7% of the farmers had no formal education while 30.6% had less or equal to 6 years of formal education. Also, 32.7% had between 7 and 12 years of formal education, while 12% had 13 years and above of formal education. The result shows that majority of the respondents had at least one form of formal education. The average year of formal education was 8.1± 5.55 years. This indicates that a larger number of the farmers only finished primary education. This might affect the farmers’ knowledge and perception of ICT use. The result in Table 1 revealed that majority (86.6%) of the respondents were arable crop farmers while 13.3 were tree crop farmers. This implies that arable crop production dominates among farmers in the study area.
Furthermore, result in Table 1 revealed the annual income from farming operations of the respondents. About 18% of the farmers earned below ₦50,000, while majority (81.3%) earned between ₦500,000 and ₦550,000 and 7% earned ₦2,050,000 and above. The average annual income of the farmers was ₦505,600±â‚¦21, 421. The result in Table 1 revealed that majority (92%) of the farmers had farm size below 5 plots, while 5.3% had between 5 and 10 plots and 0.7% apiece had between 10 to 15 plots and 25 plots and above, respectively. Also, 0.3% had between 15 and 20 plots. The average farm size of the respondents was 2.57±1.85 plots. The results in Table 2 showed that 5.3% of the farmers travel out of their communities daily, more than half (56.7%) of the respondents weekly, while 31.3% of them travel out of their communities monthly. The results in Table 2 also showed that 67.3 and 64.7% of the farmers travel to other local government areas and other states, respectively, while 3.3% of them travel outside of the country.
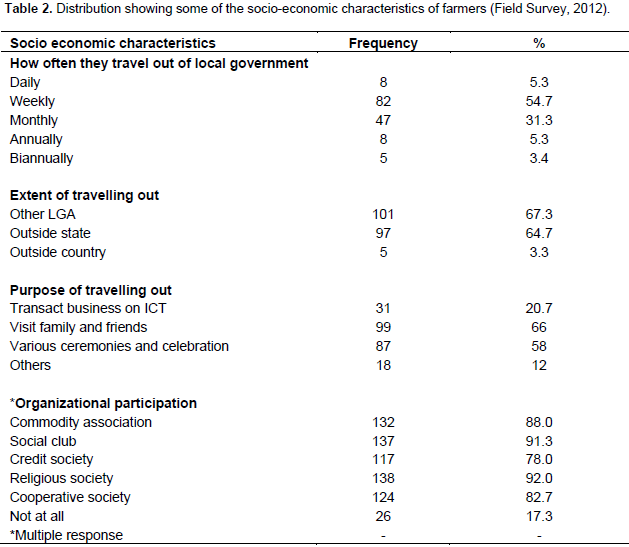
The results in Table 2 showed that 20.7% of the farmers travel purposefully to transact business on ICTs, while majority (66%) travel to visit family and friends. Also, 58.7% travel for various ceremonies and celebration and 12% travel to gather information on farming. Furthermore, 6% travel for other purposes. The cosmo politeness of the farmers could go a long way to influence their use of various ICTs. The results in Table 2 also showed that 88.0% of the farmers belonged to commodity association while 91.3 and 78.0% belonged to one social club or the other and credit society, respectively. Majority (92.0%) of the farmers belonged to one religious society or the other and 82.7% belonged to cooperative society, while just 17.3% belonged to none of the organizations. The organizational participation of the farmers could influence their knowledge and perception of ICT use in the study area.
Farmers’ knowledge on ICT use
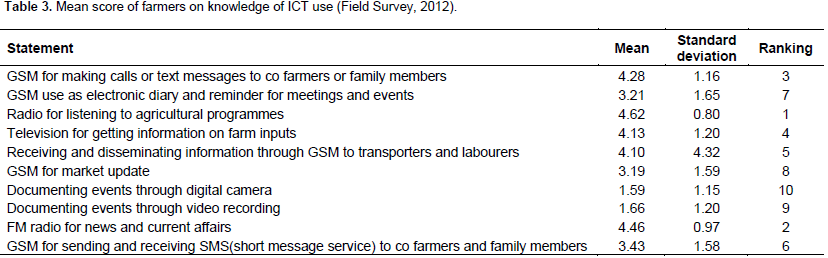
The result in Table 3 showed that the knowledge of farmers was highest in using radio for listening to agricultural programme with a mean score of 4.62. This was followed by FM radio for news and current affairs and events with a mean score of 4.46. Also the farmers had moderate knowledge in GSM for sending and receiving short message service (SMS) with a mean score of 3.43 and GSM use as electronic diary and reminder for meetings and events with a mean score of 3.21. However, the result in Table 3 also showed that the knowledge of the farmers was the lowest in documenting events through digital camera with a mean score of 1.59. This showed that farmers had more knowledge on the use of FM radio, mobile phone, and television which are the commonest in ICTs used by farmers in the study area.
Categorization of farmers’ knowledge of ICT use
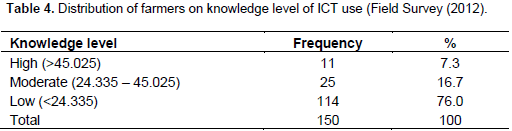
The results in Table 4 revealed that majority (76.0%) of the farmers had low knowledge on ICT use with a score range of ≥24.335, while 16.7% had moderate knowledge on ICT with a score range of 45.025 to 24.335 and 7.3% had high knowledge on ICT with a score range of ≤45.025. Efforts should be geared towards improving the knowledge of farmers on relevance and benefits of ICT in agriculture and other aspects of human life to empower farmers in the study area to maximize the use of ICTs.
Farmers’ perception towards ICT use
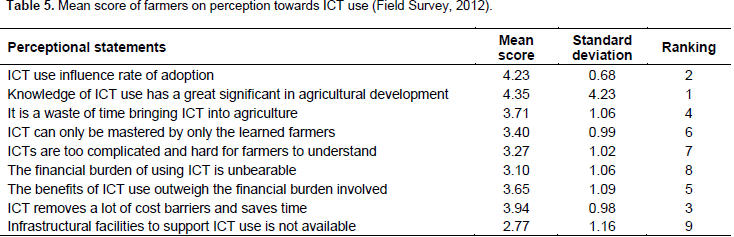
The result in Table 5 showed the responses of farmers to the perceptional statements used to determine their perception on ICT use. It was shown that the statement “knowledge of ICT use has a great significance in agricultural development” ranked highest in shaping the perception of farmers on ICT use with a mean score of 4.35. This was followed by “ICT use influences rate of adoption” with a mean score of 4.23. However, the statement “infrastructural facilities to support ICT use are not available” ranked lowest in shaping the perception of farmers on ICT use with a mean score of 2.77. Furthermore, the perception of farmers on ICT use was classified into three.
Classification of farmers’ perception on ICT use
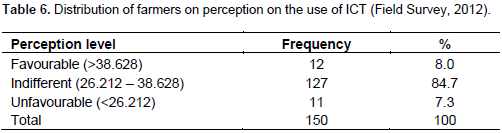
The results in Table 6 showed that majority (84.7%) of the farmers had indifferent perception towards ICT use with score range of 26.212 to 38.628 while 7.3% of the farmers had unfavourable perception towards ICT use with a score <26.212. However, 8.0% of the farmers in the study area had a positive perception towards ICT use with a score of greater than 38.628. This implies that majority of the farmers were indifferent towards ICT use in their day to day activities. Efforts should therefore be made to supply adequate information that will improve the perception of farmers concerning ICT use since knowledge had been shown to influence perception.

Awareness of various ICTs
The results in Table 7 showed that all the farmers (100%) had heard of television while almost all (93.3%) had skill to use television. Also all (100%) had seen television and 97.3% had used television and 93.3% of the farmers had television. However, all (100%) of the farmers had heard of radio, while majority (96.7%) of the farmers had the skill to use radio. Furthermore, almost all (100%) had seen radio, while 97.3% had used radio and 94.7% had radio. Also, 79.3% had heard of video recorder among the farmers, 38.7% had the skill to use video recorder, 76.7% had seen video recorder, 38.7% had used video recorder and 42.0% had video recorder. The results from Table 7 revealed that 29.3% of the farmers had heard of digital camera while, 10.7% had skill to use digital camera and 26.7% had seen a digital camera. Also, 10.0% had used digital camera and 9.3% had digital camera. Also, 39.3% of the farmers had heard of print media, 21.3% had the skill to use print media and37.3% had seen print media. Also, 22.7 percent had used print media and just 21.3% had print media.
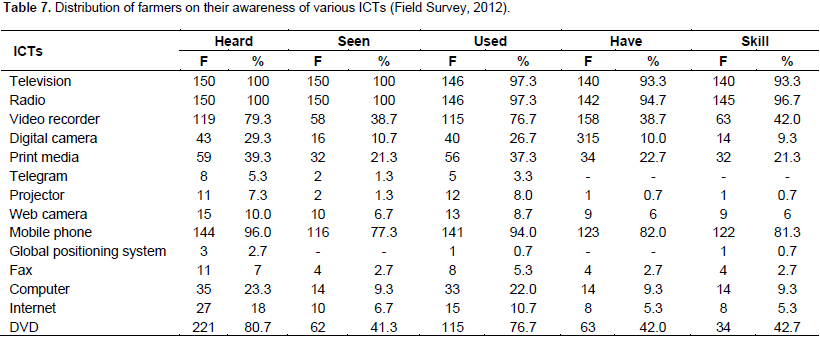
The results from Table 7 also revealed that only 5.3% of the farmers had heard of telegram, 1.3% apiece had skill to use and had used telegram respectively. Also, 3.3% had seen telegram while just 0.7% had telegram. Also, only 7.3% had heard of projector, while 1.3% had seen a projector. More so, 8.0% had used projector. Furthermore, result from Table 7 revealed that 10.0% had heard of web camera, while just 6.7% had seen it. Also 13% had used web camera, while only 6% had web camera and 6% had the skill to use web camera. Result in Table 7 also revealed that all (100.0%) of the respondents had heard of mobile phone and had seen mobile phone. Furthermore, almost all (94.0%) of the farmers had used mobile phone, while 82.0% had mobile phone and 81.3% had skill to use mobile phone.
The results from Table 7 further revealed that 2.7% had heard of GPS, while 1% had used GPS and just 0.7% had skill to use GPS. Also, 7% of the respondents had heard of fax, 2.7% had skill to use fax and 5.3% had seen fax machine. Furthermore, 2.7% had been used and had fax machine, respectively. The result in Table 7 revealed that 23.3% of the farmers had heard of computer, 9.3% had seen a computer, while 22.0% had used a computer. Also, 9.3% of the farmers had skill to use a computer, respectively. The results from Table 7 also revealed that 18% of the respondents had heard of internet, 6.7% had seen the internet, while 10.7% had used the internet. Also, 5.3% of the respondents had the skill to use the internet. The result in Table 7 revealed that majority (80.7%) of the farmers had heard of DVD, 41.3% had seen a DVD, while 76.7% had used DVD. Also, 42.0% of the farmers had DVD and 42.7% had skill to use DVD.
Categorization of farmers’ awareness on ICT use
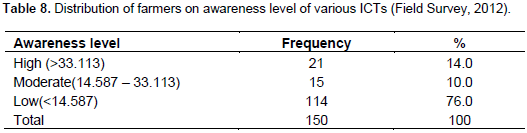
The results in Table 8 revealed that majority (76.0%) of the farmers had low awareness (<14.587) of various ICTs, while 10.0% had moderate (14.587 to 33.113) awareness and 14.0% had high (>33.113) awareness. This implies that the overall awareness of the farmers is low on ICT. This might be as a result of their low knowledge of ICT and indifferent perception on ICT use. This might eventually affect their application of relevant ICTs to their daily activities.
Farmers’ constraints on ICT use
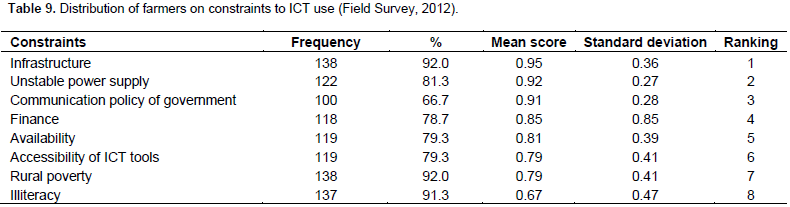
The result in Table 9 revealed farmers’ constraints on ICT use. The result in the table showed that infrastructure and rural poverty ranked highest (92.0%) on the list of constraints faced by farmers, respectively followed by illiteracy (91.3%) and unstable power supply (81.3%). Communication policy of government ranked least (66.7%) among the constraints as opined by the farmers.

Results of correlation analysis
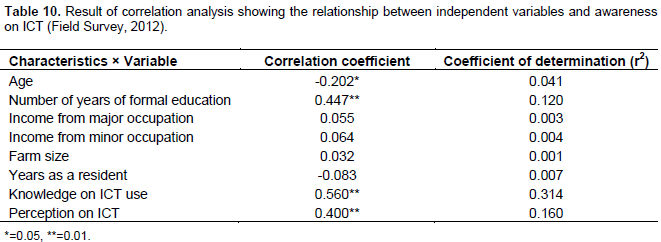
The result in Table 10 revealed the outcome of the Pearson Product Moment Correlation analysis carried out on the variables of the study. The result showed that a number of year of formal education (r = 0.447), knowledge on information communication technologies (r = 0.560), and perception on information communication technologies use (r = 0.400) had significant relationship with farmers awareness of ICTs at 0.01 level of significance. Furthermore, age of respondents (r = -0.202) showed negative, but significant relationship with the awareness of farmers on ICTs at 0.05 level of significance. This implies that the awareness of farmers on ICTs increased with increases in the magnitude of the variables which had positive and significant correlations and declined with increase in the magnitude of the variable which had negative, but significant correlation.
Results of regression analysis
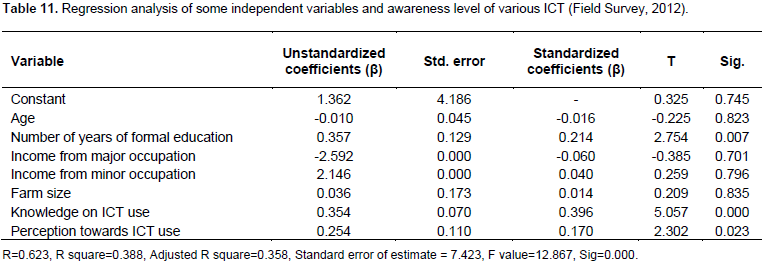
The variables studied were also subjected to regression analysis. Result presented in Table 11 revealed that three variables explained 38.8% (R2 = 0.388) of the total variation in the awareness of farmers on ICTs. The regression coefficients of the three significant variables were number of year of formal education (b = 0.357), knowledge on ICTs (b = 0.354), and perception of farmers on ICTs use (b = 0.254) at 0.05 level of significance. This suggests that any proposed programme aimed at improving farmers’ awareness and eventual use of ICT should give cognizance to these variables. The regression analysis further revealed that F-statistic value was 12.867 and it was significant at 0.05 level of significance. This result implies that the composition of variables studied contributed to changes in farmers’ awareness on ICTs.

Implication for sustainable rural development
Empirical evidence presented in the study showed the following implications for rural development in Nigeria. Farmers in the study area reflected a low level of knowledge on ICT use. This implies that many of them did not know of the potentials of ICT in empowering rural people for the purpose of preserving, ordering, and transmitting information for agricultural and rural development. This calls for concerted effort on the part of government and other developmental agencies to see to ways of improving the knowledge of farmers on the potentials of ICT use in development activities, especially now that Nigerian government is seeking ways of transforming the country’s agriculture and introducing many ICT driven agricultural innovations. Also, majority of the farmers had indifferent perception towards ICT use. This needs a lot of persuasion to move them towards application of various available ICTs in their day to day activities, because of the attendant benefits.
The study further revealed low awareness of farmers on the various ICTs in the study area. This revealed the level of the digital divide between the urban and rural areas. While other countries aim to reach the moon, Nyerere (1967) opined that “third world countries must aim for the time being at any rate to reach the villages by providing them with necessary information”. One of the necessary information for the rural area is that on ICT. This improved system of information and communication according to Chapman and Slaymaker (2002) have a dual function, to supply the information required by the poor in order to pursue sustainable livelihood strategies, and to supply information required by institutions responsible for making decisions that affect those strategic livelihood options.
The study concluded among others that many of the farmers in the study area are males and that the average age of farmers studied was around 48 years. Majority of the farmers are married and also practice Christianity. Also, majority of the farmers had formal education, while majority also are arable crop farmers. The average annual income of the farmers in the study area was ₦505, 600 with about 2.57 plots average farm size. The knowledge of farmers on ICT was highest in using radio for listening to agricultural programmes and lowest in documenting events using digital camera. Also, the statement “knowledge of ICT use has a great significance in agricultural development” ranked first in shaping the perception of farmers on ICT use. Furthermore, the study concluded that majority of the farmers had low knowledge on ICT use and also had indifferent perception on ICT use. Effort should be made to improve these two characteristics of the farmers, because they showed significant relationship with farmers’ awareness on ICT. The variables that influenced farmers’ awareness of ICT are number of year of formal education, knowledge on ICT use and perception on ICT. These variables should be given priority anytime programme that would improve farmers’ awareness on ICT is being planned.