ABSTRACT
The National Accelerated Agricultural Inputs Access Programme (NAAIAP) established in 2006 was envisioned as a safety net programme that would address the problem of food insecurity and poverty among poor farmers. This study using cross-sectional data obtained from 200 farmers employs Multinomial Logistic analysis and data from the 2009/2010 agricultural season to estimate the subsidy effects of the NAAIAP program on poor and vulnerable farmers of Tana River Sub-County. To control for errors of inclusion and exclusion the study focused on those farmers who had actually received vouchers. Observations point to predominantly aging male farmers with primary level of education and whose main source of income is farming earning them an average of $1 a day. These farmers owning on average seven acres, lack titles to their pieces of land of which only half was utilized for production, had not accessed financial services despite such services being within reach; a factor that could be attributed to their lack of collateral and low levels of realized annual incomes from sales through roadside markets and general information asymmetries. Model results show that returns on investments to various income categories from use of fertilizer is sensitive to residual effects of previous fertilizer application, timing or use of fertilizer during the right season, and communal financial support structures such as group saving. These findings therefore avail deeper insight to policy makers and provide valuable information which has implications on policy, design, targeting and programme implementation.
Key words: Subsidy, fertilizer, National Accelerated Agricultural Inputs Access Programme (NAAIAP), smallholder, Kenya.
Fertilizer subsidies are instruments to increase productivity (Druilhe and Hurle, 2012) and is an important component in raising crop yields on the continent; on average, farmers in sub-Saharan Africa use about 13 kg of fertilizer nutrients per hectare (ha) of arable land compared with the developing country average of 94 kg/ha (Minot et al., 2009). Eleni (2009) note that with the partial or complete removal of explicit subsidies to smallholders, hybrid maize seed purchases and fertilizer use declined in the early 1990s in this region and population growth has outpaced grain production growth in most of Eastern and Southern Africa. In Malawi subsidies were reintroduced in 1998 after deregulation by the Structural Adjustment Program (SAP) through the Starter Pack Scheme (which evolved into a Targeted Inputs Program (TIP)) following years of perennial food shortages (Chibwana et al., 2010). Evaluation studies show Malawi started registering surplus maize output to the tune of more than 1 million ton per annum since the implementation of the program. Maize yield doubled from 1.6 ton/ha in 2000 to 2005 to 2.27tons/ha in 2009/2010 (Levy and Barahona, 2002; Dugger, 2007; Gurara and Salami, 2012).
Opinion literature is divided on the effectiveness of subsidies with two clear schools of thought emerging; (Druilhe and Hurle, 2012) indicates that available evidence, suggests that such programmes have been effective in raising fertilizer use, average yields and agricultural production but that their success is highly dependent on implementation. Market-smart subsidies can also provide rapid gains coupled with good rains, monitoring, learning and adjustments should be made for long run sustainability especially in terms of better targeting and involvement of the private sector. Subsidies should also be embedded as part of the wider agricultural development strategy. Studies (Minot et al., 2009) conclude that if fertilizer subsidies are a cost - effective way of assisting the rural poor, they can be justified on the grounds of equity. If they help farmers offset these constraints and reach optimal application rates such that the additional farm income exceeds the cost of the subsidy program then they can be justified on efficiency grounds.
On the other hand traditional arguments against subsidies have centered around distortions to the inputs market through ‘displacements’(Druilhe and Hurle, 2012), welfare losses (Crawford et al., 2006), financial costs, efficiency (Filipski and Taylor, 2011), sustainability of public investment and to achieve desired political and social ends (Banful, 2011), for those supporting pro – poor market and small holder development, the capacity of such initiatives to promote greater inclusion and capacity for the most vulnerable is desirable. It is important to note that subsidies will impact input and output markets and interact with trade policies, and yielding positive outcomes is not always given. Druilhe and Hurle (2012) posits that when inputs and output markets do not work, there might nonetheless be a case for subsidies, and this might well be the situation in Sub Saharan Africa.
Kenya’s agricultural sector accounts for 65% of its exports and 60% of total employment (KIPPRA, 2013). This sector however, faces formidable challenges which affect greatly the poor and vulnerable small holder population. KENFAP (2011) conclude that lack of finance or appropriately packaged financial services pose great challenge to smallholder agricultural productivity in Kenya [making] it difficult for farmers to procure inputs needed to increase farm productivity. With Kenya being a primarily agriculture based economy; performance in the maize subsector has had great bearing on both food security and overall economic growth. Doward et al. (2007) highlights the factors limiting smallholder agriculture in Malawi as being high levels of poverty, low productivity, increased vulnerability, seasonality, high dependence on maize, price fluctuation, land pressure, poor market development and infrastructure, fragility of casual labor markets and ‘coping strategies’ of poor people. Given that the evidence of the effects of market-smart subsidies is limited in literature; this paper seeks to fill in the gap between theory and practice.
Overview of fertilizer policies in Kenya
Kenya’s economy is dependent on agriculture, which contributes to rural employment, food production, foreign exchange earnings and rural incomes. The agriculture sector directly accounts for about 26% of Kenya’s Gross Domestic Product (GDP) and 27% indirectly through linkages with manufacturing, distribution and other service related sectors. The sector accounts for 65% of Kenya’s total exports, 18 and 60% of formal and total employment respectively (KIPPRA, 2013). Kenya’s fertilizer market was liberalized during the early 1990s which saw the elimination of price and market controls, import permits and quotas and licensing requirements.
This reforms coupled with the freeing of the foreign exchange regime in 1992, led to increased entry and investment of private sector participation in the markets resulting in growth in fertilizer use from less than 200,000mt in 1990 to over 450,000mt in 2009 (IFDC, 2012; Ariga and Jayne, 2010) this upsurge in fertilizer use was partly a result of the government maintaining a stable fertilizer policy, foreign exchange controls and not interjecting market uncertainties through large – scale subsidy programs until 2007. This stability led to increased private investment in fertilizer distribution (10 importers, 500 wholesalers and over 6,000 retailers) (IFDC, 2012).
The early part of Kenya’s input subsector in the 1970s and 1980s saw the formation of state-run Kenya National Trading Corporation (KNTC) and Kenya Grain Growers Cooperative Union (KGGCU) which became Kenya Farmers Association (KFA) working together and doubling as both input and output service providers as well (Ariga and Jayne, 2010). The 1970s as a result of the conflict of interest that existed in the operational structures of KFA, Agricultural Finance Corporation (AFC), and National Cereals and Produce Board (NCPB) with the introduction of fertilizer subsidies a policy change was made in favor of introducing another agency Kenya National Trading Corporation (KNTC) charged with importing fertilizer which then KFA would distribute to farmers (Ariga and Jayne, 2010) a move aimed at increasing competitiveness of the sector and keeping fertilizer prices low. The 1980s saw the government relax its monopoly allowing the private sector to compete with the public state agencies however private companies were still required to abide by stringent licensing and official pricing requirements. From the late 1980s and early 1990s the state began easing trade restrictions in fertilizer and maize markets. The experience of Kenya shows how a stable policy environment can foster an impressive private sector response that supports smallholder agricultural productivity and poverty alleviation (Minde et al., 2008).
The Kenyan Government over time has encouraged farmers to use fertilizers through creating and sustaining a relatively stable policy environment, financing infrastructure and supporting fertilizer markets. From 1974 to 1984 the government gave agricultural input marketing monopoly to Kenya Farmers Association and credit provision was solely through the Agricultural Finance Corporation (AFC). As a result, the Government had extensive controls over imports, pricing, and marketing of fertilizer using policy instruments such as price subsidies, price control, licensing of importers and distributors and import quotas (Gugerty and Cook, 2009; Ariga and Jayne; Yamano and Arai, 2010).
This monopoly impeded market development by stifling competition. Widespread corruption and bureaucratic costs led to a policy change in 1972 that saw the creation of another state agency Kenya National Trading Corporation (KNTC), tasked with importing fertilizers for distribution by KFA (Ariga and Jayne, 2010). In the later part of the 1980s the government begun allowing other firms to enter an albeit highly regulated fertilizer market. Fertilizer traders were to abide by official prices and the state influenced competition through strict trade licensing requirements and control of the allocation of scarce foreign exchange to importers (Ariga and Jayne, 2010 quoting Argwings-Kodhek, 1996). This period also saw the government removing import quota restriction for example in January 1990 and abolishing licensing requirements for fertilizer imports in 1992.
In 1993, the government fully liberalized the fertilizer marketing system by decontrolling prices and decreasing the percentage of fertilizer provided by donor aid to only five percent of total supply (Gugerty and Cook, 2009; Minde et al., 2008; Ariga and Jayne, 2010) quoting (Kimuyu, 1994) Ariga and Jayne (2010) also observe that Government price controls and import licensing quotas were ultimately eliminated, and fertilizer donation by external donor agencies were phased out.
Kenya’s National Accelerated Agricultural Inputs Access P rogramme (NAAIAP)
Following the African Fertilizer Summit in 2006, the Kenyan government developed a proposal through its Ministry of Agriculture for a three – year Kshs. 36 billion (US$525 million) input subsidy programme aimed at reaching 2.5 million smallholder farmers (Government of Kenya, 2006). The National Accelerated Agricultural Inputs Access Programme (NAAIAP) was envisioned as a safety net programme that would address the problem of food insecurity and poverty among resource poor farmers with the stated objectives of improving access to and affordability of key inputs for smallholders with less than one hectare of land while addressing the Millennium Development Goal of reducing extreme hunger (Sheahan et al., 2014; Kiratu et al., 2014) through increased productivity and reinvestments into agriculture. Kilimo plus one of the components of the NAAIAP programme targets resource poor farmers owning less than a hectare of land. Farmers are identified, vetted and recruited into this programme through the help of community multi-sectorial stakeholder organizations, local leaders and extension agents. Once qualified for the programme the farmer is issued a grant voucher redeemable at an accredited stockist that entitles them to a starter kit of 10 kg certified seed, 50 kg basal fertilizer and 50 kg top dressing fertilizer with the overall objective of building stockist capacity and strengthening the agro-dealer input supply networks throughout the country.
The stockist then redeems in cash the equivalent of the voucher face value from the governments appointed financial agent or District Agricultural Offices (NAAIAP Design and Implementation Framework, 2009). Targeted farmer would receive the Kilimo Plus “starter kit” for two agricultural seasons before graduating to the Kilimo Biashara Package where farmers would pay for inputs at the market price but receive subsidized credit from local financial institutions (Sheahan et al., 2014). The group approach would be used for initial entry training to deliver capacity building through field days and demonstration while at the same time serving as resource mobilization agents though cereal banks and warehouse receipting schemes that would cushion farmers against grain price fluctuations and provide capital and collateral for suc-cessive production (NAAIAP Design and Implementation Framework, 2009). The initial projected cost per farmer for the starter package and training to be provided by the government extension agents was estimated at US$211 (Government of Kenya, 2006).
Selection of project districts is done on the basis of (i) suitability for maize, sorghum and/or millet production, (ii) high incidences of poverty (iii) lack of similar programs in the district (Sheahan et al., 2014). Within the implementing districts, the program used participatory approaches in the selection of beneficiary farmers, conducted through multi stakeholder community based committees. These stakeholder forums comprised the basic implementation units of the program and were created to ensure fairness in the selection of beneficiaries and participating input dealers (Ministry of Agriculture, 2011).
In assessing the key impacts of NAAIAP during a recent FAO workshop1 on smallholder maize production, Ms. Rose Mwangi mentioned that the project has succeeded in creation of demand for extension, inputs, markets, credit and partnerships, increased production from 4 to 20 bags per acre and reduced distances to input sources from 15 to 35 km down to 3 to 9 km. She says in future, NAAIAP targets to reach 2 million more farmers, but this would require an investment of Kshs. 18.7 billion. The programme also expects to generate 26 million bags of marketable maize valued at Kshs. 78 billion, and to develop a grain market pull system that will attract more supply and enhance utilization of improved inputs. Odame and Muange (2012) however identified weaknesses in program design and implementation that favored farmers and agro-dealers who were already experiencing sufficient agricultural productivity compared with their counterparts who faced greater agricultural difficulties.
Additionally they criticize the project for focusing on maize to the exclusion of other potential staple crops as an example of a ‘one-size-fits-all’ policy; they also identify a critical need to simplify the voucher redemption process possibly by devolving it to lower administrative units or contracting the redemption function to private financial institutions.
Although the implementation of the program has been constrained by stockist apathy due to bureaucratic go-vernment procedures, climate change, pest and viral disease attacks on maize, fluctuating input prices, weak group structures leading to weak cereal banks, poor tar-geting, erratic and delayed disbursement of funds, double allocation, leakages (sale of inputs to non – beneficiaries or agents for immediate cash) and inadequate group development to aid reduced cost of input distribution and to aid in collective marketing. Kiratu et al. (2014) examining qualitative data from the project found out that most farmers perceived the programme positively.
NAAIAP is implemented through project districts that are identified based on a certain set of predetermined criteria key amongst them being the level of poverty and vulnerability within the district. The Ministry of Agriculture runs a separate subsidy program through which the government sells inorganic fertilizers to farmers through the National Cereals and Produce Board (NCPB) at prices lower that the prevailing commercial rates (Sheahan et al., 2014; Mather and Jayne, 2011; Peter and Rotich, 2013). Each beneficiary district in any given season is allocated an average of 1000 grant vouchers valued at between Kshs. 6000 – 8000 (US$68-91) depending on the prevailing world input price. After issuance of the inputs the farmer is then trained and supported by the extension system through visits, demonstrations, field days and other training methodologies to ensure that they use the inputs for the given season and to avoid leakages and stockpiling. At the point of issuance of the inputs a baseline questionnaire is administered to the beneficiary in which their initial production and household information is captured and this is followed afterwards by a second impact questionnaire to the same beneficiary to now capture the production, income and welfare effects accredited to participation in the programme. A sample of 10% of the beneficiaries in every season in every district is taken for the baseline and impact survey by extension agents and questionnaires collected, sorted and data entry and cleaning done by the Agribusiness Officers at the division and district level.
Previous studies that have attempted to study the effects subsidies have on the agricultural sector tended to focus on household fertilizer use decisions (Ariga et al., 2010; Alene et al., 2008; Jama and Pizarro, 2008), “crowding in” or “crowding out” effects within the private fertilizer market (Omiti et al., 2007; IFPRI, 2012) and generally whether there is a case for subsidies that can be supported by commensurate increases in production and productivity (Alene et al., 2008; Jama and Pizarro, 2008; Dorward et al., 2011; Druilhe and Hurle, 2012). Fewer other studies have focused on targeting and impacts of fertilizer subsidies on vulnerable farmers (IFPRI, 2011; Chibwana et al., 2010; Sheahan et al., 2014) with findings from these studies indicating that poor and vulnerable households were in most programs not the final primary beneficiaries of the subsidized inputs. This study has therefore taken a more direct approach, given that it has been done in a predominantly poor and vulnerable district and therefore from the onset, close to all farmers who benefited from this programme are either poor and vulnerable or could not afford to buy inputs given their high cost and/or low returns from their production activities. Among the factors found to be closely correlated with greater fertilizer adoption and use are farming systems, crop type, education, family headship, farm size, credit access, and income from off – farm employment (Chibwana et al., 2010). This study using data from the 2009/2010 agricultural season seeks to estimate the subsidy effects of the NAAIAP program on poor and vulnerable farmers of Tana River Sub-County. To control for errors of inclusion and exclusion (Coady et al., 2002) the study focused on those farmers who had actually received vouchers. Community-based targeting has been advocated as a participatory approach and is the method of choice for the entire program.

farming as their main source of livelihood, changes in income are better explained by the impact of subsidies. The other reason being that because this is a household that had not before received any form of support in terms of subsidies their baseline income would be a good measure of their initial marginal livelihood state.
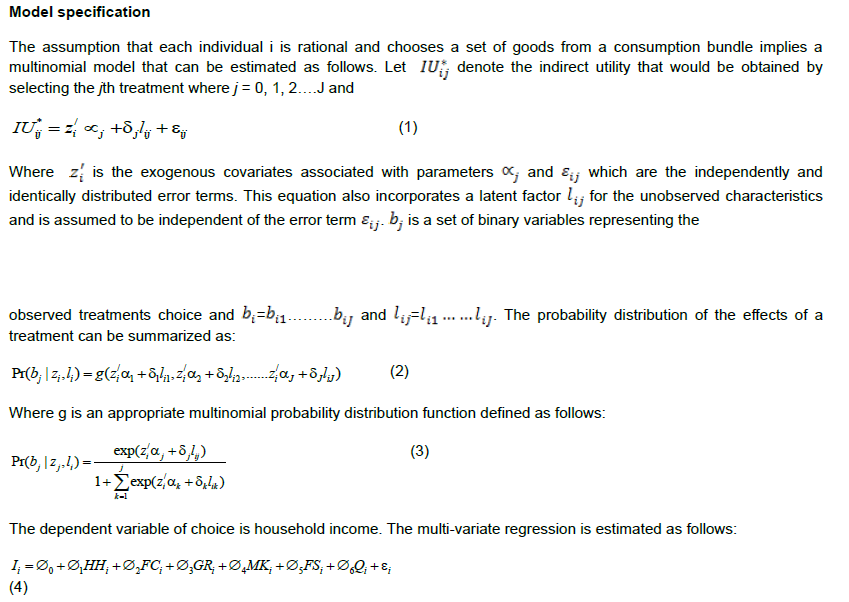
Explanatory variables include, Vector HH which represents household characteristics including age, education, household size, and farm size. Farmers demand for fertilizer is influenced largely by the farmer’s capacity to invest in fertilizer use, commodity and fertilizer prices, profitability of fertilizer use, crop yield response to fertilizer and availability of complementary inputs. These factors are largely influenced by the decision making characteristics of the household. Studies find age to be negatively correlated with fertilizer use (Doss and Morris, 2001; Feder and Umali, 1993; Feder et al., 1985) however in poor households their circumstances leave little options for choice and so we expect that this would be different. The age of the household is measured in number of years while the sex of the household head is represented by a dummy variable equal to 1 if the household is male, otherwise equal to 2. Our hypothesis is that if targeting considers vulnerability then age will be a key indicator for determining beneficiaries especially if the programme targets elderly-headed households. We predict that since female headed households are more vulnerable than male headed households we expect that female headed households will be preferred to male headed households in the targeting process. GR represents the group variable that captures group membership, and savings mobilization activities (Table 1).
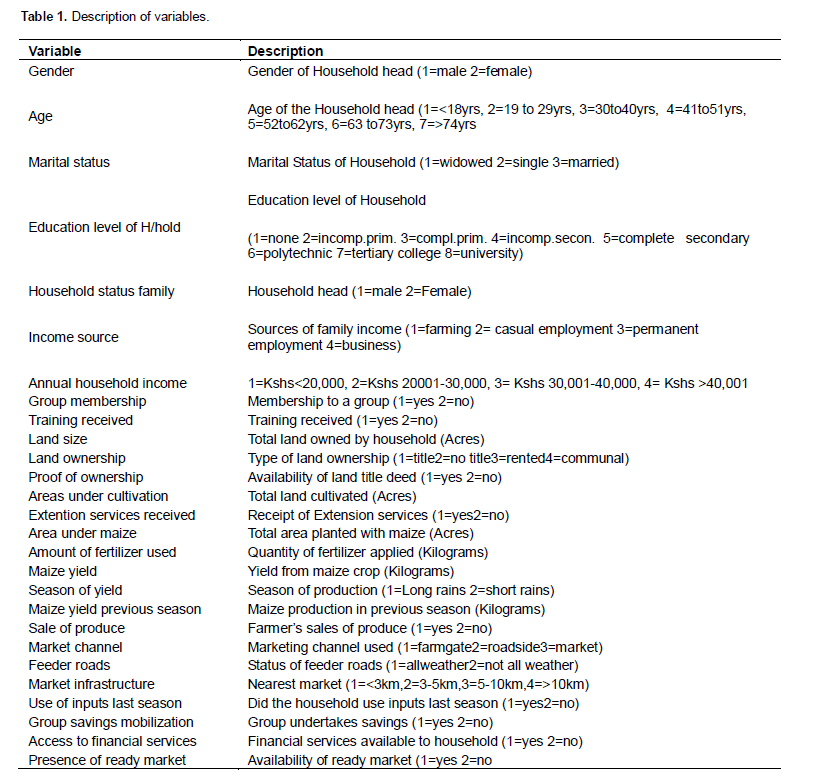
FC represents the farm characteristics variable which includes area of land under maize cultivated during the 2009/2010 agri-cultural season measured in hectares. Farm characteristics include land registration, ownership, and size. Farmer’s use of inputs in the previous season, other crop enterprise within the farm, livestock type and number, and extension service received. We hypothesize that larger farm sizes provide incentives for farmers to maximize productivity and land ownership also provides security of tenure thereby allowing the farmer to invest more capital into production.
MK represents produce marketing in which we allocate a dummy variable of 1 if the farmer sold produce and 2 if otherwise, which captures data on sale of produce in the last season with. Studies have shown that market orientation plays an essential role in assuring better incomes and welfare levels for smallholder producers, and therefore contributes to poverty alleviation. In addition, by creating demand for production inputs and investment goods, markets promote economic growth and providing better market access is more likely to induce smallholder farmers to commercialize (Azam et al., 2012). Produce marketing also captures the details of quantities used on the farm, sold, value and the marketing channels include farm gate, roadside or market sales.
Studies have shown that transaction costs determine the level of produce and marketing channels available to farmers which in turn affects the cost of goods delivered to the market and the amount of sales returns accruing to the farmer (Smale and Jayne, 2003; Alene et al., 2008; Omiti et al., 2007). This variable also considers the status of feeder roads in the area and assigns a dummy variable of 1 for all weather roads and 2 for roads that are impassable during rainy seasons. Distance to agro – input stockists tests both for the access to inputs, and captures the cost of access and sustainability of the programme once the farmers are weaned into the more commercially oriented Kilimo Biashara component of NAAIAP. Distance from the agro-dealer also captures information on the overall impact of the programme in reducing the distance traveled by farmers through making fertilizer available at a distance that is cost effective to the farmer. Distance to the market employs a dummy variable of one to four for a distance of between less than three kilometers to over ten kilometers. Market infrastructure and institutional aspects of market access are crucial for improving opportunities of smallholders for increased market participation and in addition to determining market orientation; infrastructural and institutional conditions also have a significant bearing on scale of smallholder production (Tung et al., 2007).
Financial services is captured by the FS variable and includes both formal and informal financial services available and accessible to the farmer, distance to the nearest financial service provider, access which is assigned a dummy variable value of 1 for access and 2 for otherwise. For those that have accessed financial services this variable also captures the type of financial service preferred by the farmer. Major constraints to production by smallholder farmers includes high cost of inputs, inadequate market access, poor infrastructure and exploitation by middle men (MAFAP, 2013), financial services therefore give farmers the requisite capacity to access inputs and capital to invest in production. We hypothesize that farmers demand for fertilizer is closely correlated to the farmer’s capacity to access credit given the availability of these input services at the right time and affordable prices.
Q is a vector of other control variables. The model controls for households participation in the labour market, ownership of household business, remittances, region and rainfall. Given that participation in the labour market, ownership of household business, and remittances all affect the level of a household’s affordability of inputs. Region and rainfall are controlled for given that the farmers are all from Tana River County and that rain fed agriculture is close to non-existent in this region.
In this study we use cross sectional data from the 2009/2010 agricultural season NAAIAP programme beneficiaries collected from households in Tana River County, specifically Tana River Sub-County covering a total of 1,000 beneficiary households. A sample of 200 households is used for both baseline and impact analysis.
MODEL RESULTS AND DISCUSSION
Descriptives and observations
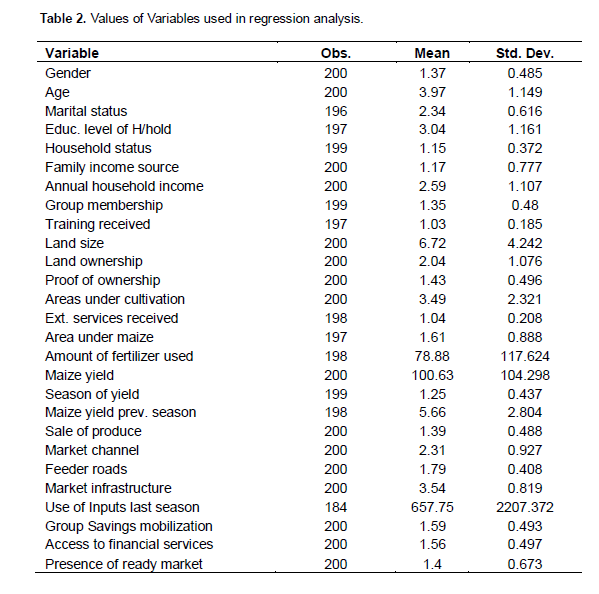
Observations and descriptive analysis results in Table 2 indicate that majority the respondents were males aged between 41 and 51 years of age with primary level of education and whose main source of income was farming that earned them an average of Kshs. 30,000 to Kshs 40,000 ($330 – 430) annually. Farmers in the study area did not have titles to their pieces of land with each farmer owning an average land size of 7 acres of which only half was utilized for production giving an average maize yield of 100 kgs. Farmers sold their produce mainly through road side markets that were located close to their farms. The study also observed that farmers had not accessed financial services despite such services being within reach a factor that could be attributed to their lack of collateral and low levels of realized annual incomes.
The Multinomial Logit (MNL) model offers certain advantages in treatments where there are unobserved products attributes, it is a preferred method where the dependent variable in question is nominal and is made up of more than two categories. Results for the MNL are presented in Table 3. Annual household income is used as a measure of the level of poverty and vulnerability at the household level. Contrary to programme design and objectives our results indicate that at lower levels of annual household income only sales and group savings correlate positively to annual income.
Education levels, market infrastructure and group membership were significant but did not contribute positively to increased household incomes amongst the very poor. In very low level income households what is sold at the farm gate contributed to a very large extent to the family income and in most cases due to the formalities of credit availability and low levels of education groups become an important and in many ways a sole source of credit for reinvestment into agriculture, partly accounting for the highly negative but significant relationship between extension services and household income. Hahlbrock and Hockmann (2011) in Russia, support the fact that group affiliation has a positive effect on the performance of the farm. Similar studies in Mali (Baden, 2014) find that group members were more empowered than non-members in the realms of decision-making over agricultural income, access to credit, technology transfer and freedom of movement. Farming households either store, sell or consume farm produce. The potential for and wisdom of storing, consuming or selling and saving the earnings from retail purchases are determined primarily by the spread between farm gate and retail market prices, shifts in this relationship between these prices from one season to the next affect farmers profoundly and group saving not only provide financial security and a low cost form of insurance but provide a viable option for smoothing out market volatility effects.
In the middle incomes category marital status and group savings were found to be significant and positively affected annual household incomes with household status, land size, use of inputs, group membership and having a ready outputs market remained significant but did not have a positive influence on household incomes. Uneze (2013) confirms that savings is important for accumulation of capital required to generate future incomes and as such group savings have been shown to be vital for securing credit and low interest loans. In a predominantly polygamist Islamic community like the one in which this studies were carried out marital status is commensurate with larger families and more labour and thus more income, given that women and children are known to be most active in farm work. The study found out that in the middle income category land size is also a significant.
At higher levels of household income only sales had a positive and significant effect on income this could be attributed to the fact that at higher levels of income farmers are better linked to and integrated into the market than lower income farmers and thus are already experiencing the benefits of commercialization. Whereas season of yield and use of inputs were found to have a significant impact on the incomes of this category of farmers this effect was found to be indirect. This could explain the fact that most farmers at these levels of household incomes find fertilizer purchase and use extremely unaffordable with each purchase having a direct negative effect and sometimes leaving a huge impact on household income and this could account for the reasons why farmers at these levels of poverty and vulnerability fail to use these inputs. This being a predominantly arid and semi-arid area commodity markets are also prone to shocks (droughts and relief supplies) that cause crop prices to behave in “contra-seasonal” manner.
When controlled for use of fertilizer in the last six months, season of yield assumed positive significance of the low income farmer group. For farming communities that depend on the fluctuating commodity markets where the relationship between the seasonal production and prices greatly affect household incomes, cyclical seasonal price quantity variations in the markets therefore determine to what extent the farmer can recoup investments and derive benefits from market sales and farming. Similar scenarios prevail for the middle income category of farmers with sales becoming significant as well. Thus the covariance of price and farm incomes, and the opportunities and ability to produce intertemporally at reasonable cost determines the extent of transitory benefits of fertilizer use.
CONCLUSION AND POLICY IMPLICATIONS
The National Accelerated Agricultural Inputs Access Program (NAAIAP) was designed by the Kenyan government as safety net program for poor farmers who did not have adequate financial resource to purchase farm inputs during every production cycle and to address the issues of extreme hunger and poverty in line with the Millennium Development Goals (MDGs). This program was intended to benefit those households that were before then using insufficient or no fertilizer and seeds for their production. However, results from our analysis indicate that even within the poor and vulnerable farmers such a blanket program fails to achieve its objectives given the disparities and resource endowments in the various groups of farmers due to their productive capacity and income levels.
Contrary to programme design and objectives our results indicate that at lower levels of annual household income only sales and group savings correlate positively to annual income. In the middle incomes category marital status and group savings were found to be significant and at higher levels of household income only sales had a positive and significant effect on income. Market access plays an essential role in assuring better income and welfare levels for smallholder producers, and thus contributes to poverty alleviation. The majority of the smallholders in Kenya cultivate their farms for subsistence and very little of this production gets to the market.
These results are consistent with previous research studies (Azam et al., 2012; Omiti et al., 2007; Tung and Costales, 2007) on smallholder market access, who found out that by creating demand for production inputs and investment goods, markets promote economic growth. In addition Market linkages, support infrastructure and structures that are friendly to the poor and vulnerable are essential. However at village level, market participation is hampered by poor quality and high cost of inputs, high transaction costs, high market charges and unreliable market information. However significant provision of inputs to poor farmers may be to reduce their production costs market infrastructure and institutional aspects of market access are crucial for improving opportunities of smallholders for increased market participation and in addition to determining market orientation; infrastructural and institutional conditions have a significant bearing on scale of small holder production.
This study proposed the introduction and/or strengthening of Farmer Saving groups (FSGs) which are self-managed community-based groups composed of between 10 and 20 members that provide basic financial services to their members as a key component of the NAAIAP program. These groups respond directly to felt needs within the community through provision of secure saving platforms, basic loaning facilities with flexible terms and some form of insurance against fluctuations in the market. These groups offer simple and cost effective entry level financial services to people who are poor or isolated from mainstream financial service providers.
Market linkages and participation project components, and lobbying for policies that link farmers to markets and market supporting and enhancing infrastructures are essential elements of the project that needs to be incorporated into the NAAIAP programme. Development of farmer friendly markets, small scale value addition projects and smallholder market access support, protection and capacity building will help enhance confidence in smallholder farmers and strengthen their footprint in the output market.
The authors have not declared any conflict of interest.
REFERENCES
|
Ariga J, Jayne TS (2009). Private Sector Responses to Public Investments and Policy Reforms: The Case of Fertilizer and Maize Market Development in Kenya. IFPRI Discussion Paper 00921. Washington DC.
View
|
|
|
|
Ariga J, Jayne TS, Kibaara B, Nyoro JK (2008). Trends and Patterns in Fertilizer Use By Smallholder Farmers in Kenya, 1997-2007. Working Paper Series No. 28. Nairobi, Kenya: Tegemeo Institute.
View
|
|
|
|
Ariga J, Jayne TS, Njukia S, (2010). Staple food prices in Kenya. COMESA Policy seminar paper. AAMP.
View
|
|
|
|
Azam M, Imai KS, Gaiha R (2012). Agricultural Supply Response and Smallholders Market Participation -the Case of Cambodia. RIEB Discussion Paper. Kobe University Japan. |
|
|
|
Baden S (2014). Women's economic empowerment and collective action in agriculture: new evidence and measurement challenges. Policy Briefs 68 Future Agricultures. April 2014.
View
|
|
|
Banful AB (2011). Old Problems in the New Solutions? Politically Motivated Allocation of Program Benefits and the "New" Fertilizer Subsidies. World Dev. 39(7):1166–1176.
Crossref |
|
|
|
Chibwana C, Fisher M, Shively G (2010). Land allocation effects of agricultural input subsidies in Malawi. Purdue University, West Lafayette, IN. |
|
|
|
Coady D, Grosh M, Hoddinott J (2002). Targeting of Transfers in Developing Countries: Review of Experience and Lessons, Social Safety Net primer series, Social Protection Anchor.
View
|
|
|
|
Crawford EW, Jayne TS, Kelly AV (2006). Alternative Approaches for Promoting Fertilizer Use in Africa. Agriculture and Rural Development discussion paper 22. World Bank, Washington D.C. |
|
|
|
Dorward A, Chirwa E, Jayne T (2011). Malawi's Agricultural Inputs Subsidy Programme over 2005-2009. In: Chuhan-Pole, P and Angwafo, M, (eds.), Yes Africa can: Success stories from a dynamic continent. Washington D.C.: World Bank. |
|
|
Doss CR, Morris ML (2001). How does gender affect the adoption of agricultural innovations? The case of improved maize technology in Ghana. Agric. Econ. 25(1):27-39.
Crossref |
|
|
|
Druilhe Z, Hurle JB (2012). Fertilizer subsidies in sub-Saharan Africa. ESA Working Paper No. 12-04. FAO, Rome. |
|
|
|
Dugger CW (2007). Ending Famine, Simply by Ignoring Experts. New York Times, December 2. |
|
|
|
Eleni G (2009). A market for all farmers: Market institutions and smallholder participation. The center for effective global action. UC. Berkeley. |
|
|
Feder G, Umali DL (1993). The adoption of agricultural innovations: A Review. Technol. Forecast. Social Change 43:215-239.
Crossref |
|
|
Feder G, Just RE, Zilberman D (1985). Adoption of Agricultural Innovations in Developing Countries: A Survey. Econ. Dev. Cult. Change 33(2):255-298.
Crossref |
|
|
Filipski M, Taylor JE (2012). A Simulation Impact Evaluation of Rural Income Transfers in Malawi and Ghana. J. Dev. Effect. 4(1):109-129.
Crossref |
|
|
|
Government of Kenya (2006). The National Accelerated Agricultural Inputs Access Program: Program Design and Implementation Proposal. Nairobi, Kenya. |
|
|
|
Gugerty MK, Cook J (2009). Political Economy of Fertilizer Policy in Kenya. Brief. Seattle: Evans School Policy Analysis and Research. University of Washington. |
|
|
|
Gurara DZ, Salami AO (2012). Towards Sustaining Malawi's Farm Input Subsidy Program". Afr. Econ. Brief. 3(4). |
|
|
|
Hahlbrock K, Hockmann H (2011). Influence of the intergration of agroholdings with Russian farms on total factor productivity and its subcomponents. Institute of agricultural development in central and Eastern Europe (IAMO). GEWISOLA Germany. |
|
|
|
IFDC (2012). Kenya Fertilizer Assessment. June 2012. IFDC. USA.
View
|
|
|
|
IFPRI (2011). Malawi strategy support program (MaSSP). International Food Policy Research Institute (IFPRI) Policy Note 5. March 2011. Washington DC.
View
|
|
|
|
IFPRI (2012). Nigeria strategy support program II. Impact of fertilizer subsidies on the commercial fertilizer sector in Nigeria: Evidence from previous fertilizer subsidy schemes. International Food Policy Research Institute (IFPRI) Policy Note 34. October 2012. Washington DC. |
|
|
Jama B, Pizzarro G (2008). Agriculture in Africa: Strategies to improve and sustain smallholder production systems. UNDP, New York USA.
Crossref |
|
|
|
KENFAP (2011). The role of warehouse receipt system and financial services in improving produce marketing by smallholder farmers in Kenya.
View
|
|
|
|
Kimuyu P (1994). Evaluation of the USAID/Kenya Fertilizer Pricing and Marketing Reform Program. USAID/Kenya, Nairobi. |
|
|
|
KIPPRA (2013). Kenya Economic report 2013. Kenya Institute for Public Policy Research and Analysis. Nariobi Kenya. |
|
|
Kiratu NM, Ngigi M, Mshenga PM (2014). Perception of smallholder farmers towards the kilimo plus subsidy program in Nakuru North district, Kenya. IOSR J. Agric. Vet. Sci. 6(6):28-32.
Crossref |
|
|
|
Levy S, Barahona C (2002). Main report of the evaluation program: 2001-2002 targeted inputs program. London: Department for International Development. |
|
|
|
MAFAP (2013). Review of food and agricultural policies in Kenya. MAFAP Country Report Series, FAO, Rome, Italy.
View
|
|
|
|
Mather D, Jayne TS (2011). The Impact of State Marketing Board Operations on Smallholder Behavior and Incomes: The Case of Kenya. International Development Working Paper 119. East Lansing, Michigan: Michigan State University.
View
|
|
|
|
Minde I, Jayne TS, Crawford E, Ariga J, Govereh J (2008). Promoting Fertilizer Use in Africa: Current Issues and Empirical Evidence from Malawi, Zambia and Kenya. Department of Agricultural Economics, Michigan State University, Lansing, Michigan. Policy Synthesis No. 83.
View
|
|
|
|
Ministry of Agriculture (2011). Final Report: NAAIAP Program Evaluation. Nairobi, Kenya: Government of Kenya. |
|
|
|
Minot N, Benson T (2009). Fertilizer Subsidies in Africa: Are Vouchers the Answer? Washington, DC: International Food Policy Research Institute. IFPRI Issue Brief 60.
View
|
|
|
|
Odame H, Muange E (2012). Can Agro-dealers deliver the green revolution in Kenya? Future Agricultures Consortium DFID UK. Future Agricultures Policy Brief No. 45.
View
|
|
|
|
Omiti J, Nyanamba T (2007). Using social protection policies to reduce vulnerability and promote economic growth in Kenya. Futures Discussion Paper No. 012. DFID UK.
View
|
|
|
|
Peter K, Rotich G (2013). Factors Affecting the Effectiveness of the Supply Chain of Subsidized Fertilizer in Kenya: A Case Study of the National Cereals and Produce Board. Int. J. Soc. Sci. Entrep. 1(7):1-25. |
|
|
|
NAAIAP (The National Accelerated Agricultural Input Access Program) Republic of Kenya (2009). The National Accelerated Agricultural Input Access Program (NAAIAP): Program Design and Implementation Framework 2009/2010. Nairobi: Ministry of Agriculture. |
|
|
Sheahan M, Black R, Jayne TS (2013). Are Kenyan farmers' under-utilizing fertilizer? Implications for input intensification strategies and research. Food Policy 41:39-52.
Crossref |
|
|
|
Smale M, Jayne T (2003). Maize in Eastern and Southern Africa: "seeds" of success in retrospect. Environment and production technology division. IFPRI, Washington D.C. U.S.A.
View
|
|
|
|
Tung DX, Costales A (2007): Market participation of smallholder poultry producers in Northern Vietnam. Research Report Pro-poor Livestock Policy initiative. A living from Livestock.
View
|
|
|
|
Uneze CU (2013). Socio-Economic determinants of savings in cooperatives by farmers of selected agricultural group lending schemes in Anambra state, Nigeria. Greener J. Agric. Sci. 3(5):384-390. |
|
|
|
Yamano K, Arai A (2010). Fertilizer Policies, Price, and Application in East Africa. GRIPS Discussion Paper 10-24. GRIPS National Graduate Institute for Policy Studies, Japan. |