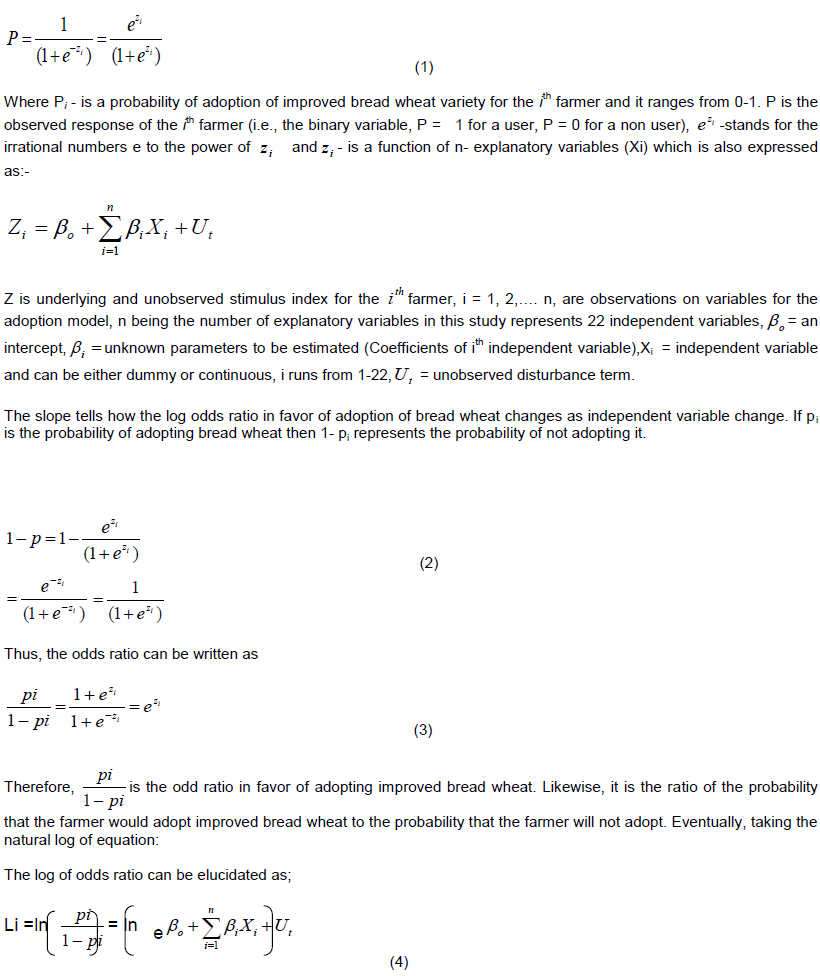
ABSTRACT
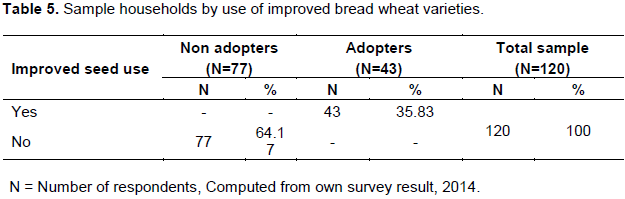
Yilmana Densa is one of the potential wheat growing District in West Gojam Zone, but the level of adoption is not studied for the last 15 years and a number of farmers are still using local varieties which are known for their low yield and disease susceptibility. Therefore, the purpose of this study was to identify potential factors affecting adoption of improved bread wheat variety, using the logistic regression (binary logit) analysis. A three stage (purposive for wheat growing kebeles, simple random sampling for sample kebeles and systematic random sampling for sample households) sampling procedure was employed to select the sample households. Finally, 120 sample respondents were selected from the sampling frame based on probability proportional to size (PPS) of wheat growers using systematic random sampling procedure. Secondary data (sampling frame, population, productivity etc) were collected from different sources. Quantitative data (farm income, farming experience, farm size, family size, etc), qualitative data (access to; credit, extension contact, input, field day etc) were also gathered. The result indicated that out of 21 identified explanatory variables, 11 of them had affected adoption significantly. Over all, of 120 sample respondents, only 35.83% (N=43) were found to be adopters of improved bread wheat varieties whereas 64.17% (N=77) of wheat growing farmers are being used local variety named Kubsa which was released before two decades and became susceptible to yellow rust and other foliar diseases. Institutional factors have been found overweighed than individual, economic and kebele (the lowest administration hierarchy in Ethiopia) level factors. The study revealed that giving due consideration for the significant variables would promote the adoption of improved bread wheat varieties. Furthermore, policy and development interventions should also be consolidated. The model result indicated that (the model chi-square value) the parameters indicated in the model taken together were significantly different from zero at less than 1 percent level of significance. The value of chi-square (×2 = 105.24) also indicated the goodness of fitted model. The chi-square goodness-of-fit test statistics of the model shows that the model fits the data with significance at 1% level. This shows that the independent variables are relevant in explaining the farmers’ decision to adopt improved bread wheat varieties.
Key words: Adoption, bread wheat, logit model, Yilmana Densa.
Ethiopian economy is highly depending on the performance of the agriculture. The agricultural sector accounts for 45 percent of national GDP, 83.9% of export earnings and 85% of employment opportunity (CIA, 2010). In spite of tremendous efforts by the government, Ethiopia is still among the poorest developing countries with an annual average per capital income of US470 in 2013 (WDB, 2013). Despite its importance in the livelihood of the people and its potential, the sector has been dominated by smallholder subsistence production and traditional technologies are predominant. Hence, level of productivity in agriculture is very low due to, among others; low rate of the adoption of improved technologies (Bayissa, 2010). Ethiopia is the largest wheat producer in sub-Saharan Africa (MOA, 2011). Nationally, wheat ranks fourth in both total area coverage (1,627,647.16 ha) and production (3,434,706.122 ton). Among cereals, it is also the third in productivity which is 2.11ton/ha after maize and rice 3.05ton/ha and 2.89ton/ha, respectively (CSA, 2013). So far, the Amhara Regional Agricultural Research Institute (ARARI) has released a number of wheat varieties by its own and in collaboration with the national and/or international research institutes, but the productivity of wheat for the region is below the national average which is 1.78ton/ha as compared to 2.11 ton/ha of the nation (CSA, 2013). This is mainly due to, among others, lack of farmers participation in variety selection processes (have low contact with researchers), lack of system to follow on demand driven and problem oriented issues and this followed by low adoption. A lot of efforts have been done in the generation of improved varieties through the formation of Farmers Research Groups (FRGs), but generation of technology is not an end by itself, unless it reaches to the end users.
Even though the district has high potential (agro-ecologically) for wheat production, a number of farmers are still using the old varieties that have been released before two decades. These varieties are becoming highly susceptible to disease and their yield is also deteriorating from time to time (because of the rust problems). On one hand, there are many high yielding and disease resistant improved bread wheat varieties released by Amhara Regional Agricultural Research Institute (ARARI) and Ethiopian Institute of Agricultural Research (EIAR). On the other hand, farmers of the district are still growing old varieties and some reduce their plots allotted to wheat. Hence, factors affecting the adoption of improved bread wheat varieties were not systematically and empirically studied and recognized in the study district for the last fifteen years that led to an information gap.
Econometric model
A logistic adoption model was utilized to determine factors affecting the adoption of improved wheat varieties. The dependent variable was dichotomous that took two values, 1 if the event occurred and 0 if it did not. Such relationship required the utilization of qualitative response models. In line with this, logit, probit and linear probability models were the likely options. Although Ordinary Least Squares (OLS) regression estimates can be computed for binary model, the error terms are likely to be hetroscedastic leading to inefficient parameter estimates. Consequently, hypothesis testing and construction of confidence interval becomes imprecise and confusing. Likewise, a linear probability model may produce predicted values outside the acceptable 0-1 value which abuse the basic belief of probability. To alleviate these problems and produce relevant empirical outcomes, the most widely used qualitative response models are logit and probit models (Amemiya, 1981).In this study the logit model based on cumulative logistic probability function were employed. According to (Green, 1991; and Gujarati, 1995), the choice between logit and probit models is largely a matter of convenience even though Maddala (1983) and Gujarati (1995) illustrated that the logistic and cumulative normal functions are very close in the mid-range, but the logistic function has slightly heavier tails than the cumulative normal function. That is the normal curve approaches the axis quicker than the logistic curve. Disregarding the minor differences between logit and probit models, Liao (1994) and Gujarati (1995) indicated that the probit and logit models are quite similar, so they usually produce predicted probabilities that are almost similar.
In accordance with (Pindyck and Rubinfeld, 1981; Green, 1991; Gujarati, 1995) the logit model is compu-tationally easier to use and leads itself to a meaningful interpretation than the other types.
This paper deals with the objective:
1. To identify potential factors affecting the adoption of improved bread wheat variety using logit analysis (binary logit) which is widely used for binary variables; and suggest possible recommendations?
The Amhara National Regional State (ANRS) is one of the major wheat growing regions of the country. According to Central Statistical Agency CSA (2013), the region shares 30.6% (498,192.03 ha) and 25.87% (888,568.58 ton) of the total area and production of the nation, respectively. West Amhara is the one among wheat potential zones of the region based on the central statistical agency data (CSA, 2013). One District which has profound potential for cereal production mainly wheat is Yilmana Densa. According to Yilmana Densa office of agriculture, annual crops of the district cover 54,501 ha and permanent crops about 1,202 ha annually.
Sampling design
In this study, both qualitative and quantitative methods were employed. Qualitative method included semi structured and unstructured open ended group and individual interview including 6-9 people in depth interview in each kebeles (the lowest administration hierarchy in Ethiopia). Whereas quantitative method comprised surveys, and fixed response close ended structured interview schedule. Primary data (income, education, access to credit etc) and secondary data (number of wheat growing kebeles, number of wheat growing farmers, input distribution etc) were collected. Survey and focus group discussion were utilized to collect primary data and maps, records, reports and personal files were used for secondary data collection (published or unpublished).
Sampling technique
To constitute a sample, probability sampling technique was utilized to reduce or eliminate sampling bias and ensure equal probability of selection.
Sampling procedure
In the course of the study a three stage sampling technique was employed. At stage one; purposive selection of bread wheat growing Kebeles of the district using the secondary data on production and area coverage of bread wheat was undertaken. Stage two, out of identified bread wheat growing Kebeles of the district, three bread wheat growing Kebeles were randomly selected due to their similar production practices and agro ecology. Prior to selecting household heads to be considered in the sample, bread wheat grower household heads of each rural Kebeles were identified in collaboration with Kebele leaders, key informants and development agents of the respective Kebele. Moreover, the already recorded list of bread wheat growing households available at the selected Kebele offices has been utilized. At stage three, sample farm household heads were selected from the sampling frame based on probability proportional to size of wheat growers (PPS) using systematic random sampling procedure in each of three selected Kebeles. This is due to the presence of high communalities. Using farm-level data collected from a systematic random sample of 120 household heads selected based on probability proportional to size (PPS) of wheat growers using systematic random sampling procedure.
Method of data collection
The survey was administered and primary data was collected from sample household heads using a structured interview schedule. Before starting the actual data collection, the interview schedule was pre –tested enabling the modifications of some of the questions which were irrelevant to the current situation and out of context. Six enumerators (two per kebele) were trained in the context of the interview schedule, method of data collection and on the appropriate way to approach farmers. Primary data were collected from sample respondents through a structured interview schedule, which was intended to generate data on some personal, institutional, economic and demographic variables which are hypothesized to influence adoption decision of the households in the study. Frequent field visits were made before the actual survey to get general information of the targeted Kebele’s. The interview schedule was pretested and 6 farm households outside the sample farmers were interviewed, at the rate of one farmer by each enumerator. Following pretesting, the second meeting was conducted with enumerators about the clarity of the interview schedule, language, unexpected responses and additional response options. Following the necessary corrections, the final version of the interview schedule was arranged. Frequent supervision was made by the principal researcher to correct the likely errors on the spot. Secondary data were obtained from different sources like district office of agriculture, Ministry of Agriculture (MoA), Central Intelligence Agency (CIA), Central Statistical Agency (CSA) etc. Information from published and unpublished sources including maps was exploited in the study.
Key informant interview
Information gathering by key informant interview is as important as information gathered through formal interview schedule. Hence, groups which combined elders, religious leaders and familiar people in the village were purposively selected in each kebele and pair wise ranking was utilized to rank and prioritizing problems.
Focus group discussion
Focus Group discussions were conducted in 3 Kebeles. Each group comprised of 8 to 12 participants. The participants were selected randomly from the study area. In the study, dependent variables were dichotomous. Considering those farmers cultivated improved bread wheat seed and use recommended in organic fertilizer for two and more years as adopters and those not cultivating currently as non adopters. Finally the data were analyzed based on the interviewed sample respondents. In the study the logit model based on cumulative logistic probability function were employed. In line with, Maddala (1983), Green (1991), Gujarati (1995) the logistic distribution function for the adoption of bread wheat can be specified as:


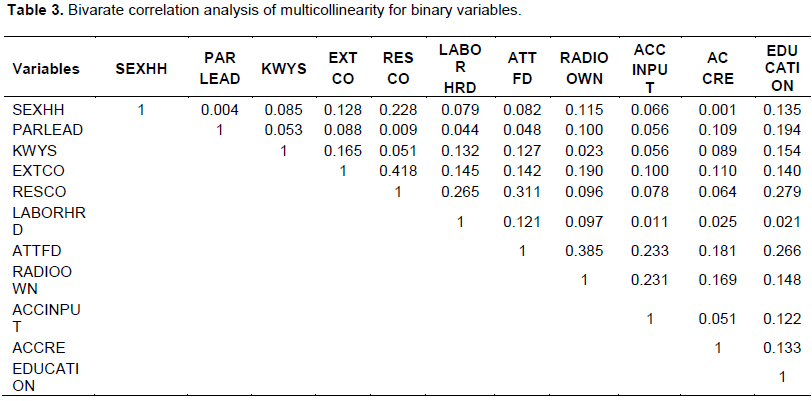
Where Li = is log of the odds ratio in favor of improved bread wheat adoption, which is not only linear in xi but also linear in the parameter. This model can be estimated using the iterative maximum likelihood (ML) estimation procedure. In reality, the significant explanatory variables do not have the same level of impact on the adoption decision of farmers. The relative effect of a given quantitative explanatory variable on the adoption decision is measured by examining adoption elasticity. The variables that were assumed to influence the adoption decision of improved bread wheat were tested for multicollinearity. The parameters ( ) of the model were estimated utilizing the iterative maximum likelihood (ML) estimation method. The model was assessed for its goodness of fit by probing how well the model classifies the observed data. The result indicated that (the model chi-square value) the parameters indicated in the model taken together were significantly different from zero at less than 1% level of significance. The value of chi-square (×2 = 105.24) also indicated the goodness of fitted model (Table 3). This shows that the independent variables are relevant in explaining the farmers’ decision to adopt improved bread wheat varieties.
An additional measure of goodness of fit in the logistic regression model has been detected as how much the observed value is correctly predicted. The fit is considered to be good if the overall correct prediction rate exceeds 50% (Callet, 1991, as cited in Abebaw, 2003). In other words, the observation is grouped as an adopter if the computed probability of adoption is greater than or equal to 0.5 (50%), as non adopters, otherwise. Accordingly, the result showed that about 92.2% non adopters, and 88.4% of the adopters were correctly predicted using the cut off value of 0.5. Overall, the model correctly predicted 88.4% of the sample cases (Table 4). Hence the model predicted both adopters and non adopters groups of improved bread wheat variety correctly.
Test of multicollinearity
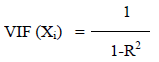
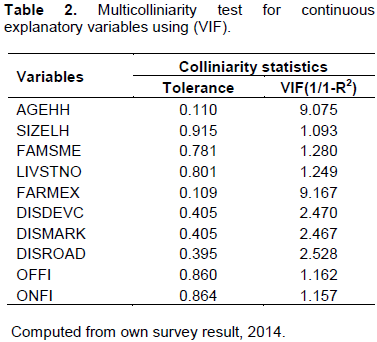
To analyze factors affecting adoption of improved bread wheat varieties, binary ligit model was utilized. Existence of multicollinearity among the continuous variables was checked and association among the dummy variables was verified before taking the selected variables in to the logit model. Problem of multicollinearity arises due to linear relationship among explanatory variables; result could not obtain unique estimates of all parameters (Gujarati, 1995). This leads to a very low t-ratio and wide confidence interval with large variance and standard error. Both continuous and dummy variables were checked for multicollinearity before run the logit model. Among different methods, variance inflation factor (VIF) for continuous explanatory and contingency coefficient (CC) for dummy variable was utilized. Based on Gujarati (1995) VIF could be specified as:
Where: R2 is the multiple correlation coefficients between Xi and other explanatory variables.
For each selected continuous explanatory variable, (Xi) was regressed on all other continuous explanatory variables; the coefficient of determination (Ri2) was constructed for each variable. The larger value of Ri2 the higher the value of VIF (Xi) causing higher collinearity in the variables (Xi). For continuous variables according to (Gujarati, 1995 cited in Mesfin 2005), if the value of VIF is 10 and above, the variables are said to be collinear (if the value of R2 is 1, it would result in higher VIF and causes perfect multicollinearity between the variables). Whereas for dummy variables according to Healy (1985) as cited in Paulos (2002), if the value of contingency coefficient is greater than 0.75, the variables are said to be collinear. Contingency coefficients were computed for dummy variables to detect the problem of multicollinearity).

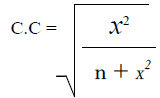
Where: C.C = Contingency coefficient, n = Sample size, x2 = is the chi-square value of a variable.
Heteroscedasticity test also conducted whether the error has constant variance. Prior to running the Logit model, the hypothesized explanatory variables were checked for the problem of linear association among the hypothesized variables (multicollinearity), which can cause the estimated regression coefficients having wrong signs and smaller t-ratios that might lead to wrong conclusions and heteroscedasticity test also conducted. One of the assumptions in regression analysis is that errors (ui), have a common (constant) variance σ2 .If the errors do not have a constant variance; we say they are heteroscedastic (Maddala, 1992). Yet, with the presence of heteroscedasticity the estimated parameters of a regression are consistent, though they are inefficient. In this study, heteroscedasticity was tested for all variables using maximum likelihood estimates (σ = 1.012). Hence, there was no serious problem of heteroscedasticity in the model. Thus, all the important variables were included in the analysis. Variance inflation factor (VIF) was used to check multicollinearity problem among continuous variables and contingency coefficient for discrete dummy variables. The binary logit model (regression) was estimated using maximum likelihood estimation procedure.
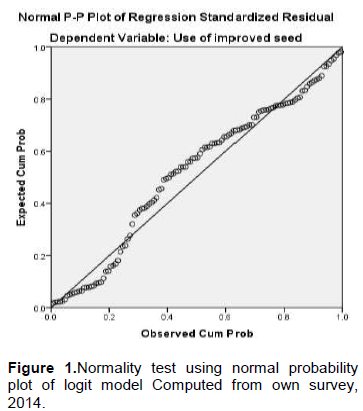
The larger the value of VIF the more collinear the variable Xi is. As a rule of thumb, if the VIF of a variable exceeds 10, there is a multicollinearity problem and if the value of contingency coefficient is greater than 0.75, the variables are said to be collinear. The VIF values are presented in Table 2. The result indicated that all variables have low values. Accordingly, they have been included for further analysis. Similarly, the values of contingency coefficient for the discrete dummy explanatory variables are below 0.75 (Table 3). Hence, all have been included for further analysis, because they have been found to be non linear. To detect whether the error term follows the normal distribution or not the normality test should be performed properly. A simple graphical device to study the shape of the probability density function of a random variable is the normal probability plot. We plot values of the residuals on the horizontal (X-axis) and the expected value of the variable on the vertical (Y-axis).If the variable is from the normal population, the normal probability plot will be approximately a straight line (Damodar, 2003).

Variables and working hypothesis
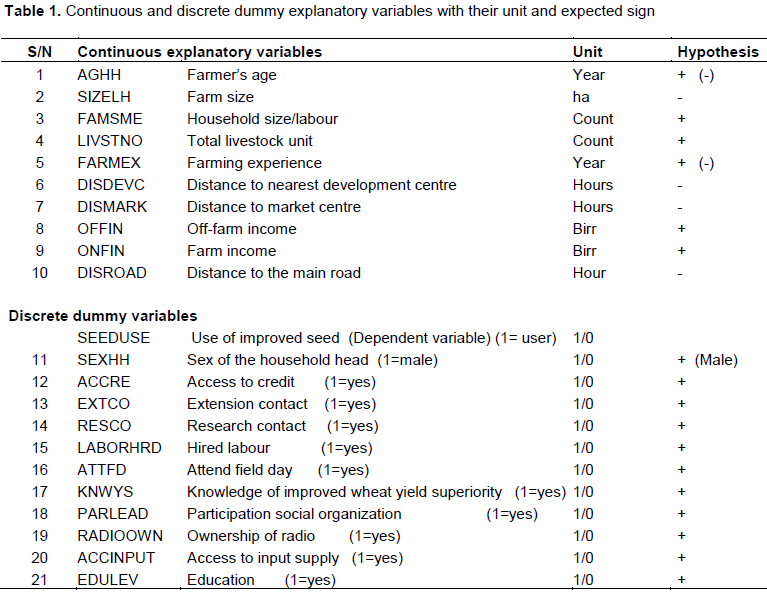
Dependent variable is dichotomous i.e. adopters are those respondents who cultivated one of the improved bread wheat varieties for two and more years and those who are not cultivating currently are considered as non adopters with the value 1 and 0 (1 for a user and zero otherwise). The twenty one independent variables are also listed (Table 1).
Results of econometric model
Figure 1 show that the residuals are approximately normally distributed, because a straight line means the data are rational.
Factors affecting improved bread wheat adoption
Maximum likelihood estimates procedure was utilized to estimate the parameters of the variables that are expected to influence the adoption of improved bread wheat varieties (Table 4). In the model 10 potential continuous and 11 discrete dummy variables were entered. Out of the total of twenty one explanatory variables, 11 variables of which 6 were continuous and 5 were dummies found to be significantly influenced adoption of improved bread wheat varieties. As the model result portrays, the variable access to credit had positively and significantly influenced the likelihood of adoption of improved bread wheat at 1%levelof significance. The result showed those farmers who had access to credit from formal organizations like Amhara Credit and Saving Institution (ACSI) have been found more participants in adoption than those who had not. Similar result was found by Feder et al. (1985) that credit is associated with the use of improved inputs. The study by Legesse (1992) revealed that positive and significant association of credit and use of improved inputs. This result is in line with Lelisa (1998) who studied determinants of fertilizer adoption, intensity and probability of its use that revealed access to credit is one determinant of fertilizer adoption and intensity of its use. Credit plays a significant role in enhancing the technology promotion. As anticipated, credit affects positively and significantly at (p<0.05). The odds ratio in favor of adopting improved bread wheat increased by a factor of 23.93 for adopters who had received credit. The result revealed that the availability of credit had increased adoption decision of the household head on improved bread wheat positively and significantly.
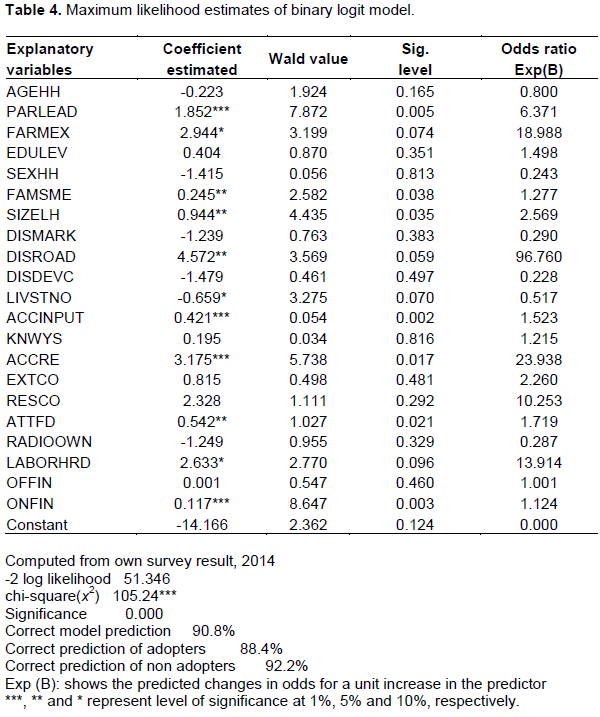
Participation of the household in leadership of social organization assumes that farmers, who have some position in Kebeles and/or other social organizations, are expected to have a variety of information as they are closer to sources of information. As the model result depicts the variable access to participation of the household in leadership of social organization had positively and significantly influenced the likelihood of adoption of improved bread wheat at (p<0.05). The odds ratio in favor of adopting improved bread wheat increased by a factor of 6.37 per unit increase in participation. This study agreed with different findings, such as Dereje (2006) and Almaz (2008) that social participation positively and significantly influenced the probability of adoption.
Labor constraint of farmers can be surmounted through hired labor, especially during critical farm operations, like land preparation, weeding and harvesting. As expected, hired labor had a positive and significant relationship with adoption of improved bred wheat varieties at (p< 0.1). The odd ratio of 13.91 for hired labor implies that other things being kept constant, the odds-ratio in favor of adopting improved varieties increases by a factor of 13.91 as a farmer’ engagement in hired labor increases by one unit. This implies that farmers who have large engagement in hired labor have adopted improved bread wheat varieties than those who had lower engagement. As labor accessibility increases, adoption increases and correlate positively, based on the study by (Yishak, 2005). Participation on field day is one of the means of teaching and learning process of improved technologies. The result of Logit model shows that attend in field day was positively and significantly related to adoption of improved bread wheat variety at (p<0.05) (Table 4). The odd ratio of 1.719 attending in field days implies that other things being kept constant, the odds-ratio in favor of adopting improved varieties increases by a factor of 1.719 as a farmer’ engagement in field days increases by one unit Those farmers who have an access to attend field day of improved bread wheat production fields are more likely to use improved bread wheat variety than those farmers who have no similar opportunity. The result indicates having formal information through field days increases the probability of adoption. This result is in line with Tesfaye et al. (2001). In field days, neighboring farmers will get an opportunity to observe how the new technology is practiced in the field. Access to input supply like improved bread wheat varieties, inorganic fertilizer etc. at the time of planting, increases farmers’ use of improved bread wheat varieties. Conversely, if improved bread wheat varieties seed are not accessible at the time of planting, farmers will allocate their plot of land to other crops. As the model result depicts the variable access to input supply had positively and significantly influenced the likelihood of adoption of improved bread wheat at (p<0.01). The odds ratio in favor of adopting improved bread wheat increased by a factor of 1.523 per unit increase in access to input. Therefore, access to input had increased the probability of adoption of improved bread wheat and this result is in line with the hypothesis set forth. A study conducted by Bayissa (2010) revealed the positive relationship of adoption and improved variety.
Total on Farm income is the main source of capital to cover the costs of farm inputs and other household expenses. In this study the household farm income was estimated based on the sales of crop, livestock and livestock products. The major cash income for sample households in the study area is from sale of crop produce and livestock. The result of Logit model shows that having better farm income was positively and significantly related to adoption of improved bread wheat variety at (p<0.01) (Table 4). The odd ratio of 1.124 total on farm income implies that other things being kept constant, the odds-ratio in favor of adopting improved bread wheat varieties increases by a factor of 1.124 as a farmer’s on farm income increases by one unit. The result was in line with Degnet and Belay (2001) and Kidane, (2001) findings. Family size converted to man equivalent is considered as the total active family members who reside in the respondent’s household. Large family size is assumed as an indicator of labor availability in the family. Large labor force in a family implies that the household may not need to hire more additional labor and the saved money due to use of own labor force will be used for purchasing farm inputs. This will increase household's probability of adoption of improved bread wheat varieties. The result of Logit model shows that family size was positively and significantly related to adoption of improved bread wheat variety at (p<0.05) (Table 4). The odd ratio of 1.277 family size implies that other things being kept constant, the odds-ratio in favor of adopting improved varieties increases by a factor of 1.277 as a farmer’ family size increases by one unit.
As anticipated, farming experience had a positive and significant relationship at (p< 0.1). The odds-ratio of 18.988 for farming experience implies that other things being kept constant, the odds-ratio in favor of adopting improved varieties increases by a factor of 18.8 as a farmer’ farming experience increases by one unit. This implies that farmers who have longer years of experience in farming have adopted improved bread wheat varieties than those who have the lower years of experience in farming. This may be due to relatively farmers who have longer years of experience may develop the confidence in handling the risk, skills in technology application. Different studies have agreed with this argument. For instance, Legesse (1992), Kidane (2001) and Melaku (2005) have described the positive relationship of farming experience with adoption
Land is perhaps the single most important resource, as it is a base for any economic activity especially in rural and agricultural sector. Farm size influences farmers' decision to use or generate new technologies. The result of binary logistic regression analysis indicated that size of land owned had influenced the household decision to adopt improved varieties significantly and positively at (p<0.05) as compared to farmers with small holdings. The decomposition result (Table 4) show as land holding increased by one unit the probability of participation in adoption of improved wheat increases by a factor of 2.569%.This result was not in conformity with the previously hypothesized variable, which stated size of land holding was expected to affect household decision to adopt bread wheat improved varieties negatively. This was mainly believed in that increasing the production and productivity of wheat depends on increased cropping intensity by using seed of improved wheat varieties, but it was found that instead of having small plot of land, farmers who have relatively large plot have been found that developed confidence to grow improved varieties, as they believed they can avert risks if at all happened through other alternative crops they grow to the extra plot they own. A farmer who has relatively large size of farm land will not hesitate to try new ways of doing agricultural activities. This will motivate ones innovativeness.
The result of the study revealed that as livestock size of a household increased by 1 unit, adoption of improved bread wheat varieties would be decreased by a factor of 0.517 and this implies that when the households’ livestock population of diversified animal increases, the households’ aspiration to access and utilize improved bread wheat varieties decreases. The possible reason may be that the district farmers are known for fattening and delivering of bulls and sheep to the nearest town Adet, besides shipping to the regions’ major town Bahir Dar. For this reason those who own large number of livestock found to be non adopters for improved bread wheat varieties as it requires intensive management (Table 5). The result was not inconformity with the previous hypothesis set forth. Those farmers who owned small number of tropical livestock unit had adopted improved bread wheat varieties at positively and significantly at (p<0.1). Conversely, Tesfaye et al. (2001) revealed the positive relationship of livestock holding and technology adoption in Yelma Dansa and Farta Districts of Northern Ethiopia. In addition, Birhanu (2002) indicated as livestock ownership increases adoption/intensity of adoption and correlate positively. Distance of household heads residence from all main roads was found to influence adoption decision of the household head positively and significantly at (p<0.1). This result was found to be in contrary to the hypothesis set earlier. One of the possible reasons may be due to those farmers residence near to all weather roads are involved in different income generating activities like fattening and petty trading, because they have an access to scan their environment for the current market to their bulls and proximity of their residence to easily freight their bulls to whole sellers or retailers shipment to urban and peri-urban areas.

Over all, of 120 sample respondents, only 35.83% (N=43) were found to be adopters of improved bread wheat varieties. Whereas 64.17% (N=77) of wheat growing farmers are not using improved variety which was released before two decades and became sus-ceptible to yellow rust and other foliar diseases.
CONCLUSION AND RECOMMENDATIONS
Agriculture is the main stay of Ethiopian economy and hence, improving productivity to assure food security, reduce poverty and in turn attain food self sufficiency; utilizing agricultural input plays a vital role. Among others, improved variety took the lions share. Even if more than 85% of the country’s population is engaged in agriculture, use of local varieties integrated with backward agronomic practices had put their figure print to produce low per unit area. To reverse the scenario, a lot of efforts have been made by the government. Accordingly, large numbers of improved bread wheat varieties have been released by national and/or regional research institutes in collaboration with international research centers, like CIMMYT, ICARDA, etc. But, the extension system to diffuse these varieties to the ultimate users is still lagging behind. In this regard, the study has explored the potential factors that affect the household decision to adopt or reject a given improved bread wheat variety in the study area. Strengthening the different types of participation in the social organization enhance adoption of improved bread wheat varieties like formation of Farmers Research and Extension Group (FREG) in each kebele and encouraging farmers to be membership in the FREG, even though all farmers cannot be elected in kebele administration, active participation in kebele meetings has paramount importance to scan what is going on currently in their environment. Beyond family labor, looking for additional laborer is crucial to apply the full package of the improved variety. Hence, an advice to improved wheat growers to hire labor is helpful in order to exploit the full potential of a given variety that might be lost due to lack of active man power.
Establishing and advocating different credit institutions at the community level have paramount importance to users of the improved varieties. In such a way that farmers will develop confidence to use improved bread wheat varieties as they can build confidence to purchase farm inputs to the amount as per the recommendation. Accessibility of input should get special attention. For this, collaboration will be demanding among actors in the sector, like BoA, research, seed enterprises (national and/or regional), private seed growers, seed unions, etc. Researchers, Regional, Zonal and District extension experts should organize field days at an appropriate time on the field to enable farmers attracted by the improved bread wheat varieties. This should not be one time activity; rather it should be performed every cropping season. It is crucial to utilize the experienced farmers to demonstrate for those who are youngster. Technology adoption is by far successful through informal knowledge exchange among farmers themselves, because it has the power to convince each other better than the interference of outsiders. Extensive farming cannot be practical for smallholder farmers. Hence, intensive farming using highly productive crops like bread wheat to maximize output per unit area should be advocated to farmers. Training should be delivered to farmers to improve their saving culture, to diversify their on farm income, to sale their crops at an appropriate time, etc which enable them having better capital to utilize it as the need arises. Because, improved bread wheat varieties require intensive management and this requires readily available money to purchase input and to manage the farm plots properly and timely as much as possible. Moreover, active age family group has to be focused for intensive management of improved bread wheat varieties. Due consideration should be given to those farmers who are living far from main roads for the timely availability of inputs , as they have been found eager to use improved bread wheat varieties.. In addition, technical advice should also be extended to diversify their source of income through fattening and/or sale of milk and milk products since they have better feed source than along the road side residents.
To sum up, institutional factors have been found overweighed than demographic and economic factors. Accordingly, improved bread wheat varieties cannot be diffused with one organization and/or institution alone. In order for the varieties to reached the final users, an integrated activity among different stakeholders is crucial. Regional, zonal and district agriculture and extension offices should deliver timely inputs to at most appropriate location. Farmer’s application of inorganic fertilizer below the recommended package was mainly due to poor research and extension linkage and also lack of financial capacity. Hence, establishment of financial institutions at Kebele level if not at district level, should be given due emphasis, besides strengthening extension service provision to enable farmers access the information and advice whenever they are in need. Participatory research through strengthening Farmers Research and Extension Group (FREG) to open the room for farmers which enable them to select varieties as per their preference criteria has to be given priority. Timely delivering the seed and inorganic fertilizer by itself cannot bring an expected output of a given variety, unless it is not coupled with frequent follow up from research and/or extension agents to enable them applying the correct package. The effort to get release disease resistant, early maturing and high yielding improved bread wheat varieties should be given special attention by national and/or regional research institutes. Construction of rural roads to enable remote farmer’s access to input, credit and market centers has to get priority. Moreover, great emphasis should be given to establish these centers nearby their locality to reduce their burden of long travel. The logit model was assessed for its goodness of fit by probing how well the model classifies the observed data. The result indicated that (the model chi-square value) the parameters indicated in the model taken together were significantly different from zero at less than 1 percent level of significance. The value of chi-square (×2 = 105.24) also indicated the goodness of fitted model. The chi-square goodness-of-fit test statistics of the model shows that the model fits the data with significance at 1% level. This shows that the independent variables are relevant in explaining the farmers’ decision to adopt improved bread wheat varieties.
The authors have not declared any conflict of interests.
REFERENCES
|
Abebaw S (2003). Dimensions and Determinants of Food Security among Rural Households in Eastern Ethiopia. A Master Thesis presented to the school of graduate studies of Alemaya University. 152 p.
|
|
|
|
Almaz G (2008). Adoption of Chickpea Technology Package in Add`a and Akaki Districts, Eastern shewa, Ethiopia. An M.Sc.Thesis, Haramaya University, Ethiopia.
|
|
|
|
|
Amemiya T (1981). Qualitative Response Models: A survey. J. Econ. Lit. 19:483-536
|
|
|
|
|
Bayissa G (2010). Adoption of Improved Sesame Varieties in Meisso District, West Hararghe Zone. An M.Sc.Thesis, Haramaya University, Ethiopia, 108p.
|
|
|
|
|
Birhanu B (2002). Analysis of Factors Affecting the Adoption of Cross-bred dairy Cows in Central High lands of Ethiopia. The Case of Degam and Girar Jarso Districts, North Shoa Zone, Ethiopia. An M.Sc.Thesis, Alemaya University, Ethiopia
|
|
|
|
|
Central Statistics Authority (CSA) (2013). The Federal Democratic Republic of Ethiopia Agriculture in Figures. Addis ababa.
|
|
|
|
|
Central Intelligence Agency (CIA) (2010). The Adoption of Agricultural Technologies. Mexico, D.F. CIMMYT.
|
|
|
|
|
Damodar NG (2003). Basic Econometrics, 4th edition, McGraw-Hill Higher Education, NewYork, 1002 p.
|
|
|
|
|
Degnet A, Belay K (2001). 'Factors influencing adoption of high yielding maize varieties in South West Ethiopia: An Application of Logit Analysis', Quarterly Journal of International Agriculture. 2:149-167.
|
|
|
|
|
Dereje H (2006). Assessment of Farmers' Evaluation Criteria and Adoption of Improved Bread Wheat Varieties in Akaki, Central Ethiopia. An M.Sc.Thesis, Haramaya University, Ethiopia.
|
|
|
|
|
Feder G, Just RE, Zilberman D (1985). "Adoption of agricultural innovations in developing countries: A Survey". Econ. Dev. Cult. Chang. 33:255-98.
Crossref
|
|
|
|
|
Green HW (1991). Economic Analysis. New York University, Macmillan Publishing Company, New York.783p.
|
|
|
|
|
Gujarati DN (1995). Basic Econometrics, 3rd Edition, McGraw-Hill, Inc, New York. 838p.
|
|
|
|
|
Healy PM (1985). The Effect of Bonus Schemes on Accounting Decisions. J. Account. Econ. 8(1-3):85-107.
Crossref
|
|
|
|
|
Kidane G (2001). Factors Influencing the Adoption of New Wheat and Maize Varieties in Tigray, Ethiopia: The Case of Hawzien District. An M.Sc, Alemaya University, Ethiopia, 140p.
|
|
|
|
|
Legesse D (1992). Analysis of Factors Influencing Adoption and the Impact of Wheat and Maize Technologies In Aris Nagele,Ethiopia. An M.Sc. Thesis, Alemaya University, Ethiopia, 119p.
|
|
|
|
|
Lelisa C (1998). Determinants of Adoption And Intensity and Prfitabilty of Fertilizer Use. The Case of Ejere District. An M. Sc. Thesis, Addis Ababa University, Ethiopia, 75 p.
|
|
|
|
|
Liao TF (1994). Interpreting Probability Models: Logit, Probit and other Generalized Models. Sage University Paper series on Quantitative Application in the Social Sciences, California, 87 p.
Crossref
|
|
|
|
|
Maddala GS (1983). Limited Dependent and Qualitative Variables in Econometrics. Cambridge University Press, Cambridge, MA 401p.
Crossref
|
|
|
|
|
Maddala GS (1992). Introduction to Econometrics. 2nd Edition. Macmillan Publishing Company, New York, 631 p.
|
|
|
|
|
Melaku G (2005). Adoption and Profitability of Kenyan Top Bar Hive Beekeeping Technology. Study in Ambasel District of Ethiopia. An M.Sc. Thesis, Haramaya University. Ethiopia.
|
|
|
|
|
Mesfin A (2005). Analysis of Factors Influencing Adoption of Triticale (X-Triticosecale Witmack) and Impact, the Case of Farta District. An M.Sc Thesis, Alemaya University, Ethiopia 112 p.
|
|
|
|
|
Ministry of Agriculture (MOA) (2011). Animal and Plant Health Regulatory Directorate Crop Variety Register. Addis Ababa.
|
|
|
|
|
Pindyck RS, Rubinfeld DL (1981). Econometric Models and Economic Forecasts. 2nd Edition, McGraw Hill Book Co. New York, 627 p.
|
|
|
|
|
Tesfaye Z, Girma T, Tanner D, Verkuijl H, Aklilu A, Mwangi W (2001). Adoption of Improved Bread Wheat Varieties and Inorganic Fertilizer by Small Scale Farmers in Yelma Dansa and Farta Districts of Northern Ethiopia. Mexico, D.F. Ethiopian Agricultural Research Organization (EARO) and International Maize and Wheat Improvement Center (CIMMYT), 42 p.
|
|
|
|
|
World Bank (WDB) (2013). Development indicators, URL,
View accessed on 10 July, 2014.
|
|
|
|
|
Yishak G (2005). Determinants of Adoption of Improved Maize Technology in Damot Gale District, Wolaita, Ethiopia. An M.Sc Thesis, Haremaya University, Ethiopia.
|
|