Most crop production in Ethiopia comes from the peasant sector, whose production technologies are primarily traditional (CSA, 2011). Production and productivity under such traditional systems, however, have been con-siderably low, due mainly to the inherently low produc-tivity of the crop varieties used, declines in soil fertility, and the effects of crop pests (Firdu and Tsedeke, 2007). But, contrary to this, much increase of crop production in the past decade has been observed due to increase in area cultivated in the country (Alemayehu et al., 2010); however, to what extent the area cultivated can continue to expand remains an important question. It seems that in the highland areas, expansion of cultivated area will have to come almost exclusively from reduction in pasture land.
According to neoclassical economic theory, the development of favorable marketing institutions, trade and specialization are crucial for successful agricultural business.
In line with this, Ethiopian government in recent years has engaged in the establishment of basic development infrastructure (roads, schools, farmer training centers, health centers, and so on) in the whole country empha-sizing rural parts, even though farmers are still weakly connected to factor and product markets both domestically and internationally. Only 30% of Ethiopian agricultural output is marketed (Bernard et al., 2006, as cited in Tesfalem, 2008). Better integrating such farmers into factor and product markets is part of the overall development endeavor.
Ethiopian economy has been largely based on agriculture for many past years and some years (5-10) in the future according to Growth and Transformation Plan (GTP) (MoFED, 2010). In transforming agriculture-based economy to one that is industry-based, the agricultural sector should be strengthened including the crop pro-duction sector. The country set strategy to increase crop production two-fold, as indicated in the GTP. In doing so, the driving force of the sector, the subsistence farmers, should be supported and accessed to development institutions which are fully equipped with facilities to serve the smallholders closely to enhance their productivity to attain the targets of GTP.
In order to improve crop production and productivity in the zone as well in the country, the rural service-providing institutions need to be strengthened and in line with this the status and situation of the institutions have to be known. Understanding the crop production and marketing constraints of the area is fundamental to improve the crop production and improve the smallholders’ livelihoods in general. Hence, the study was designed to characterize the crop production and marketing systems in the Arsi zone and to assess constraints of crop production and marketing systems in the zone.
Description of Arsi Zone
The survey was conducted in Arsi zone located in Oromia Regional State in the South Eastern part of Ethiopia in 2012. It shares boundaries with West Arsi, East Shewa, Bale and West Hararge Zones. Assela, the capital town of the zone, is located 175 km from Finfinne or Addis Ababa on the Finfinne-Adama-Bale Robe main road, 75 km south of Adama.
Arsi zone has four agro-climatic zones, differing mainly in altitude, whose great variation in temperature provides wide opportunities for the production of different types of crop. It is dominantly characterized by moderately cool (about 40%) followed by cool (about 34%) annual temperature. Cool/cold type of thermal zone is found in the highland areas of Chilalo, Bada, Gugu, and Enkolo and Kaka Mountains. The category of moderately warm temperature is found in the lowland areas of Gololcha, Amigna, Seru and Merti districts. It is also found in the Wabi Shabele river valleys and Awash Gorges according to the report of zone BoA and Natural Water Resource Development. The mean annual temperature of the zone is between 20 to 25°C in the lowlands and 10 to 15°C in the central highlands. However, there is a slight variation of temperature by months. February to May are the hottest months while October to January are the coldest months.
The main agricultural feature of the zone is a mixed farming system in which crop production and livestock husbandry complement each other. Crop residues mainly straw used as feed for livestock. On the other hand, the wastes from livestock used in form of compost for fertilizing the soil and livestock supply draught power during land preparation and threshing. The major food crops produced in the Arsi zone are cereals, pulses, oil seeds and others. Among cereals barley and wheat are the pre-dominant and among pulses horse beans and field peas are grown widely.
The zone has high potentialities for livestock rearing. Cattle, draught animals, small ruminants and poultry are the dominant livestock species, which contributing largely to the livelihoods of the community of the area (Messay et al., 2012). Local cattle are the pre-dominant breeds reared in the area; however, improved breeds are being substituted, due to reduced grazing and pasture lands. Improved breeds are productive than local once if properly managed. Keeping few improved breeds on smaller plots than many local breeds is being preferred by the smallholders because of reduction of grazing lands and pastures.
Sampling procedures
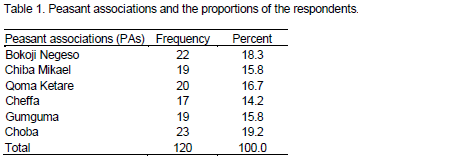
Multi-stage sampling techniques were employed for the data collection. Specifically, the study was conducted in Lemu-bilbilo and Munesa districts which were selected randomly at the first stage among 26 districts in Arsi zone. In the second stage, all accessible Peasant Associations (PAs) were listed and three PAs, namely Bokoji Negeso, Chiba Mikael, and Qoma Katare were also selected randomly from the accessible PAs in Lemu-bilbilo. Similarly Chefa, Gumguma and Choba were the PAs selected randomly among accessible PAs in Munesa district. From Munesa district, 14.2, 15.8 and 19.2% of the respondents were selected randomly from Chefa, Gumguma and Choba PAs respectively (Table 1). The number of the respondents involved in the study from each selected PAs was determined in accordance with population as shown in Table 1.
Data analysis
With respect to the expected output of the study, the quantitative data obtained were analyzed using descriptive statistics. Qualitative data collected during the study were used to interpret and conceptually generalize the findings and used to ensure the validity of the results from descriptive statistics. For quantitative data, descriptive statistics were employed, and all findings were combined to give meaningful picture and reliable information. SPSS software was used to analyze descriptive statistics. Means, percentages (shares), ranges, t-tests and χ2-tests were the main descriptive statistics used in the analysis of quantitative data collected through the formal survey.
Socio-economic characteristics
In the survey areas, the age of respondents (household heads) varied from 20 to 86; the duration of their farming experience and the time they had lived in the area varied from 1 to 63 years and from 10 to 75 years respectively. The overall means of age, farming experience and years lived in the area were 48, 23, and 43 years respectively. The mean ages of respondents in Lemubilbilo and Munesa were 46.33 and 49.80 years respectively. The respondents mean farming experiences in Lemubilbilo and Munesa were 24.87 and 30.67 years respectively, whereas the years lived in the areas by the respondents were 38.85 and 46.35 years respectively (Table 2).
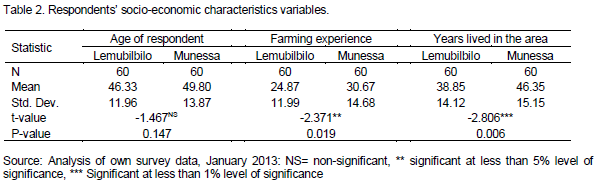
In regard to age, a t-test showed the absence of a sta-tistically significant difference between the respondents in the two districts. However, there is a statistically significant difference at the 5% probability level between the two districts with regard to years lived in the areas by the respondents, and another at the 1% probability level between their farming experiences.
Occupation
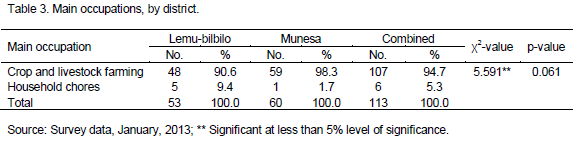
Crop and livestock farming is the main occupation for more than 89% of the respondents and household chores are also the main activities for about 5% respondents. The majority of farm households in the study districts practiced both crop production and livestock rearing as a mixed farming system. While crop production is practiced together with livestock husbandry, one supports the other in a variety of ways. Residues from crop production serve mainly as feed for the livestock, and the manure is used as crop fertilizer.
In addition to their main occupation, the respondents are practicing a range of activities in order to diversify their sources of income and enhance their livelihoods. Crop and livestock farming, salaried employment, self-employment on farms, casual work on other farms, off-farm casual work, herding and household chores were the secondary occupations of 5, 3.3, 6.7, 3.3, 2.5 and 5.8% of the respondents respectively.
Among 113 respondents involved in the study, crop and livestock farming and household chores were the main occupations for more than 94 and 5% of them respectively (Table 3). Crop and livestock farming was the main occupation for 90.6 and 98.3% of the respondents in Lemubilbilo and Munesa districts respectively (Table 3). The chi-square test shows the presence of significant mean differences between the two districts in referring to the respondents’ main occupation statistically.
Walling and roofing materials of main resident house
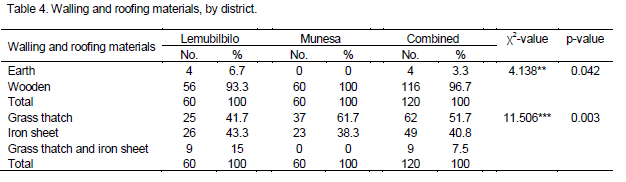
The walling and roofing materials of the main resident house indicate the living standards of the household. The house of wealthy households is constructed by bricks, stone and iron sheet where as small grass thatched and wooden (timber) mud plastered house belongs to the resource poor households. Wooden mud plastered and earth were the main walling materials of main resident house in rural areas in the past years; however, significant changes are in place currently. Similarly, grass thatching was the common roofing material in many rural parts of Ethiopia.
Wood plastered with mud is main walling material of the main resident house for more than 96% in the study districts. Similarly, for 52 and 41% of respondents, grass thatch and iron sheet are the roofing materials of the main resident houses of the respondents. The result of a chi-square test shows that there is a statistically significant mean difference between the two districts with regard to the walling materials used to construct the main resident house in the areas by the respondents at the 5% probability level and between the roofing materials at the 1% probability level (Table 4). Furthermore, the result indicates the variation in living standards among rural households in Arsi zone.
Land holding
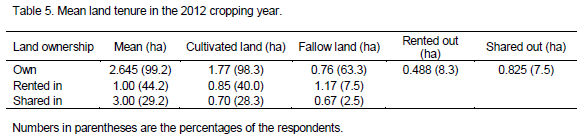
Farmers in the study areas owned land for farming, even though they also accessed land through renting and sharing with other farmers in addition to their own when there is a periodic shortage. Older and resource poor farmers rent out land to youth and wealthier farmers. More than 99% of the respondent farmers owned 2.645 ha on average, varying from 0.25 to 9.25 ha. About 98 and 63% of the respondents allocate 1.77 and 0.76 ha of their own land for cultivation and fallow respectively on average. Among the respondents who used their own land for fallowing, 63 and 37% were Lemubilbilo and Munesa farmers respectively. Fallowing is practised mainly to restore soil fertility and to reduce the incidence of grass weeds, and in the fallowing year the land is used for grazing.
In case of land shortage and based on their capability (finance to cover production cost and oxen ownership), farmers in the study areas accessed land through renting in and sharing in. In contrary to this, due to financial problem and lack of oxen for ploughing, some farmers rented out (0.488ha) and shared out (0.825 ha) some of their land (Table 5).
Land allocation
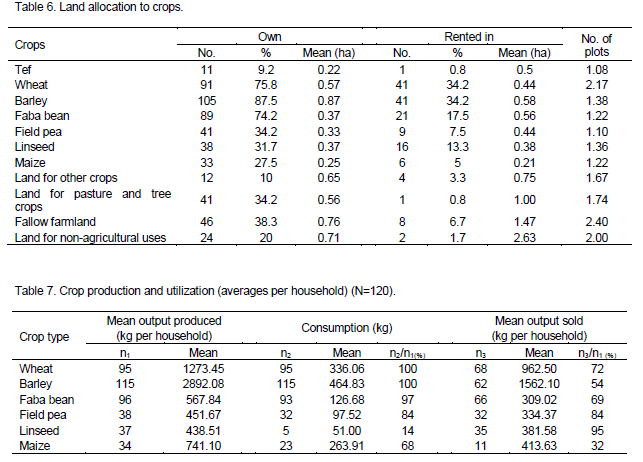
Barley, wheat, faba bean and field pea are the major crops, grown by 87.5, 75.8, 74.2, and 34.2% of the respondents, who allocate 0.87, 0.57, 0.37 and 0.33 ha of own land to the crops respectively. Farmers rent in land to cultivate crops besides their own land and farmers more than 34% rent in land to wheat and barley among the respondents included in the study. In the study area, more than 87% of the respondent farmers allocate more own land to barley production than other crops (Table 6). However, more land is allocated for crop production, farmers use land for pasture, fallowing and non-agri-cultural uses in the study area. On average, farmers of the area allocate more than one plot for specific crop or grow a specific crop on different plots located at different places, which indicates a high level of land fragmentation.
Crop production trends
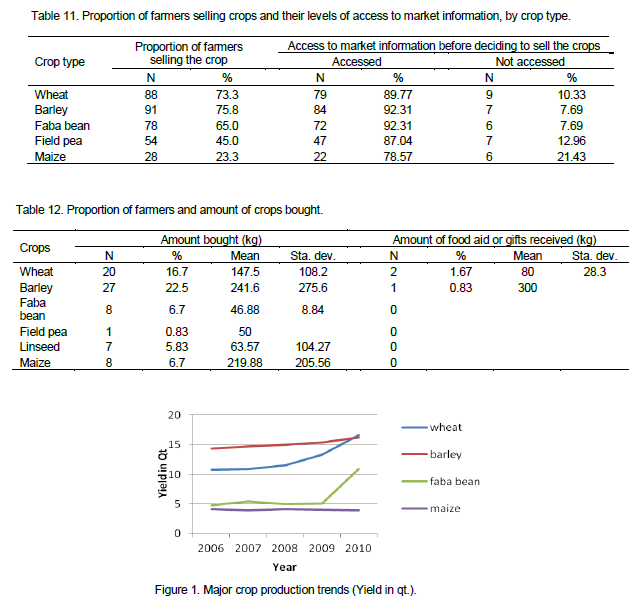
As indicated in the figure, farmers obtain the highest yields from barley; wheat is the next important crop, which gave better yield and competing with barley until 2009. Next to barley and wheat, faba bean is an important cash crop that shows a yield increase from 5 to about 10qt1 since 2009. Farmers in the study areas produced crops primarily for family consumption and sale to earn cash to cover family expenditure. In general, farmers have obtained higher yields from the major crops in recent five years since 2009 (Figure 1) due to the utilization of improved agricultural technologies according to explanations of the respondents. Due to land scarcity among the farmers, specifically young ones, previously grazing, pasture and forest lands have entered into crop cultivation in recent years. Farmers started farming on hill sides and even on mountain tops in the Arsi zone as well in other parts of the country. Although this has increased production, it will have a high impact on the environment.
Crop production and utilization (averages per household)
Barley and wheat are the dominant food crops produced
and utilized by a large number of farmers for consumption and sales (Table 7). Households of the study area used significant amounts of produced crops for seed, and for in-kind payment for land and labor.
As also reported by Alemayehu et al. (2010), farmers use crops produced mainly for both family consumption and marketing. For different crops, the amounts sold and consumed varies across households, and depend on family size, quantity produced, crop type and market demand. For instance, among 37 farmers who produced linseed, only 5 (14%) farmers used it for consumption, and about 35 (94.5%) used the crop for marketing; more than 87% of the linseed produced was sold (Table 7).
If the produced crops are not sufficient, households cope mainly through purchases and food aid or gifts received. Only about 17, 23, 7 and 7% of the respon-dents bought wheat, barley, faba bean and maize in 2010 to cope with the crop shortage of that year. An insignificant number of the respondents received wheat and barley by food aids/gifts (Table 11).
Marketing of crops
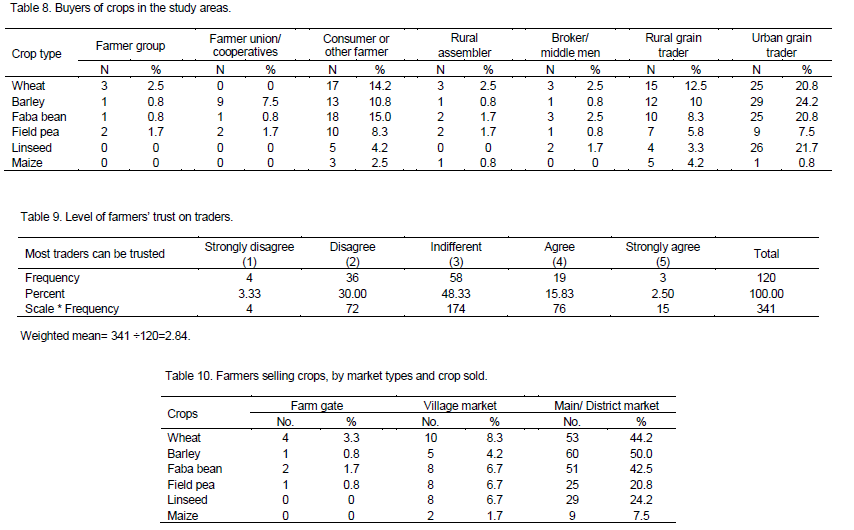
The demand and supply of agricultural produce varies from time to time, leading to fluctuations of price over time. Nowadays, the participation of many actors makes agricultural marketing complex than in previous periods, when market actors and intermediaries were fewer. The increase of market actors and intermediaries could be interlinked with the increasing population and the benefits fetched from grain trading. The farmers sell their crops to different buyers such as farmer groups, farmers’ unions, rural assemblers, brokers and rural grain traders; the potential buyers of the crops are urban grain traders and consumers, and other farmers in the study areas (Table 8). Urban grain traders and consumers were the potential market actors purchased wheat from more than 20 and 14% respondent farmers respectively. Similarly, more than 24 and 10% of farmers sold barley for urban grain traders and consumers respectively as depicted in Table 8.
Farmers’ trust in traders
Respondent farmers replied differently to the trust statement provided, as shown in Table 9. In order to improve the smallholder farmers living conditions, market actors like traders should buy the product of farmers at a reasonable price at least compensating their costs of production. On the other hand, market crop price could vary overtime and the farmers’ access to the correct mar-ket information varies among market actors. The correct market price that traders pay to the farmers’ product and the return they fetch from it indicates the levels of farmers’ trust in traders. Accordingly, farmers indicated their level of trust in traders according to the statement says “most traders can be trusted”. Out of 120 respon-dents, more than 48% were indifferent or farmers were in between to trust or not to trust, 30% disagreed and about 16% agreed with the statement (Table 9). The Likert scale result was 2.84 which is near to 3 (in-different), which indicates the level of farmers trust on traders.
In crop marketing, where the farmers sell the crop or market type is another important determinant that facilitate agricultural marketing. For farmers, selling crop grain at farm gates and village markets reduces ups and downs of travelling far distances and saves much time to accomplish other agricultural or development tasks if just and fair prices are paid. Farmers in the study area sold their crop produce at farm gate, village market and the main district market (Table 10). Main or district market is the place where many farmers sold the crops in the study area. Some farmers sold crops at village markets, and few of them did so at farm gates (Table 9) to rural grain traders or to other village farmers who took the grains to the district market or to secondary markets. Bokoji is the main or district market of Lemubilbilo, and Kersa is the main market of Munesa district. Among 120 respondent farmers, 44.2, 50.0, 42.5, 20.8 and 24.2% sold wheat, barley, faba bean, field pea and linseed respectively at their respective district markets, as depicted in Table 9.
With regard to market type, it is crucial to consider the distance to the nearest village and main markets. Among the respondents, there were farmers who are 12 km from their nearest village market; the average distance was 4.81 km. Similarly, farmers in the study areas on average could travel 6.87 km to reach the main respective district markets which could consume more than one hour in average for a single trip (Table 12). The study result also shows the presence of farmers who travelled up to 24 km (needs 3 h) to arrive at the district main market.
To evaluate the living standards of a society in a given area, considering modes of transport is important. Farmers transport the crops to the village markets or district markets mainly by donkey; however, some farmers used oxen/ horse carts. About 53, 50 and 46% of the respondents used donkey to transport barley, wheat, and faba bean respectively to the markets.
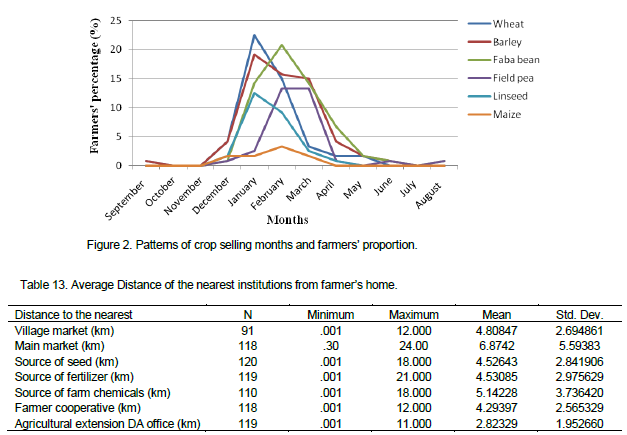
In crop marketing, understanding the farmers’ crop selling period or months is also an indispensable factor like market type, market actors, transport mode and market distance. Farmers’ crop selling period could be influenced by a variety of factors such as personal, social, economic and cultural ones. As indicated in Figure 2, higher percentages of farmers sold the crop commo-dities between November and May. January, February and March were the peak crop selling months in the study areas during the survey year in 2012. November and December are harvesting months in study areas. However, the crop selling months vary from year to year and from farmer to farmer depending on the level of production and crop prices in the market; generally many farmers sell major proportion of crops from December to May (Figure 2).
Access to market information and means of access to market information before deciding to sell their crop commodities helps the farmers to make decisions whether to sell or not, and to sell at a fair market price. Among the 120 farmers in this study, 73.3, 75.8, 65, 45 and 23.3% sold wheat, barley, faba bean, field pea and maize respectively in the survey year. Out of the respondents who sold these crops, some were unable to access market information before deciding to sell their crops (Table 11).
Some days before selling, observation of the market and discussion with other village farmers and relatives were the major means of accessing to market information for the farmers in the study area. According to the farmers’ explanation, some farmers also have access to market information through telephone discussion with traders and farmers of in other areas. Cell phones are playing a great role in accessing market information. Food security and coping mechanisms.
Crop production of Arsi zone mainly comes from the traditional farming system based on animal power and rain-fed peasant sector; a limited amount comes from state farms. The peasant sector accounted for about 96.45% of the total cultivated land in the Zone, and 96.2% of the total crop pro-duction. The zone is considered as food self-sufficient zone. However, there are households having food insecurity problems, whose severity varies from year to year depending on rainfall, and from district to district, because all districts are not equally vulnerable to drought.
Among the 120 farm households included in the study, only a few faced a shortage of food crops for consumption in 2011.Wheat and barley sustained the livelihoods of millions of people residence in highlands of the study areas. These crops were the main food crops consumed almost daily in different forms such as injera, bread, ganfo and kinche. Farmers in the study area utilize their crops both for consumption and marketing. About 16.7 and 22.5% of the respondent farmers bought wheat and barley respectively in 2011 due to the shortage of the crops (Table 12). Faba bean, field pea, linseed and maize were the crops cultivated by a few farmers on smaller plots in the study area as indicated in Table 7 above. These crops were consumed proportionately in smaller quantities compared to wheat and barley, and the majority of the farmers used these crops for marketing. Among the sampled farmers, only a few of them bought faba bean, field pea, linseed and maize to overcome their shortage (Table 12). Even though the quantities of food aid/gifts from government and non-government bodies are unknown, an insignificant number of households received wheat and barley as food aid or gifts from relatives, neighbors or friends.
As indicated in many reports, ‘food security is defined as physical and economic access by all people at all times to sufficient food to meet their dietary requirements for a reproductive and healthy life’. By this definition, even though some households in the study area faced a food shortage in some periods of the year, they may not have been food-insecure, because adequate food crops were available and they could access to these food crops.
Households of the study area used different means to cope when a food crop shortage exists. These coping mechanisms are adopted depending on how bad the crisis is, and what is available to them to manage the situation. According to the explanations of some key informants, farm households used livestock sales (specifically small ruminants), certain types of off farm employment, requesting grain loans, sales of fire wood or charcoal, reduction of crops to be marketed and reduction of consumption were some of the coping mechanisms exercised by households in the study area.
Availability of supportive institutions in the farmers’ area
Gebremedhin et al. (2009) showed that the expansion of the agricultural services particularly extension had a sig-nificant impact on the intensity of input use, agricultural productivity and market participation of Ethiopian small-holders. The availability of service-providing institutions at a near distance is desirable for the farmers in order to access agricultural technologies and information. Not only availability of these institutions but also their level in facility and capacity to support farmers in the provision of required services is crucial. Even though there are farmers who are far from supportive institutions, the dis-tances seem acceptable (Table 13). The improvements observed in the availability of supportive institutions in the farmers’ area attained by the focuses given to farmers and the efforts made by the government in recent years. For instance, on average, farmers are 2.82km distant from an agricultural extension (Development Agents) office. Sources of seed, fertilizer and farm chemicals, and farmer cooperatives, are situated on average at distances of 4.53, 4.53, 5.14 and 4.30 km respectively (Table 13).
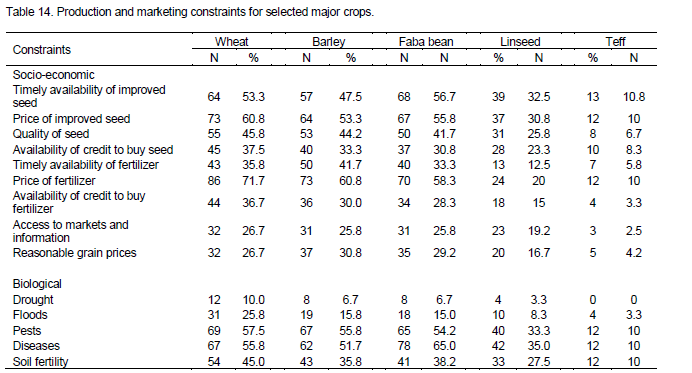
Crop production and marketing constraints
Farmers in the study areas are confronted with a variety of crop production and marketing challenges and difficulties as indicated in Table 14. Mesay and Tolosa (2011) reported rather similar wheat production con-straints. The price of fertilizer and of improved seed and the and the timely availability and quality of improved seed, were the main socio-economic problems reported by 71.7, 60.8, 53.3 and 45.8% of the respondent farmers respectively in wheat pro-duction. Pests and diseases, as biological/ natural wheat production constraints, were indicated by 57.5% and 55.8 farmers respectively. With regard to barley the price of fertilizer, price of improved and timely availability of improved seed were the principal socio-economic challenges reported by 60.8, 53.3 and 47.5% of farmers respectively while pests and diseases are the major biological constraints of barley, as reported by 55.8 and 51.7% of the respondents. Based on the study results, the price of fertilizer and improved seed, timely availability of improved seed and fertilizer, availability of credit to buy fertilizer and seed and access to market and agricultural information are the socio-economic crop production constraints of the farmers in the study area (Table 13). Further, pests, diseases, soil fertility and floods are important biological crop production constraints in the areas.