Full Length Research Paper
ABSTRACT
Household dietary diversity (HDD) is an important nutrition outcome measuring the economic ability of a household to access a variety of foods during a determined period. This paper examines the determinants of HDD among wheat dominated rural households of Sinana District, Oromia Regional State. Multi stage sampling procedure was used to select 384 sample households. Data were collected using structured survey questionnaire, focus group discussions, and key informant interviews. Zero-truncated Poisson regression model was used to measure the determinants of HDD. The results show that almost all the respondents consumed food made from cereal and only 20.05, 10.16 and 7.29% of the household consumed egg, meat and fruits in previous seven days, respectively. On average household consumed 5.73 food groups. Further, the finding indicates that about 13.54, 50.52 and 35.94% of the participants were consumed low, medium and high dietary diversity level, respectively. Marital status, education level, participating in irrigation farming, membership of farmers cooperatives, farm size and Total Livestock Unit (TLU) positively affected HDD while distance to nearest market and remittances negatively influenced HDD. Therefore, stakeholders in the agricultural sector should promote and encourage crop diversification strategies, expand access to irrigation, introduce agricultural technologies to boost income of rural households and thus diversify their diet.
Key words: Dietary diversity, determinants, rural households, Poisson regression.
INTRODUCTION
Household Dietary Diversity Score (HDDS) is a qualitative methodology that has been validated in different countries as an approximate measure of food availability and food accessibility aspects of food security (Cordero-Ahiman et al., 2017). It assesses the number of different food groups consumed in the household during a defined reference period, such as the last 24 or 48 h or the last 7 or 14 days (Koppmair et al., 2016; Cordero-Ahiman et al., 2017). Thus, a diversified diet is linked to the economic ability of a household to access a variety of foods by obtaining a number of different food groups consumed during a determined period. In other words, increase in dietary diversity is associated with socio-economic status and household food security.
There is a positive association between higher diet diversity and reduced prevalence of stunting and underweight among children under five, and a positive association between diet diversity and mean micronutrient adequacy for women and children (UNICEF, 2009; Becquey et al., 2010). Moreover, nutritional needs are more likely to be met where diverse diets are the norm, as a diverse diet is more likely to include the variety of nutrient dense foods required for good health than a monotonous one. Two studies of Ruel (2003) and Ruel et al. (2013) noted that Diet Diversity Scores are important indicators of diet quality and nutritional status in developing countries.
Lack of dietary diversity is a challenge for rural communities in developing countries. Their diets are mainly starchy staples with inadequate animal products, fresh fruits and vegetables (Degye et al., 2013). As discussed by Kalkuhl et al. (2013), adequate supply of all nutrients is of paramount importance to satisfy the nutritional requirements of human beings for body maintenance, growth, strength, physical work, cognitive ability, immunity and good health. World Health Organization (2010) also notes that during early life, the growth and development of the body as well as its maintenance are dependent on correct supply of all essential nutrients. In later life or during maturity, when development and growth are complete, the body requires food mainly for the aim of labor, body maintenance and repair. Nutrients are contained in foodstuffs in different contexts, structures and levels that form the organizational and functional components of edible plants (Von Braun and Tadesse, 2012). The findings of Ghandilyan et al. (2006) indicate that there is always a marked variability in the concentration of nutrients and biologically active ingredients in foodstuffs of plant origin. This indicates that only a mixed supply at recommended level can satisfy the nutrient requirements of all age and gender groups of human beings.
According to FAO (2010), hunger continues to be a dramatic problem in developing countries and that the progress towards the achievement of this goal is slow, with nearly 1 billion hungry people. The document clearly notes that many have access to the minimum number of calories, but are deficient in one or more micronutrients. Adding to this Jones et al. (2014) note households in developing countries are often limited to one or two starchy stable foods and may be especially lacking in micronutrient-rich fruits, vegetables and animal-source foods and hence, it is necessary to have more diversified food basket to ensure balanced diets so as to enhance nutrition. Cognizant to this, Alderman et al. (2006) show imbalanced diets resulting from consumption of mainly high carbohydrate based-diets also contribute to productivity losses and reduced educational attainment and income. Consequently, low dietary diversity is the most critical for nutritional security problem (Horton and Ross, 2003) as most diets are often deficient in essential vitamins and minerals.
Household food insecurity, hunger and undernutrition remain critical issues; the poor nutritional status of smallholder farmers has been a consistent problem in Ethiopia (CSA, 2011). Lack of dietary diversity and micronutrient-dense food consumption, and child feeding practices contribute to the high rates of child undernutrition. This and related factors leave children to low birth weight, short stature, lower resistance to infections, and higher risk of disease and death (Kalle et al., 2015). In the study area, most rural households consume mainly staples (Bealu et al., 2017), which are high in carbohydrates, but low in nutrients and vitamins. The consumption of micronutrient rich foods by smallholder farmer is insufficient. Traditional bread is the most common food item (Annet, 2015). However, cereal based diets are recognized as monotonous, lacking essential micronutrients and contributing to malnutrition and micronutrient deficiencies, especially in children, who need energy and nutrient-dense food to grow and develop both physically and mentally (Vakili et al., 2013). This paper addresses a research question: What are the main determinants of household dietary diversity (HDD) among wheat dominated rural households in Sinana District of Oromia region? The rest of the paper proceeds as follows. Section two explains study site, descriptions of the nature of data, measurement of variables and analytical methods are explained. Section three presents result and discussion. Descriptive statistics is first provided followed by results of rigorous econometric results with detailed discussion. The last section summarizes the paper.
MATERIALS AND METHODS
Description of the study
The study area, Sinana District, is located in Bale zone about 412 km southwest of Addis Ababa, the capital city of Ethiopia. Sinana is located between 6° 55’ 00’’ to 7° 18’ 00 N longitude and 39° 53’ 00’’ to 40° 26’ 00’’ East latitude. The total area of the District is about 1168km2.The administrative center of the District is Robe town and District has 22 rural Kebeles. The total population of the District is 164,124 of which 86,324 are males and 77,800 are females (CSA, 2015). Agriculture is the main source of livelihoods in Sinana District. The type of agriculture within the community includes animal rearing and production of different crops such as wheat, barely, maize, bean, field pea, potato, teff. “Wheat” is the dominant crop and stable food of the community.
Data collection
Both primary and secondary data of quantitative and qualitative nature were used for this study. Primary data were collected using household survey. Data on household dietary diversity were collected using a dietary diversity questionnaire developed by FAO. Respondents were visited at their homes during the survey and women/caregivers or people responsible for food preparation responded to the questionnaire. In addition, Focus Group Discussions (FGDs) and key informant interviews were used to generate qualitative nature of primary data. Secondary information from published and unpublished documents and reports from relevant organization were gathered and incorporated with the primary data.
According to FAO’s guidelines for assessing household dietary diversity, the population of interest should be chosen prior to the start of the data collection. Even though there is no international consensus on which food groups to include in the scores (FAO, 2010), the DDS denotes 12 food groups in which the following are considered in this study: Cereals; White tuber and roots; Vegetables; Fruits; Meat; Eggs; Fish; Legumes, nuts and seeds; Milk and milk products; Oils/fats; Sweets; Spices, condiments and beverages. The respondents were asked to recall all foods eaten and beverages taken in the previous seven days prior to the interview. A single point was given to each of the food groups consumed over the reference period giving a maximum sum total dietary diversity score of 12 points for each household, in which lowest DDS value signifies higher food insecurity status and vice versa.
Population and sampling technique
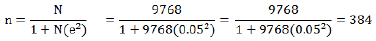
A community based cross sectional study was conducted in Sinana District. The District has about 34193 households. The population of the study included 9768 wheat producing household heads in the District. Multi-stage sampling procedure was used in the selection of representative samples. In the first stage, Sinana District was purposively selected from ten Districts of Bale zone due to dominance of wheat production. In the second stage, six kebeles were selected based on simple random sampling method. Finally, sample households who participated in the study among the six kebeles were selected based on simple random sampling technique. The number of sampled households was determined following Yamane (1967).
Data analysis
STATA 14.2 was used to analyze the overall statistical data. Both descriptive and econometric analysis was employed to examine status and determinants of household dietary diversity experience of rural households.
Specification of zero-truncated Poisson regression model
Dietary Diversity (DD) has always been modeled in the literature with either Dietary Diversity Score (DDS), which represents count data, or Dietary Diversity Index (DDI) that represents indices. For instance, Woldehanna and Behrman (2013) and Ecker et al. (2013) employed DDS, while Drescher et al. (2007) and Gaiha et al. (2012) utilized DDI in their respective studies. The current study used zero-truncated Poisson regression model to analyze determinants of dietary diversity. Following Rashid et al. (2011) we made use of zero-truncated Poisson regression model to estimate DDS as the dependent variable. In this regard, we assume DDS is random and, in a given time interval, has a Poisson distribution with probability density defined as:

Where DDS is the realized value of a random variable with mean and variance  and
and  respectively. is assumed to be strictly positive (y > 0). According to Cameron and Trivedi (2013), this is a case of truncation from below that is taken into account when specifying a zero-truncated Poisson model.
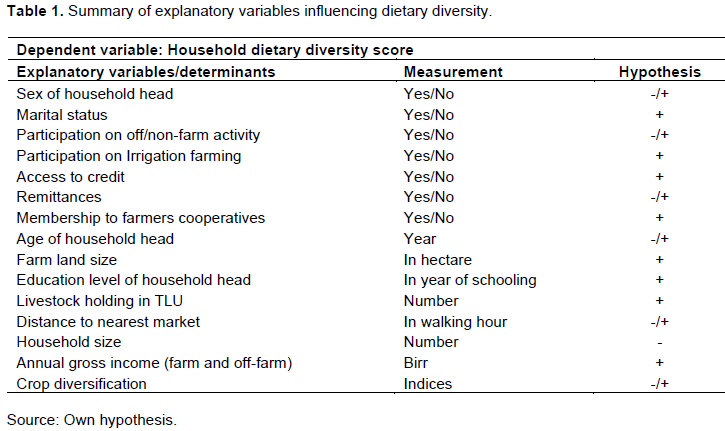
To incorporate the set of explanatory variables x and Y (Table 1) stated in into Equation 1, and to ensure a non-negative mean y, the parameter λ is specified as:

The implicit assumption in the Poisson model is that the variance is equal to its mean or the data are equally dispersed. Any violation of this assumption has consequence similar to the failure of the assumption of homoscedasticity in the linear regression model (Cameron and Trivedi, 2013). As a second analytical model, we also used ordered probit model. However, the result of this model is reported as Annex Table 1 as the result is not fundamentally different from Poisson regression model; some of those variables that were statistically significant with the former model turned out to be insignificant with probit model. Such use of multiple measures allowed us to assess the robustness of the estimates and their consistency.
Operational definitions
Household: Refers to all persons living under the same roof who share meals.
Household dietary diversity: Refers to the number of food groups consumed by household members over a previous seven days of the survey.
Low household dietary diversity score: When households consumed less than or equal to three
food groups in the previous seven days of the survey.
Medium household dietary diversity score: When households consumed four to six food groups in previous seven days of the survey.
High household dietary diversity score: When households consumed seven or more food groups in the previous seven days of the survey (FAO, 2011).
RESULTS AND DISCUSSION
Household characteristics
The sample respondents composed of both male and female household heads. The majority of households in the sample are headed by males. Out of 384 sampled household heads, female and male household heads take 11.75 and 88.25% respectively. The finding also indicates that out of the total household about 96.87% were married. The result revealed that the average age of the sampled household heads was 44.33 years while the average family size of the sample respondents was 7.06 with the minimum and maximum size of 2 and 14, respectively. The survey result shows that about 82.77 percent of household-head were uneducated. The remaining 17.23% attend educational level of different grade levels (primary school, 15.44 percent; secondary school, 1.57 and university or college level, 0.52%).
Approximately, only 12.50 percent of households received credit and only 7.81 percent of households have access to irrigation farm. The average total farm income of sample respondents was 2350.2 birr with the minimum and maximum size of 0 and 17,800 birr. The average household farm land size of sample respondents was 2.99. The average livestock holdings of sample respondents were 7.48 in TLU.
Household dietary diversity
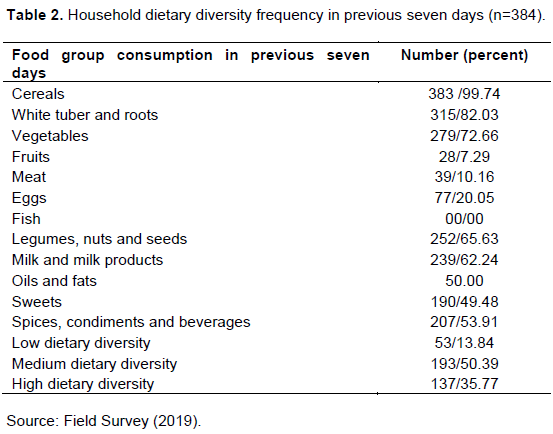
Almost all (99.74%) of the respondents consumed food made from cereal food groups and about 82.03% of household consumed food made from white tuber and roots such as potatoes. Consumption of milk and milk products shows that more than fifty percent (62.24%) of households consumed milk and milk products in the previous seven days. On the other hand, only 10.16 and 20.05% of the household consumed meat and egg in previous seven days respectively. Further, very few (7.29%) households consumed fruits in the previous seven days in the study area.
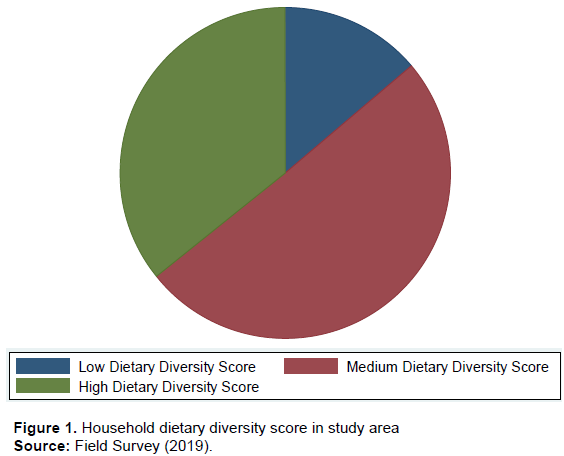
The finding on the DDS further shows that respondents were found to have consumed an average of 5.73 food groups with a standard deviation of 1.97. Moreover, the minimum DDS value is 2 and the maximum DDS value is 11. The summary of the DDS in study area is presented in Table 2. Further, the finding indicates that about 13.54% of the participants consumed less dietary diversity. Those who have medium level of DD account for 50.52%, and about 35.94% of the respondents have DDS ≥ 8 that they were food secure and were able to acquire and consume a variety of foods. However, it should be noted that the DDS value could be reduced if sugars and beverages are to be taken out, because they do not add to the nutritional quality of the diet (Faber et al., 2009).
During one of the focus group discussions organized with women farmers, the participants reported that they were unable to diversify their diet. Some of the reasons mentioned by farmers for low dietary diversity were (i) low crop varieties in home, (ii) remoteness of market, (ii) lack of transportation facilities, and (vi) lack of money to purchase different food items in the study area. The discussion also revealed that the participants would improve their dietary diversity if they had off-farm income sources and had easy market access for exchanging foods. A similar study of rural households in South Gonder Zone, Amhara Regional state, Ethiopia showed that 21.1% of the households reported a low-level dietary diversity, 62.7% of the households reported a medium-level dietary diversity, and 16.2% households reported high-level dietary diversity (Nega et al., 2015). The difference might be due to variations like geographical location, seasonal variability, and other socio- demographic factors (Figure 1).
Determinants of household dietary diversity
Table 3 presents the determinants of HDD. The finding shows, marital status positively and highly significantly affected HDD (p<0.000). The Poisson regression coefficient estimates indicates that, holding other variables constant in the model, being married increased HDD by 0.197 compared to unmarried. The finding is similar with Liu et al. (2014) indicating married people tend to consume a greater variety of food, perhaps because responsibility for other family members leads to a wider variety of dietary items in the household.
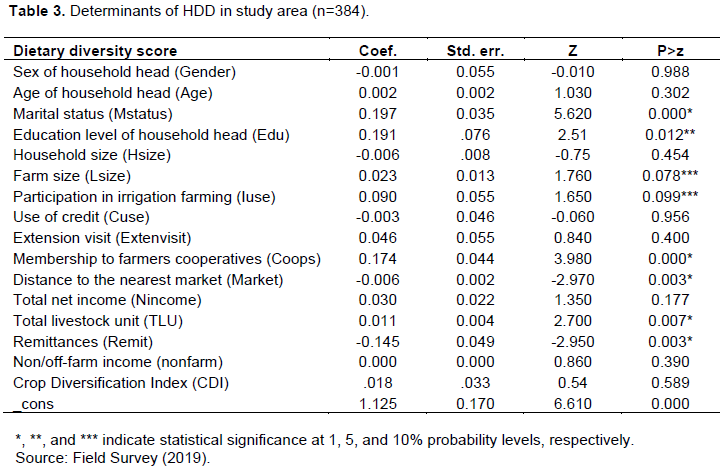
The estimation of Poisson model indicated that education level of household head positively and significantly affected HDD. Holding other variables in the model constant, HDD is expected to be 0.191 unit higher for literate household head compared to illiterate. This is due to the fact that the education of the household head can be taken as a proxy for consumer dietary knowledge and ability to process dietary information which has a significant positive relationship with the household dietary diversity. Comparable findings from other studies noted that educated household heads have higher dietary diversity than uneducated, because of a better understanding of their health benefits (Taruvinga et al., 2013; Woldehanna and Behrman 2013; Workicho et al., 2016; Melaku et al., 2019). The result is also consistent with studies in other contexts (Gitagia et al., 2019) who reported women’s education level positively affected dietary diversity in low agricultural potential areas.
The result of the Poisson regression model analysis shows that land size has positive and significantly relation with HDD at less than ten percent significance level. Land is an important factor for diet diversity and households holding larger areas of agricultural land had higher dietary diversity. Most of the households in study area derived more than 90% of their incomes from agriculture, thus land is important for food production and dietary diversity. The Poisson regression estimate indicates that, given the other variables are held constant in the model, as household land holding increases by one-hectare HDD would be expected to increase by 0.023 unit. Related study by Ochieng et al. (2017) in Tanzania indicates that land is a highly contributing factor for household dietary diversity and households owning larger areas of agricultural land had higher dietary diversity.
Model results indicate a positive association between participating in an irrigation farming and dietary diversity. Moreover, irrigation positively and significantly affected HDD at less than ten percent significance level. These findings suggest that households who participate in irrigation have a higher likelihood of attaining a high dietary diversity. The implication is that irrigation provides an opportunity for participants to grow a variety of cash and domestic horticultural crops which may directly improve their household food groups. Indirectly, cash crops from irrigation can also improve households’ food purchasing power. The finding indicates that holding the other variables constant in the model, participation in irrigation farming increased household dietary diversity by 0.090 points. Similar comparable findings were suggested by Taruvinga et al. (2013) indicating households who participate in irrigation have a higher likelihood of attaining a high dietary diversity.
Regarding membership to farmers cooperatives the finding indicates that membership to a farmer’s cooperatives had positive relation with HDD. The Poisson regression estimate revealed that, given the other variables are held constant in the model, membership to farmers’ cooperatives increased HDD by 0.174 unit. This finding is supported by Gebremedhin et al. (2017), who examined the association of cooperative and food security in northern Ethiopia. Their finding indicates that study households with cooperative membership were food-secure, while households without cooperative membership were food-insecure. Similarly, Wossen et al. (2017) studied the effects of access to extension services and membership to cooperatives on household welfare in rural Nigeria. Their finding revealed that extension access and cooperative membership had a positive relationship with household food security.
As it was hypothesized, the model result indicates that the variable distance to market negatively and significantly affected HDD at less than one percent significance level. This negative relationship indicates that the households who lived further away from the market are less likely to consume varieties of food. The possible justification could be that the household who are closer to the market centers incur fewer costs to access market incentive for market output for home consumption. Therefore, a long distance to the nearest market reduces the probability of household consumptions if the household will rely on market for their livelihoods. The Poisson regression estimate for a distance to the nearest market indicates that, given the other variables are held constant in the model, as distance to nearest market increase by one-kilometer HDD score would be expected to decrease by 0.006 unit. This agrees with (Motuma et al. 2019) who reported strong link between remoteness from markets and HDD. Better market access through reduced distance could contribute to higher dietary diversity (Sibhatu et al., 2015; Hirvonen and Hoddinott, 2017)
The model result reveals that, TLU is significant at less than ten percent probability level and positively affected HDD in study area. Holding other variables in the model constant, the likelihood of HDD increases by 0.011 unit for households with more livestock number in TLU. The positive relationship is explained by the fact that livestock size being a proxy for farmers resource endowment, those sample respondents with large livestock size have better chance to earn more income and also consume different livestock outputs. The significances of TLU on dietary diversity could be from a direct consumption of what they own or through increased purchasing ability of the households as they generate income from owning livestock. This finding is similar with Taruvinga et al. (2013) and Belachew et al. (2013) indicating that livestock are sources for several food groups (eggs, meat, and goat milk) that may provide micro and macronutrients and largely contribute to household nutrition.
In contrast to what we were expecting remittance is significantly and negatively related with HDD at less than one percent significance level. The Poisson regression estimate indicates that for a one-birr increase in remittance, given the other variables are held constant in the model, HDD would be expected to decrease by 0.145 unit. One convincing explanation for this finding could be because the remitted households may not use financial resources obtained to purchase nutrient dense foods that diversify household diets. Further, remitted household may use obtained income to purchase agricultural input and other services.
CONCLUSION AND RECOMMENDATIONS
Household food insecurity, hunger and under nutrition remain critical issues; the poor nutritional status of smallholder farmers has been a consistent problem in Ethiopia. The study demonstrated that the diet of all of the households was composed cereals, white tuber and roots, vegetables, legumes, nuts and seeds, and spices, condiments and beverages. Consumption of milk and milk products show that more than fifty percent (62.24%) of households consumed milk and milk products in the previous seven days. On the other hand, other animal source foods (meat and egg) were a rare component in the household’s diets. The results of the finding on the DDS showed that respondents have consumed an average 5.73 food groups. Further, based on FAO (2013) categorization about 13.54, 50.52 and 35.94% of the respondents was found to consume low, medium and high level of DD. Analysis of zero-truncated Poisson regression model also indicates that marital status, education levels of household head, farm land size, participation on irrigation farming, membership to farmers cooperatives and TLU positively influenced individual dietary diversity in the study area. On the other hand, distance to nearest market and remittances negatively influence individual dietary diversity.
In the light of these findings, we recommend that the regional and federal governments should provide educational empowerment trough training for households to broaden their understanding of the nutritional health benefits of a diverse diet. Also Sinana Agricultural and Natural Resources Office and stakeholders in the agricultural sector should promote and encourage crop diversification strategies, expand access to irrigation, introduce agricultural technologies to boost income of rural households and thus diversify their diet. Further, market infrastructure should be improved to enhance households’ access to market that could contribute to improving household dietary diversity.
CONFLICT OF INTERESTS
The authors have not declared any conflict of interests.
REFERENCES
|
Alderman H, Hoogeveen H, Rossi M (2006). Reducing child malnutrition in Tanzania: Combined effects of income growth and program interventions. Economics and Human Biology, Elsevier 4(1):l1-23. |
|
|
Annet A (2015). Putting gender at the heart of Africa RISING research in the Ethiopian Highlands. Transforming African agriculture through sustainable intensification. Research in Brief. |
|
|
Arimond M, Ruel M (2002). Summary indicators for infant and child feeding practices: An example from the Ethiopia Demographic and Health Survey 2000, Food Consumption and Nutrition Division Discussion Paper, Washington, D.C.: International Food Policy Research Institute. |
|
|
Bealu B, Tekle E, Fissahaye A, Desalegn M (2017). Household Food Insecurity and Its Association with Nutritional Status of Children 6-59 Months of Age in East Badawacho District, South Ethiopia. Journal of Environmental and Public Health: Volume 2017, Article ID 6373595, 17 pages |
|
|
Becquey E, Martin-Prevel Y, Traissac P, Dembélé B, Bambara A, Delpeuch (2010). The household food insecurity access scale and an index-member dietary diversity score contribute valid and complementary information on household food insecurity in an urban West-African setting. The Journal of Nutrition 140(12):2233-2240. |
|
|
Belachew T, Tessema M, Ersino G (2013). Feeding patterns and stunting during early childhood in rural communities of Sidama, South Ethiopia. Pan African Medical Journal - ISSN: 1937- 8688. |
|
|
Cameron AC, Trivedi PK (2013). Regression Analysis of Counts Data. Cambridge University Press. |
|
|
Central Statistical Authority (CSA) (2011). Demographic Health Survey. Addis Ababa, Ethiopia. Ethiopia Demographic and Health Survey 2011. |
|
|
Central Statistical Authority (CSA) (2015). Ethiopia Socioeconomic Survey (ESS) wave two (2013/2014): Basic information document. Addis Ababa, CSA. |
|
|
Cordero-Ahiman OV, Santellano-Estrada E, Garrido A (2017). Dietary diversity in rural households: The case of indigenous communities in Sierra Tarahumara, Mexico. Journal of Food and Nutrition Research 5(2):86-94. |
|
|
Degye G, Belay K, Mengistu K (2013). Measuring diet quantity and quality dimensions of food security in rural Ethiopia. Journal of Development and Agricultural Economics 5(5):174-85. |
|
|
Drescher LS, Thiele S, Mensink GB (2007). A new index to measure healthy food diversity better reflects a healthy diet than traditional measures. The Journal of Nutrition 137(3):647-651. |
|
|
Ecker O, Tan FT, Alpuerto V, Diao X (2013). Economic growth and agricultural diversification matters for food and nutrition security in Ghana. Ghana strategy support program, discussion note number 031. IFPRI, Washington DC |
|
|
Faber M, Schwabe C, Drimie S (2009). Dietary diversity in relation to other household food security indicators. International. Journal Food Safety Nutrition and Public Health 2(1):1-15. |
|
|
Food and Agriculture Organization (FAO) (2010). Guidelines for Measuring Household and Individual Dietary Diversity. Rome-Italy |
|
|
Food and Agriculture Organization (FAO) (2011). Guidelines for Measuring Household and Individual Dietary Diversity, Rome-Italy. |
|
|
Gaiha R, Kaieker H, Imai KS, Kulkarni VS, Thapa G (2012). Diet diversification and diet quality in India: an analysis. Discussion paper series RIEN DP 2012-30, Kobe University, Japan. |
|
|
Gebremedhin S, Baye K, Bekele T, Tharaney M, Asrat Y, Abebe Y, Reta N (2017). Predictors of dietary diversity in children ages 6 to 23 mo in largely food-insecure area of South Wollo, Ethiopia. Nutrition 33:163-168. |
|
|
Ghandilyan A, Vreugdenhil D, Aarts MGM (2006). Progress in the genetic understanding of plant iron and zinc nutrition. Physiologia Plantarum126(3):407-417. |
|
|
Gitagia M, Ramkat R, Mituki D, Termote C, Covic N, Cheserek M (2019). Determinants of dietary diversity among women of reproductive age in two different agro-ecological zones of Rongai Sub-County, Nakuru, Kenya. Food and Nutrition Research 63:1553 |
|
|
Hirvonen K, Hoddinott J (2017). Agricultural production and children's diets: evidence from rural Ethiopia. Agricultural Economics 48(4):469-480. |
|
|
Horton S, Ross J (2003). The Economics of Iron Deficiency. Food Policy 28(1):51-75. |
|
|
Jones D, Shrinivas A, Bezner-Kerr R (2014). Farm production diversity is associated with greater household dietary diversity in Malawi: Findings from nationally representative data. Food Policy 46:1-12. |
|
|
Kalkuhl M, Kornher L, Kozicka M, Boulanger P, Torero M (2013). Long-Term Drivers of Food and Nutrition Security. FOODSECURE working paper no.06. The Hague: LEI Wageningen UR. |
|
|
Kalle H, Alemayehu S, Ibrahim W (2015). Seasonality and household diets in Ethiopia. Ethiopia Strategy Support: Ethiopian Development Research Institute. Working Paper, p. 74 |
|
|
Koppmair S, Kassie M, Qaim M (2016). Farm production, market access and dietary diversity in Malawi. Public Health Nutrition 20(2):325-335. |
|
|
Liu J, Gerald E, James K (2014). Access to variety contributes to dietary diversity in China. Food Policy 49:323-331. |
|
|
Melaku D, Mohammed A, Mesfin T, Meskerem T (2019). Dietary Diversity and Associated Factors among Pregnant Women Attending Antenatal Clinic in Shashemane, Oromia, Central Ethiopia: A Cross-Sectional Study. Journal of Nutrition and Metabolism. Volume 2019, Article ID 3916864, 7 pages |
|
|
Motuma G, Akalu D, Beneberu A (2019). Determinants of household dietary diversity in Yayu Biosphere Reserve, Southwest Ethiopia. Ethiop. Journal of Science and Technology 12(1):45-68. |
|
|
Nega G, Melkie E, Degnet T, Amanuel N, Rigbe W (2015). Dietary Diversity and Associated Factors Among Rural Households in South Gondar Zone, Northwest Ethiopia. Feed the Future Research Award. |
|
|
Ochieng J, Victor AS, Lukumay PJ, Dubois T (2017). "Determinants of dietary diversity and the potential role of men in improving household nutrition in Tanzania," PLoS One 12(12) Article ID e0189022. |
|
|
Rashid DA, Smith L, Rahman T (2011). Determinants of dietary quality: evidence from Bangladesh. World Development 39:2221-2231. |
|
|
Ruel MT (2003). Operationalizing dietary diversity: a review of measurement issues and research priorities. The Journal of Nutrition 133(11):3911S-3926S. |
|
|
Ruel MT, Nguyen PH, Avula R, Saha KK, Ali D, Tran LM (2013). Maternal and child dietary diversity are associated in Bangladesh, Vietnam, and Ethiopia. The Journal of Nutrition 143(7):1176-83. |
|
|
Sibhatu K, Krishna V, Qaim M (2015). Production diversity and dietary diversity in smallholder farm households. Proceedings of the National Academy of Sciences 112(34):10657-10662 |
|
|
Taruvinga A, Muchenje V, Mushunje A (2013). "Determinants of rural household dietary diversity: the case of Amatole and Nyandeni districts, South Africa. International Journal of Development and Sustainability 2(4):1-15. |
|
|
UNICEF (2009). Tracking Progress on child and maternal nutrition: A survival and development priority. |
|
|
Vakili M, Abedi P, Sharifi M, Hosseini M (2013). Dietary Diversity and Its Related Factors among Adolescents: A Survey in Ahvaz-Iran. Global Journal of Health Science 5(2):181. |
|
|
Von Braun J, Tadesse G (2012). Global food price volatility and spikes: an overview of costs, causes, and solutions ZEF-Discussion Papers on Development Policy. Bonn: ZEF. |
|
|
Woldehanna T, Behrman JR (2013). What determines Ethiopian children's dietary diversity. Paper presented at center for the study of African Economics (CSAE) held at St. Catherine's College Oxford 17-19 March 2013. |
|
|
Workicho A, Belachew T, Tolu GF, Wondafrash B, Carl L, Roosmarijn V, Patrick K (2016). Household dietary diversity and animal source food consumption in Ethiopia: evidence from the 2011 welfare monitoring survey. BMC Public Health 16:1192. |
|
|
World Health Organization (WHO) (2010). World Health Statistics: |
|
|
Wossen T, Tahirou A, Arega A, Mekbib G, Shiferaw F, Adetunji O, Victor M (2017). Impacts of extension access and cooperative membership on technology adoption and household welfare. Journal of Rural Studies 54:223-233. |
|
|
Yamane T (1967). Statistics, an introductory analysis. 2nd ed. New York: Harper and Row. |
|
Copyright © 2024 Author(s) retain the copyright of this article.
This article is published under the terms of the Creative Commons Attribution License 4.0


