ABSTRACT
This article analyzes the potential impacts of climate change on agriculture in Mexico using a Ricardian model with panel data. The analysis uses economic data from 2,431 municipalities for the period 2003 to 2009. The study distinguishes between irrigated, rainfed and mixed farms and includes extreme weather events as an additional variable. The results indicate that irrigated farms are more vulnerable to temperature variations, while rainfed farms are more vulnerable to precipitation changes and extreme weather events. The projected impact in net revenue per hectare, considering a temperature rise of 2.5°C and a 10% reduction in precipitation, are between -18.6 and -36.4% of net revenue considering all type of farms. This climate scenario predicts average losses of net revenue ranging from, 26 to 55%; 14 to 25% and 27 to 37% for irrigated, rainfed and mixed municipalities, respectively.
Key words: Climate change, agriculture, Latin America, Ricardian model, panel data.
Agricultural activities are sensitive to climate conditions and therefore to climate change (Cline, 2007). This is particularly relevant in Mexico considering the current conditions of agricultural activities, such as limited water supply and financial resources, inadequate infrastructure and a rather complex socioeconomic conditions, including different farms types and ownership status and that the agricultural sector contributes with about 3.4% of the Gross Domestic Product (GDP) and concentrates about 13.9% of the labor force in 2012 (Mexican data comes from the National Institute of Statistics and Geography (Instituto Nacional de Estadística y Geografía -INEGI).).
There are alternative methods to analyze the potential consequences of climate change in agricultural activities; one of the most promising options is the Ricardian Model (RM) or Hedonic Approach (Mendelsohn et al., 1994). The RM analyses the potential economic impacts of climate change on farm values or net revenues per hectare across regions under the assumption that land value, in a competitive land market, reflects agricultural productivity and therefore different productivities among regions can be related to climate conditions, soil types and socioeconomic and demographic characteristics (Mendelsohn et al., 1994). There are already several studies using a RM (Mendelsohn and Dinar, 2009). However, this approach has been criticized for a number of issues (De Salvo, et al., 2014); for example, for the omission of relevant variables such as the carbon fertilization effect, the effects of price adjustments or the adaptation processes, the irrigation or extreme weather events effects and the structural instability of the estimated coefficients (Dinar and Mendelsohn, 2011). Some of these omitted factors can be incorporated inside the RM framework; in particular the relevance of extreme weather events and irrigation and the analysis of the stability of the coefficients.
As irrigation practices have been regarded as a key adaptation measure (Magrin et al., 2007; Seo, 2011; De Cunha, et al., 2015), it is important to separate climate effects between rainfed and irrigated farms. In Latin America irrigation represents a high percentage of water use and it is a key element in agricultural production considering its effects on yields, product quality diversification of production and their contribution to food security (FAO, 2000). Nevertheless, irrigation practices changes by geographic area, depending on water availability, climate and land conditions, on the farming system and on the existence of water infrastructure (McCarthy, 2014).
Therefore, the main objective of this article is to analyze the potential economic impacts of climate change in the Mexican agricultural activities using a RM and considering the consequences of extreme weather events, the irrigation practices and the stability of the coefficients. The division between irrigated and rainfed farms is particularly relevant for Mexican agricultural considering the strong socio-economic differences between these two groups. The analysis uses information that covers all the national territory considering the municipalities as the main unit of analysis. The article has four sections. The first section is, obviously, the introduction; the second section presents a general framework and a brief literature review. The third section presents the main results and the fourth one includes the conclusions.
General framework and literature revision
The Ricardian Model argues that the value of land reflects the present value of future net revenue and therefore it is closely related with land productivity (Mendelsohn and Dinar, 2009). Farmers try to maximiz their profits selecting between alternative economic options, including crops, livestock and productive factors, given the weather conditions (Mendelsohn et al., 1994). Therefore, in the RM, the value of the farm or the net value per hectare is a function of climate variables, soil types and altitude features; nutrient availability and socioeconomic and demographic control variables (Mendelsohn et al., 1994; Mendelsohn and Dinar, 2009):

Where is the net revenue of farm , is a vector of input and output prices, is the production function of each crop or livestock, is the vector of endogenous input choices (that is, fertilizer, seeds, irrigation), is the weather conditions, is a vector of the economic, social and demographic control variables, is the vector of soil characteristics and the index is the selection of crops or livestock.
The econometric specification of the Ricardian Model (RM) is a reduced form that includes as the endogenous variable either land farm values or net revenues per hectare and as exogenous variables soil types, socioeconomic and demographic household characteristics as control variables and weather conditions, either in a linear o log-linear form (Mendelsohn et al., 1994):

Where is net revenue per hectare or net land value for i farms. Net revenue per hectare is normally estimated as the sum of the quantities of crops multiplied by their price divided by the crop surface of land; this is an average value, not a precise estimation (Mendelsohn and Dinar, 2009). are the climate variables including normal temperature and precipitation patterns, is a vector of soil types and characteristics and are control variables including household, production and geographic characteristics. Finally, are the estimated coefficients and ut is the error term. The estimated coefficients in equation (2) can vary over time (Massetti and Mendelsohn, 2011a).
The marginal impact of the climate variables is estimated, in Equation (2), at the mean of the sample, substituting the level of a specific climate variable ( ) value, either in linear (Equation 3) or in log-linear form (Equation 4) (Mendelsohn and Dinar, 2009):
Therefore the climate change impacts on welfare are estimated as (Mendelsohn and Dinar, 2009):
There are already several econometric estimations using the RM with different variables, specifications, regions, time spans and econometric methods. For example, there are several Ricardian models for the United States (Mendelsohn et al., 1994, 1996, 2004); for African countries and China, Israel, India, South Africa and Sri Lanka (Mendelsohn and Dinar, 2009; Kurukulasuriya and Mendelsohn, 2007a). Also, there are several Ricardian models for countries in Latin America, for example, Argentina, Brazil, Chile, Colombia, Ecuador, México, Uruguay and Venezuela (Sanghi, 1998; Mendelsohn et al., 2000; Lozanoff and Cap, 2006; Timmins, 2006; Gonzalez and Velasco, 2008; Mendelsohn and Seo, 2007a, b; Seo and Mendelsohn, 2007, 2008a, b, c; Sanghi and Mendelsohn, 2008; Mendelsohn, 2009; Mendelsohn et al., 2007a, 2010; FAO, 2012).
The aggregate evidence, from these RM, indicates the presence of a concave significant non-linear relationship between physical agricultural yields and temperature and precipitation with different threshold points for each type of crop and a large uncertainty about the specific magnitude of the net impact. For example, Mendelsohn et al. (2007b) find that a rise in temperatures significantly reduces land values for all farm types in Latin America; that is, cropland values in South America would fall by 33% for every 10% increase in temperature. However, these impacts are heterogeneous; that is, regions with already warm weather in South America will suffer more from climate change than regions with relatively cold weather (Seo and Mendelsohn, 2008b). Also, Seo (2011) shows that South American land values will decrease 17.2% for rainfed farmers, and increase about 17% for producers with private irrigation. In Brazil, Timmins (2006) finds damages of 0.62% on net farm income, while Sanghi (1998) predict damages of about 10.5% average. Mendelsohn et al. (2010) simulate, for Mexico, that a marginal increase in annual temperature reduces land value by -6,500 (24%) to -7,700 (28%) Mexican pesos per degree Celsius and predict an average negative impact between 42 and 54% of land value for 2100. Additionally, the evidence shows that climate change impacts are different between irrigated and rainfed farms. For example, climate change in Mexico has a larger impact on irrigated than on rainfed farms (Mendelsohn and Dinar, 2009, pp. 161). This result is not necessary consistent with the evidence from South America (Seo and Mendelsohn, 2008b), but may be associated with the case that irrigated farms are located in dry land zones, (Mendelsohn et al., 2007b; Mendelsohn and Seo, 2007b).
The evidence also shows that irrigation changes climate sensitivity and, in some cases, reduces the potential damages of climate change (Kurukalasuriya and Mendelsohn, 2007b; Fleischer and Kurukulasuriya, 2011). In general, farms with irrigation have different climate response than rain fed farms; however, these climate responses can differ by region (Mendelsohn and Nordhaus, 1999; Schlenker et al., 2007; Seo and Mendelsohn, 2008b). For example, some evidence shows that rainfed farms are more sensitive to temperature than irrigated farms (Seo and Mendelsohn, 2007). There is also evidence that the value of farms with irrigation systems in United States is not sensitive to changes in precipitation and their value increases with temperature (Mendelsohn and Dinar, 2003).
There is also evidence suggesting that the decision to irrigate depends on climate and other factors such as crops choices, land quality, evaporation rates, water shortages and high water prices and farm income (Dinar and Yaron, 1990; Dinar and Siberman, 1991; Fleisher et al., 2008). In particular, the Structural Ricardian Models (Mendelsohn and Seo, 2007a, 2007b; Seo and Mendelsohn, 2008b, 2008d) consider that irrigation is an endogenous decision that depends on climate; for example, farms with higher precipitation induce a reduction in irrigation or farmers with a temperature rise increase irrigation (Kurukulasuriya and Mendelsohn, 2008; Seo et al., 2009; Fleischer and Kurukulasuriya 2011; Seo, 2011). In the case that irrigation is an endogenous decision, there exists a potential risk that the econometric results of the RM might be biased(Darwin, 1999; Kurukulasuriya and Mendelsohn, 2007b).
There are several debates about the RM such as:
1. The RM does not include the potential consequences of the carbon dioxide (CO2) fertilization effect (Adams et al., 1990; Reilly et al., 1996). Laboratory experiments show that CO2 concentrations generate higher crop yields and therefore climate change will be accompanied with a positive fertilization effect (Mendelsohn, 2007; Muller et al., 2010; McGrath and Lobell, 2013). Nevertheless, carbon fertilization does not affect crop productivity proportionally; it will have a bigger effect on modern farms than on labor-intensive farms.
2. The RM is based on current farming practices and includes some potential adaptation processes (Mendelsohn et al., 1996), but excludes other potential adaptation processes such as adjustment in prices. Therefore, the RM gives a biased estimation of the potential consequences of climate change and probably represents a lower bound of the climate change costs.
3. The RM is based on the mean of normal climate variables and therefore it does not include, explicitly, the potential impacts of extreme climate events. There are already several RM including some measure of climate variance (Alexandrov and Hoogenboom, 2000; Chang, 2002; Schlenker and Roberts, 2006, 2009; Mendelsohn et al., 2007d; Deschenes and Greenstone, 2011). These studies show that extreme weather events have a negative impact on agriculture yields and their inclusion modified the normal mean climate coefficients. Moreover, some authors (Schlenker et al., 2006; Deschenes and Greenstone, 2011) use climate variability as a base to evaluate the potential impacts of climate change.
4. The RM does not include explicitly the consequences of irrigation and water availability and does not separate irrigated from rainfed farms. There are already several RM that include separate regressions for irrigated and rainfed farms or include irrigation and water extraction as additional variables (Mendelsohn and Dinar, 2003; Schlenker et al., 2005; Cline, 2007; Fleischer et al., 2008).
The evidence indicates that agricultural productivity reacts differently between rainfed and irrigated farms, that farms with irrigation can tolerate higher temperatures and, under certain circumstances, lower precipitation and the addition of the irrigation variable modifies the climate parameters (Aggarwal and Sinha, 1993; Schlenker et al., 2005; Cline, 2007; Wang et al., 2009). Additionally, the results indicate that water extraction increases farm value in USA and Israel (Mendelsohn and Dinar, 2003; Fleischer et al., 2008; Fleischer and Kurukulasuriya, 2011). The evidence for Mexico indicates that irrigated farms are more vulnerable to climate change than rain fed farms (Mendelsohn and Dinar, 2009:114). There are several criticisms on the initial application of the Ricardian model for not explicitly modeling irrigation water or considering it as an endogenous variable (Darwin, 1999; Schlenker et al., 2005). That is, the omission of an endogenous variable such as irrigation, which itself is a function of climate variables, might bias the results (Darwin, 1999). However, Schlenker et al. (2005) and Mendelsohn and Dinar (2003) still consider irrigation as en exogenous variable. In this case, there are several methods to include irrigation either using an irrigation dummy or separating the samples (Deressa et al., 2005). Also, Fleischer et al. (2008) and Mendelsohn and Nordhaus (1999) initially estimate an irrigation equation and then they include the irrigation simulations in the traditional Ricardian model, but they do not find very different results.
5. The climate coefficients in the RM are not stable over time and space, these coefficients are very sensitive to the control variables, and there is a potential miss-specification problem in the RM (Cline, 1996; Polsky, 2004; Schlenker et al., 2005; Deschenes and Greenstone, 2007; Massetti and Mendelsohn, 2011a, b). Several studies have already been published which evaluate the stability of these climate coefficients, most using panel data (Schlenker et al., 2006; Deschenes and Greenstone, 2007, 2011; Massetti and Mendelsohn, 2011a, b). In this context, Schelenker et al. (2006) and Massetti and Mendelsohn (2011a) indicate that the climate coefficients are stable; while Sanghi and Mendelsohn (2008) discover statistically significant time dummies; moreover, Deschenes and Greenstone (2007) suggests the relevance of a time trend to control for time-invariant unobserved heterogeneity with a panel approach using fixed effects.
[1] Farm values and net revenues are equivalent under the assumption that land markets are perfect markets so that property prices reflect the present discounted value of future land rents and that value reflects net productivity of the land (Dinar and Mendelsohn, 2011).
[2] Agricultural production is the consequence of a multitude of factors and conditions such as soil characteristics, socioeconomic factors (capital, labor, technology specific inputs such as fertilizers), even specific diseases and insects and climate conditions and fluctuations (Dinar and Mendelsohn, 2011).
[3] For a formal derivation of the Ricardian Model see Mendesohn and Dinar (2009).
[4] The purpose is to measure overall productivity of the land (Mendelsohn and Dinar, 2009:109)
.
[5] There are advantages and disadvantages using land values or net revenue per hectare, but in emerging economies the main problem is, normally, the lack of reliable data on land values (Mendelsohn and Dinar, 2009:60).
[6] Farm choices regarding use of labor, capital and crop choice are endogenous variables to the model and therefore they are not included (Mendelsohn and Dinar, 2009:38).
[7] Net revenue per hectare is gross revenue minus estimated costs (Mendelsohn and Dinar, 2009:62). Net revenue is defined as gross revenue minus different factors such as the cost of transport, packaging and marketing, storage, post-harvest losses, hired labor (valued at the median market wage rate), light farm tools (such as files, axes, machetes, etc.), rental or costs on heavy machinery (tractors, ploughs, threshers and others), value of building per hectare, fertilizer and pesticide and the annual cost of capital including animal power.
[8] For example, Mendelsohn and Nordhaus (1999) in order to cope with the potential bias consequence of the endogeneity of irrigation to climate use a predicted irrigation variable instead of actual irrigation.
[9] The specific magnitude of the effect depends on the type of crop and water availability. Recent evidence suggests that the CO
2 effect is less relevant than previously expected (Ziska, 2011).
[10] For example, it is not possible to translate losses in yields into losses on farmer’s real income, because the adaptation process might change the final output (Reidsma et al., 2010).
[11] The RM might capture some actual adaptation procedures trough the modifications of the actual production practices and the adjustment of inputs and outputs to local conditions, in particular, to local climate conditions. Therefore, the RM is not essentially subject to the “dumb farmer” critique but implicitly assumes no adjustment costs and therefore gives a lower estimate of the climate change cost (Quiggin and Horowitz, 1999, 2003).
[12] It is possible to include weather variance, diurnal variance, change in temperature over the day, inter-annual variance, the change in weather from year to year, number of days above o below certain temperature degrees instead of temperature to proxy extreme weather events or climate volatility (Schlenker et al., 2006, 2007).
[13] There is a difference between adapting to climate variability and climate change.
[14] Fleischer et al. (2008) considers irrigation as an exogenous variable. This hypothesis is tested by regressing irrigation quotas in climate variables and obtaining a very low R
2.
[15] There is a positive correlation between crop water and maize yields (Kang et al., 2009).
[16] Mendelsohn and Nordhaus (1996) and Mendelsohn and Dinar (2003) show that dividing between rainfed and irrigated farms does not change much the results.
[17] Therefore, adaptation is a fundamental factor and government water subsidies are also a relevant factor (Schlenker et al., 2005; Mendelsohn and Dinar, 2009).
[18] González and Velasco (2008) divide the sample between irrigated and rainfed farms and by farm size in Chile.
[19] For example, economic development reduces climate sensitivity (Mendelsohn et al., 2001).
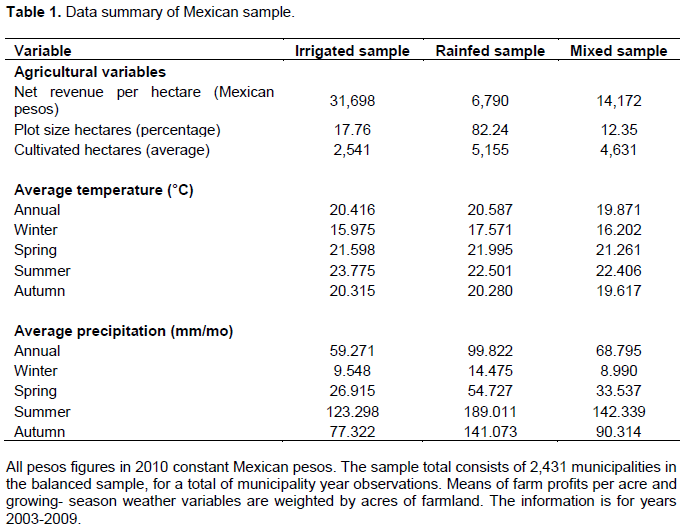
The database used in this study consists of a balanced panel from 2003 to 2009 with observations from the 2,431 municipalities (administrative divisions similar to US counties) found in the 32 states in Mexico. The information came from the SIAP (Servicio de Información Agroalimentaria y Pesquera) and SIMBAD (Sistema Estatal y Municipal de Base de Datos) run by INEGI (Instituto Nacional de Estadística y Geografía) and SNIM (Sistema Nacional de Información Municipal). The average characteristics of the data are summarized in Table 1. The remaining variables are
obtained from other data sources and attributed to each Mexican municipality. Units of measurement are metric; economic variables have all been converted to constant 2010 Mexican pesos using the price index deflator.

The economic and socio-demographic information come from the SIMBAD database. This database provides detailed information on assets, socio-demographic characteristics, production, irrigation water consumption, mechanized farming, electricity service, educational infrastructure, access to equipment and financing, and different income sources. The net revenue per cropped hectare for each municipality k in year t, is estimated multiplying the product price at farm gate by the quantity of crop i and then deducting total costs. The average land value per hectare for the period 2003 to 2009 was 37,615 Mexican pesos for the irrigated sample, 6,790 Mexican pesos for rainfed farms and 14,172 Mexican pesos for mixed farms. This information reflects the heterogeinity of the agricultural Mexican sector.
The data for the climate variables are derived from the Servicio Meteorológico Nacional (SMN-CONAGUA) and include minimum and maximum temperature and precipitation on a monthly and daily time scale for a 2.5*2.5-mile-grid in Mexico for the years 1901 to 2009. The base unit of analysis is the agricultural area in each 2.5*2.5-mile-grid cell and then a weighted average of the climate variables are calculated at each grid point. Longitude and latitude are area-weighted averages of the longitude - latitude combinations of all agricultural areas in a municipality. The normal climate variables are the average of the weather variables over 100 years. The monthly values were then aggregated by quarters, for winter with the months of December, January, and February; spring with March, April and May; summer with June, July, and August; and autumn with September, October and November. The mean annual temperature for the mixed sample for 2003 to 2009 is 19.87°C, the mean annual temperature for irrigated farms is 20.41 and 20.59°C for rainfed farms. The mean annual precipitation for the mixed sample is 68.8 mm/mo; and 59.3 mm/mo for irrigated farms, while rainfed farms registered 99.8 mm/mo. This evidence shows that rainfed farms are located in areas with higher precipitation rates that irrigated farms.
The extreme weather events variable is defined using alternative measures such as the diurnal variance, the change in temperature over the day, the inter-annual variance, the change in weather from year to year. Daily maximum and minimum values are commonly used as an input in various environmental applications, including agricultural and ecological models to predict likely changes at field and agricultural productivity level (Reddy et al., 1997; Mendelsohn et al., 2010). Data on elevation at the centroid of each district was obtained from SIMBAD. There are several sources of possible error, including misreporting of net revenue per hectare per hectares and socio-demographics or unavailable characteristics of cropland and other potential omitted variables.
It is worth mentioning that agricultural production in Mexico is concentrated on maize (white corn), sorghum and beans. These crops are cultivated in almost all 32 states, throughout the year and take up 50% of the irrigated farmland and 80% of the rainfed areas and generate about 50% of total agricultural production value (SIAP, 2014).
[20] Shlenker et al. (2006) shows that averages of 10 and 30 years do not change the results.
[21] Seasonal diurnal variables can measure factors such as the difference between daily minimum and maximum temperatures. Also, a degree-days variable is constructed as an alternative temperature variable as propose by Schlenker et al. (2006). The variable degree days is defined as the sum of degrees above a lower baseline and below an upper threshold during the growing season (Schlenker et al., 2006).
The net revenues per hectare are regressed on climate and other control variables for the whole sample (Table 2). All regressions have the same set of independent variables as the parsimonious regression. The log linear estimations of Equation (5) including the whole sample and the division between irrigated and non-irrigated farms are summarized in Table 2. The R-squared values are 0.25 for the irrigated sample, 0.28 for rainfed sample, and 0.38 for the mixed model. In general, the results indicate that agricultural yields in Mexico are sensitive to climate variables and that irrigated, non-irrigated and mixed farms have different responses to weather conditions.
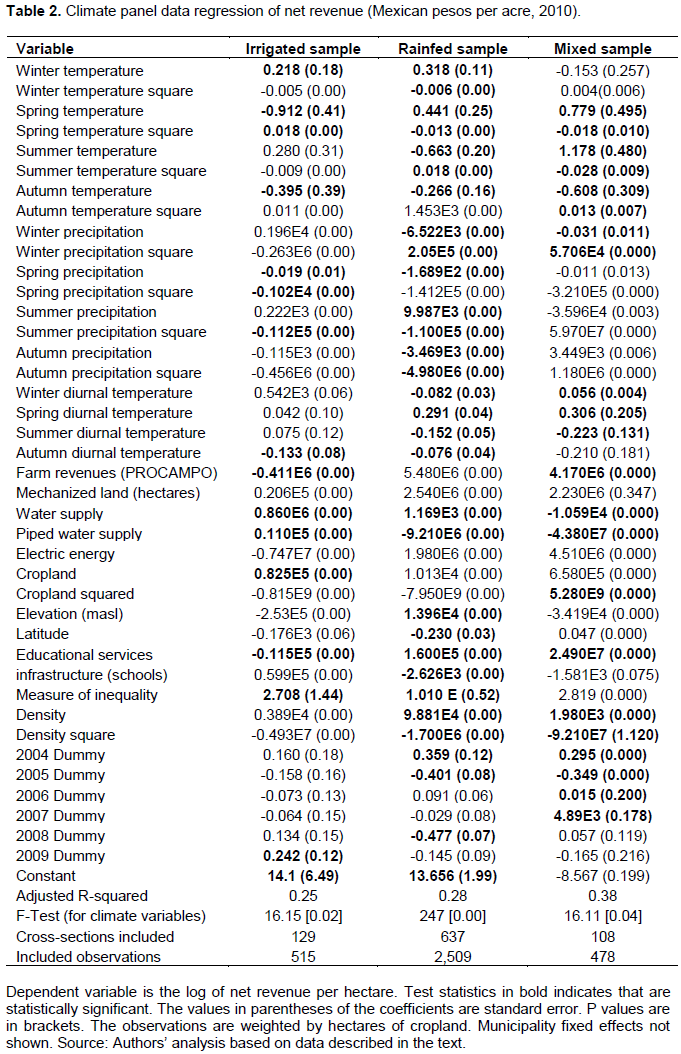
The quadratic term of the climate variables is, in general, statistically significant suggesting that the relationship with net revenues is hill-shaped. The results indicate that the sums of the square terms are negative, but there are also different seasonal effects. Also, the evidence indicates that both irrigated and rainfed farm yields suffer from warmer weather and from a reduction in precipitation. However, irrigated farms with higher incomes are more likely to suffer larger impacts due to temperature changes than reinfed farms. This is probably the result that irrigated farms in Mexico are more profitable but are located in regions with fewer precipitation levels and are willing to take more weather risks. On the contrary, rainfed farms have lower incomes, but with less weather risks as they are located in regions with better precipitation patterns. This result is consistent with the evidence for México, but at odds with the general evidence for South America (Mendelsohn et al., 2010; Seo and Mendelsohn, 2008c).
The econometric evidence indicates that extreme weather events, defined as the difference between year-month mean maximum and minimum temperatures, have an additional negative impact on the farm net revenue and that climate coefficients change with the inclusion of the extreme weather events variable (Table 2). Also, it is worth noticing that rainfed farms are more vulnerable to extreme weather events than irrigated of mixed farm type municipalities. This is consistent with the argument that irrigated or mixed farms have more alternatives and options to address the increase in weather variability (Seo, 2010).
Some of the control variables are statistically significant suggesting the relevance of socioeconomic, demographics and technological variables such mechanization, water supply, access to electricity, elevation or population density variables.
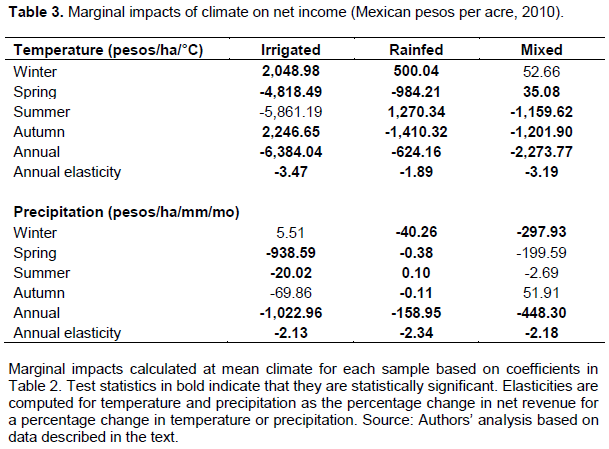
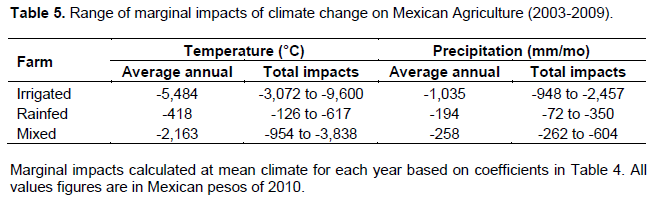
The marginal climate values from Equation (6) are presented in Table 3. The columns of Table 3 represent the annual marginal temperature and precipitation effects, calculated at the mean temperature and precipitation for the irrigated sample, rainfed and mixed farms. The results, for the whole sample, suggest that higher annual temperature on irrigated farms reduce net revenues per hectare in -6,384 pesos/ha/°C. Higher summer temperatures are harmful, whereas warmer autumn temperatures are beneficial for irrigated farms. Higher temperatures decrease the net revenues of rainfed farms by -624 pesos per degree Celsius and -2,274 pesos per degree Celsius for mixed farm type municipalities. An increase in the temperature during spring and autumn seasons in rainfed municipalities reduces the net revenue per hectare by -948 and -1,410 Mexican pesos/°C, respectively. However, a temperature increase in mixed farm type municipalities, during summer and autumn seasons, decreases the net revenue per hectare by -1,160 and -1,202 Mexican pesos/°C, respectively.

The estimated climate elasticities indicate that a 1% increase in temperature will lead to a 3.19% decrease in net revenues for the mixed sample, a 3.47% for irrigated farms and 1.89% for rainfed farms (Table 3). These results show that irrigated farms are more sensitive to temperature change than rainfed farms. This result is relatively consistent with Mendelsohn et al. (2007b) indicating that cropland values in South America would fall by 33% for every 10% increase in temperature. It is worth mentioning that extreme weather events, approximated with a proxy of temperature, have larger impacts on rainfed farms; therefore, it is possible to argue that part of the temperature impact on rainfed farms is capture by the extreme weather variable. Decreasing annual overall precipitation reduce net revenue per hectare by 159 pesos/ha/mm/mo for the rainfed sample and 1,022 and 448 pesos per mm/mo for irrigated and mixed municipalities. The elasticities of annual overall precipitation are similar for all type of farms and indicate that a decrease in precipitation has a negative effect on net revenue. The precipitation elasticity is larger for municipalities with rainfed farm types (-2.39) than for those with irrigated (-2.13) and mixed (-2.18) farms. Therefore, changes in rainfall are more damaging to rainfed farms. This indicates that rainfed farms are rather vulnerable to climate change in Mexico, specially, including the potential consequences of extreme weather events and rainfall changes.
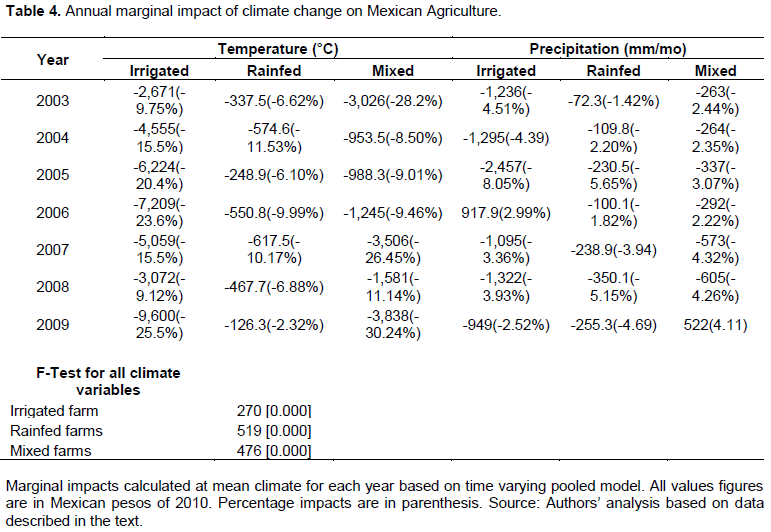
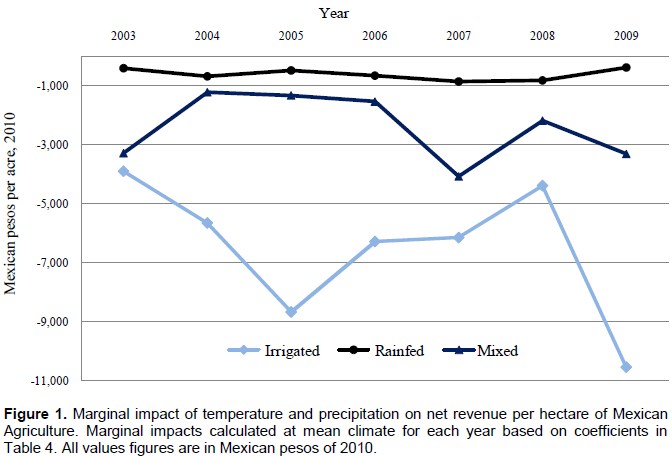
Table 4 includes the marginal temperature, precipitation and extreme weather events impacts for each year of the sample. These results show that the null hypothesis of the stability of the coefficients of the marginal impacts of temperature and precipitation is rejected. This implies that the results of the analysis involve a significant uncertainty level. For example, Table 5 and Figure 1 show the range of coefficients for each year for rain fed, irrigated and mixed farms.


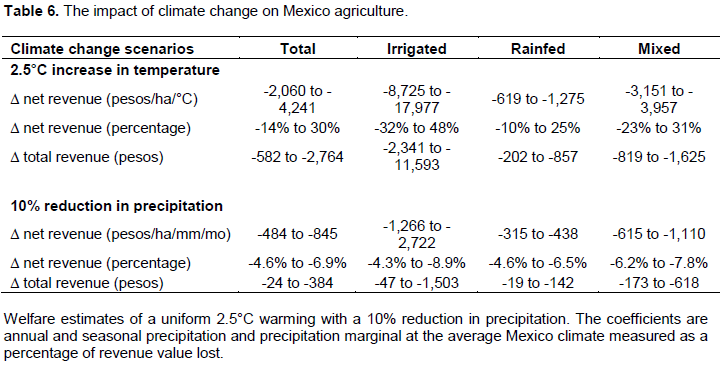
The potential impact of climate change on net revenue per hectare is analyzed using the climate coefficients reported in Tables 4 and 5 and considering a climate scenario only for temperature and precipitation considering that extreme weather events still involve larger uncertainties. The projections consider an absolute change in temperature and a percentage change in precipitation for each municipality. The projected climate scenarios are, relatively similar to Mendelsohn and Williams (2004), with a 2.5°C temperature rise and a 10% reduction in precipitation (Table 6). The projections are calculated for each farm separately and then the aggregate net revenue is estimated and compared to the aggregate net revenue in the base year. The changes in net revenue per hectare are, considering year by year of the sample, between -2,060 and -4,241 pesos (-14 and 30% of net revenue); -8,725 and -17,977 pesos (-32 and 48%); -619 and -1,275 pesos (-10 and 25%); and -3,151 to 3,957 pesos (23 to 31%) per degree Celsius for the whole sample, irrigated, rainfed and mixed farm type municipalities, respectively. The annual damages from a reduction in precipitation are between -484 and -845 pesos (-4.6 and 6.9% of net revenue); -1,266 and -2,722 pesos (-4.3 and -8.9%); -315 and -438 pesos (-4.6 and -6.5%) and -615 and 1,110 pesos (-6.2 and 7.8%) per mm/mo for the whole sample; irrigated, rainfed and mixed farm type municipalities.

Therefore, the total climate change impact, considering a temperature rise of 2.5°C and a 10% reduction in precipitation and depending of the year, are between -2,543 and -5,085 pesos (-18.6 to 36.4% of net revenue) for all type of farms. This climate scenario implies changes in net revenue per hectare between, depending of the year, -9,992 and -20,699 pesos (-26 and 55% of revenue net), -935 and -1,714 pesos (-14 and 25% of revenue net) and -3,816 and -5,068 pesos (-27 and 37% of revenue net) for irrigated, rainfed and mixed municipalities respectively.
[22] An important measure of climate variability, the increasing minimum temperatures with little overall change of the maximum can generate a decrease of the mean (and extreme) temperature (Karl et al., 1991; Chauhan et al., 2005).
[23] Several studies examine the changes in extreme weather patterns and potential damage to agriculture (Schlenker and Roberts, 2009; Seo, 2010; Huang et al., 2014).
This paper explores the potential impact of climate change on net revenue per hectare in Mexico using a Ricardian Model and agricultural census information for the total of 2,431 municipalities from 2003 to 2009. The analysis distinguishes between irrigated, rainfed and mixed farms. The results indicate that farmers in Mexico will experience net revenue losses from climate change. These effects are heterogeneous considering the type of farm, the type of weather effect (temperature, precipitation or extreme weather events), by season of the year and regarding the year of the estimation.
The results suggest that a rise of a one degree Celsius in temperature reduces net revenues per hectare in -6,384, -624 and -2,274 pesos/ha/°C for irrigated, rainfed and mixed municipalities, respectively. These effects are different by season of the year. The estimated climate elasticities indicate that a 1% increase in temperature will lead to 3.19% decrease in net revenues for the mixed sample, a 3.47% for irrigated farms and 1.89% for rainfed farms. These results show that irrigated farms are more sensitive to temperature change than rainfed farms. This evidence is consistent with Mendelsohn et al. (2007b) indicating that cropland values in South America would fall by 33% for every 10% increase in temperature. Decreasing annual overall precipitation reduce net revenue per hectare by 159 pesos/ha/mm/mo for the rainfed farms and 1,022 and 448 pesos per mm/mo for irrigated and mixed municipalities. In this case, the precipitation elasticity is larger for municipalities with rainfed farm types (-2.39) than for those with irrigated (-2.13) and mixed (-2.18) farms. Therefore, changes in rainfall are more damaging to rainfed farms. Also, the evidence indicates that extreme weather events, defined as the difference between year-month mean maximum and minimum temperatures, have an additional negative impact on the farm net revenue and that rainfed farms are more vulnerable to extreme weather events than irrigated farms. The econometric evidence rejects the null hypothesis that the estimated coefficients of the marginal temperature and precipitation are stable in all years. This implies that the results of the analysis involve a significant level of uncertainty.
A climate change projection, with a 2.5°C temperature rise and a 10% reduction in precipitation, relatively similar to Mendelsohn and Williams (2004), shows a significant negative impact on Mexican agriculture activities. The expected changes in net revenue per hectare are, considering year by year of the sample, between -8,725 and -17,977 pesos (-32% to 48%), -619 and -1,275 pesos (-10 and 25%) and -3,151 and 3,957 (23 and 31%) per degree Celsius for irrigated, rainfed and mixed farm type municipalities, respectively. The annual damages from a 10% reduction in precipitation are between -1,266 and -2,722 (-4.3 and -8.9%) pesos, -315 and -438 (-4.6 and -6.5%) and -615 and 1,110 pesos (-6.2 and 7.8%) per mm/mo for irrigated, rainfed and mixed farm type municipalities.
Finally, the total changes in net revenue per hectare, including a temperature rise of 2.5°c and a 10% reduction in precipitation are, depending of the year, between -2,543 and -5,085 pesos (-18.6 and 36.4% of net revenue) for all type of farms. This climate scenario implies changes in net revenue per hectare between, depending of the year, -9,992 to -20,699 pesos (-26 to 55% of revenue net), -935 to -1,714 pesos (-14 to 25% of revenue net) and -3,816 to -5,068 pesos (-27 to 37% of revenue net) for irrigated, rainfed and mixed municipalities respectively.
These results suggest the relevance to distinguish the type of farm and climate variable. For example, all type of farms yields suffers from warmer weather and from a reduction in precipitation. However, irrigated farms with higher incomes are more likely to suffer larger temperature impacts than rainfed farms. On the contrary, rainfed farms are more vulnerable (as a percentage) to a reduction in precipitation and extreme weather events.
The magnitude of these impacts are rather important considering that agricultural production in Mexico is concentrated on maize (white corn), sorghum and beans and therefore climate change might have a significant negative impact in food security. Therefore, these results reinforce the need for public policies to support adaptation strategies to combat the effects of global warming in the agricultural sector. The irrigation strategy has the potential to contribute to the improvement of the Mexican agricultural performance. Nevertheless, in order to maximize the potential benefits of irrigation as an adaption response, it will be necessary to consider the factors associated with the adoption of irrigation and the uncertainties associated with climate change. Also, these results suggest the relevance to develop a proper and differentiated insurance strategy for agricultural producers that covers normal climate variability and extreme weather events and the different type of farms.
The authors have not declared any conflict of interest.
REFERENCES
|
Adams RM, Rosenzweig C, Peart RM, Ritchie JT, Mccarl BA, Glyer JD, Curry RB, Jones JW, Boote KJ, Allen Jr LH (1990). Global climate change and US agriculture. Nature 345:219-224.
Crossref
|
|
|
|
Aggarwal PK Sinha SK (1993). Effect of probable increase in carbon dioxide and precipitation on wheat yields in India. J. Agric. Meteorol. 48:811-814.
Crossref
|
|
|
|
|
Alexandrov VA, Hoogenboom G (2000). The impact of climate variability and change on crop yield in Bulgaria. Agric. For. Meteorol. 104:315-327.
CrossRef
|
|
|
|
|
Chang CC (2002). The potential impact of climate change on Taiwan's agriculture. Agric. Econ. 27:51-64.
Crossref
|
|
|
|
|
Chauhan S, Khandelwal RS, Prabhu KV, Sinha SK, Khanna CR (2005). Evaluation of usefulness of daily mean temperature studies on impact of climate change. J. Agron. Crop. Sci. 191:88-94.
Crossref
|
|
|
|
|
Cline WR (1996). The impact of global warming of agriculture: Comment. Am. Econ. Rev. 86:1309-1311.
|
|
|
|
|
Cline WR (2007). Global warming and agriculture: Impact estimates by country. Peterson Institute.
|
|
|
|
|
Darwin R (1999). The impact of global warming on agriculture: A Ricardian analysis: Comment. Am. Econ. Rev. 89:1049-1052.
Crossref
|
|
|
|
|
De Cunha DA, Coelho AB, Féres JG (2015). Irrigation as an adaptive strategy to climate change: an economic perspective on Brazilian agriculture. Environ. Dev. Econ. 20:57-79.
Crossref
|
|
|
|
|
De Salvo M, Begalli D. and Signorello G (2014). The Ricardian analysis twenty years after the original model: Evolution, unresolved issues and empirical problems. J. Dev. Agric. Econ. 6:124-131.
CrossRef
|
|
|
|
|
Deressa T, Hassan RM, Poonyth D (2005). Measuring the impact of climate change on South African agriculture: The case of sugar-cane growing regions. Agrekon 44:524-542.
Crossref
|
|
|
|
|
Deschenes O, Greenstone M (2007). The economic impacts of climate change: Evidence from agricultural output and random fluctuations in weather. Am. Econ. Rev. 97:354-385.
Crossref
|
|
|
|
|
Deschenes O, Greenstone M (2011). Using Panel Data Models to Estimate the Economic Impacts of Climate Change on Agriculture. In: Dinar A, Mendelsohn R (eds.). Handbook on Climate Change and Agriculture. Edward Elgar Publishing.
Crossref
|
|
|
|
|
Dinar A, Yaron D (1990). Influence of Quality and Scarcity of Inputs on the Adoption of Modern Irrigation Technologies. Western J. Agric. Econ. 15:224-33.
|
|
|
|
|
Dinar A, Zilberman D (1991). The economics of resource-conservation, pollution-reduction technology selection: The case of irrigation water. Resourc. Energy 13:323-348.
CrossRef
|
|
|
|
|
Dinar A, Mendelsohn R (2011) .Handbook on Climate Change and Agriculture. Edward Elgar Publishing.
Crossref
|
|
|
|
|
FAO (2000). Irrigation in Latin America and the Caribbean. Water Reports 20. Rome Italy.
|
|
|
|
|
FAO (2012). México: El sector agropecuario ante el desafío del cambio climático. Secretaría del Medio Ambiente y Recursos Naturales.
|
|
|
|
|
Fleischer A, Kurukulasuriya P (2011). Reducing the impact of global climate change on agriculture–the use of endogenous irrigation and protected agriculture technology. In: Dinar A, Mendelsohn R (eds.). Handbook on Climate Change and Agriculture. Edward Elgar Publishing.
Crossref
|
|
|
|
|
Fleischer A, Lichtman I, Mendelsohn R (2008). Climate change, irrigation, and Israeli agriculture: Will warming be harmful?. Ecol. Econ. 65:508-515.
Crossref
|
|
|
|
|
Gonzalez R, Velasco J (2008). Evaluation of the Impact of Climatic Change on the Economic Value of Land in Agricultural Systems in Chile. Chil. J. Agric. Res. 68:56-68.
CrossRef
|
|
|
|
|
Huang JK, Jiang J, Wang X, Hou LL (2014). Crop Diversification in Coping with Extreme Weather Events in China. J. Integr. Agric. 13:677-686.
CrossRef
|
|
|
|
|
Kang Y, Khan S, Ma X (2009). Climate change impacts on crop yield, crop water productivity and food security-A review. Prog. Nat. Sci. 19:1665-1674.
Crossref
|
|
|
|
|
Karl TR, Kukla G, Razuvayev VN, Changery MJ, Quayle RG, Heim Jr RR, Easterling DR, Fu CB (1991). Global warming: Evidence for asymmetric diurnal temperature change. Geophys. Res. Lett. 18:2253-2256.
Crossref
|
|
|
|
|
Kurukulasuriya P, Mendelsohn R (2007a). A Ricardian analysis of the impact of climate change on African cropland. World Bank Policy Res. Work. P. 4305.
Crossref
|
|
|
|
|
Kurukulasuriya P, Mendelsohn R (2007b). Endogenous irrigation: The impact of climate change on farmers in Africa. World Bank Policy Res. Work P. 4278.
|
|
|
|
|
Kurukulasuriya P, Mendelsohn R (2008). Crop switching as a strategy for adapting to climate change. Afr. J. Agric. Res. Econ. 2:105-126.
|
|
|
|
|
McCarthy N (2014). Climate-Smart Agriculture in Latin America: Drawing on Research to Incorporate Technologies to Adapt to Climate Change. Inter-American Development Bank, Technical Note No. IDB-TN-652.
|
|
|
|
|
Magrin G, García CG, Choque DC, Giménez JC, Moreno AR, Nagy GJ, Nobre C, Villamizar A (2007). Latin America. In: Parry ML, Canziani OF, Palutikof JP, van der Linden PJ and Hanson CE (eds), Climate Change 2007: Impacts, Adaptation, and Vulnerability–Contribution of Working Group II to the Fourth Assessment Report of the Intergovernmental Panel on Climate Change. Cambridge: Cambridge University Press, pp. 581-615.
|
|
|
|
|
Massetti E, Mendelsohn R (2011a). Estimating Ricardian models with panel data, Climate Change Econ. 2:301-319.
Crossref
|
|
|
|
|
Massetti E, Mendelsohn R (2011b). The Impact of Climate Change on US Agriculture: A Repeated Cross-Sectional Ricardian Analysis. In: Dinar A, Mendelsohn R (eds.). Handbook on Climate Change and Agriculture. Edward Elgar Publishing.
Crossref
|
|
|
|
|
McGrath JM, Lobell DB (2013). Regional disparities in the CO2 fertilization effect and implications for crop yields. Environ. Res. Lett. 8:1-9.
Crossref
|
|
|
|
|
Mendelsohn R (2007). Chapter 60 past climate change impacts on agriculture. In: Evenson R, Pingali P (eds.). Handbook of Agricultural Economics. Elsevier.
Crossref
|
|
|
|
|
Mendelsohn R (2009). The impact of climate change on agriculture in developing countries. J. Nat. Resour. Pol. Res. 1:5-19.
Crossref
|
|
|
|
|
Mendelsohn R, Dinar A (2003). Climate, water, and agriculture. Land Econ. 79(3):328-341.
Crossref
|
|
|
|
|
Mendelsohn R, Dinar A (2009). Climate change and agriculture: an economic analysis of global impacts, adaptation and distributional effects. Edward Elgar Publishing.
Crossref
|
|
|
|
|
Mendelsohn R, Williams L (2004). Comparing forecasts of the global impacts of climate change. Mitig. Adapt. Strategies Glob. Change 9:315-333.
Crossref
|
|
|
|
|
Mendelsohn R, Seo N (2007b). Changing farm types and irrigation as an adaptation to climate change in Latin American agriculture. World Bank Policy Res. Work P. 4161.
Crossref
|
|
|
|
|
Mendelsohn R, Nordhaus W (1996). The Impact of Global Warming on Agriculture: Reply. The Am. Econ. Rev. 86:1312-1315.
|
|
|
|
|
Mendelsohn R, Nordhaus W (1999). The Impact of Global Warming on Agriculture: A Ricardian Analysis: Reply. Am. Econ. Rev. 89:1053-1055.
Crossref
|
|
|
|
|
Mendelsohn R, Dinar A, Sanghi A (2001). The effect of development on the climate sensitivity of agriculture. Environ. Dev. Econ. 6:85-101.
Crossref
|
|
|
|
|
Mendelsohn R, Massetti E, Kim GC (2011). The impact of climate change on US agriculture. J. Rural Dev. 34:19-43.
|
|
|
|
|
Mendelsohn R, Arellano J, Christensen P (2010). A Ricardian analysis of Mexican farms. Environ. Dev. Econ. 15:153-171.
Crossref
|
|
|
|
|
Mendelsohn R, Morrison W, Schlesinger ME, Andronova NG (2000). Country-Specific Market Impacts of Climate Change. Clim. Ch. 45:553-569.
Crossref
|
|
|
|
|
Mendelsohn R, Nordhaus W, Shaw D (1994). The Impact of Global Warming on Agriculture: A Ricardian Analysis, The Am. Econ. Rev. 84:753-771.
|
|
|
|
|
Mendelsohn R, Nordhaus W, Shaw D (1996). Climate impacts on aggregate farm value: Accounting for adaptation. Agric. For. Meteorol. 80:55-66.
Crossref
|
|
|
|
|
Mendelsohn R, Nordhaus W, Shaw D (2004). The Impact of Climate variation on US agriculture. En Mendelsohn R, Neumman JE (eds.). The Impact of Climate Change on the United States Economy. Cambridge University Press.
|
|
|
|
|
Mendelsohn R, Días AF, Seo SN (2007a). Proyecto: incorporación del cambio climático a las estrategias de desarrollo rural: Síntesis de los resultados en América Latina. Montevideo: PROCISUR/IICA.
|
|
|
|
|
Mendelsohn R, Basist A, Kurukulasuriya P, Dinar A (2007b). Climate and rural income. Clim. Ch. 81:101-118.
Crossref
|
|
|
|
|
Mendelsohn R, Kurukulasuriya P, Basist A, Kogan F, Williams C (2007c). Climate analysis with satellite versus weather station data. Clim. Ch. 81:71-83.
Crossref
|
|
|
|
|
Mendelsohn R, Basist A, Dinar A, Kurukulasuriya P, Williams C (2007d). What explains agricultural performance: Climate normals or climate variance?. Clim. Ch. 81:85-99.
Crossref
|
|
|
|
|
Muller C, Bondeau A, Popp A, Waha K, Fader M (2010). Climate change impacts on agricultural yields. Background note to the World Development Report 2010. Potsdam Institute for Climate Impact Research (PIK).
|
|
|
|
|
Polsky C (2004). Putting Space and Time in Ricardian Climate Change Impact Studies: Agriculture in the U.S. Great Plains, 1969-1992. Ann. Assoc. Am. Geogr. 94:549-564.
Crossref
|
|
|
|
|
Quiggin J, Horowitz JK (1999). The Impact of Global Warming on Agriculture: A Ricardian Analysis: Comment. Am. Econ. Rev. 89:1049-1052.
Crossref
|
|
|
|
|
Quiggin J, Horowitz JK (2003). Costs of adjustment to climate change. Aust. J. Agric. Resour. Econ. 47:429-446.
Crossref
|
|
|
|
|
Reddy KR, Hodges HF, McKinion JM (1997). Crop Modeling and Applications: A Cotton example. Adv. Agron. 59:225-290.
Crossref
|
|
|
|
|
Reidsma P, Ewert F, Oude A, Leemans R (2010). Adaptation to climate change and climate variability in European agriculture: The importance of farm level responses. Eur. J. Agron. 32:91-102.
Crossref
|
|
|
|
|
Reilly J, Baethgen WE, Chege FE, Van de Vijver CADM, Erda L, Iglesias A, Kenny G, Patterson, Rogasik J, Rötter RP, Rosenzweig C, Sombroek W, Westbrook J, Bachelet D, Brklacich M, Dämmgen U, Howden SM, Joyce RJV, Lingren PD, Schimmelpfennig D, Singh U, Sirotenko O, Wheaton E (1996). Agriculture in a changing climate: Impacts and adaptation. In: Watson RT, Zinyowera MC and Moss RH (eds.). Climate change 1995; impacts, adaptations and mitigation of climate change: Scientific-technical analyses. Cambridge (UK), Cambridge University Press.
|
|
|
|
|
Sanghi A, Mendelsohn R (2008). The impacts of global warming on farmers in Brazil and India. Glob. Environ. Ch. 18:655-665.
Crossref
|
|
|
|
|
Schlenker W, Roberts MJ (2006). Nonlinear effects of weather on corn yields. Appl. Econ. Perspect Policy 28:391-398.
Crossref
|
|
|
|
|
Schlenker W, Roberts MJ (2009). Nonlinear precipitation effects indicate severe damages to U.S. crop yields under climate change. Proc. Natl. Acad. Sci. 106:15594-15598.
Crossref
|
|
|
|
|
Schlenker W, Hanemann WM, Fisher AC (2005). Will U.S. Agriculture Really Benefit from Global Warming? Accounting for Irrigation in the Hedonic Approach. Am. Econ. Rev. 95:395-406.
CrossRef
|
|
|
|
|
Schlenker W, Hanemann WM, Fisher AC (2006). The impact of global warming on U.S. agriculture: an econometric analysis of optimal growing conditions. Rev. Econ. Stat. 88:113-125.
Crossref
|
|
|
|
|
Schlenker W, Hanemann WM and Fisher AC (2007). Water availability, degree days, and the potential impact of climate change on irrigated agriculture in California. Clim. Ch. 81:19-38.
Crossref
|
|
|
|
|
Seo SN (2010). A microeconometric analysis of adapting portfolios to climate change: Adoption of agricultural systems in Latin America. Appl. Econ. Perspect. Policy 32:489-514.
Crossref
|
|
|
|
|
Seo SN (2011). An analysis of public adaptation to climate change using agricultural water schemes in South America. Ecol. Econ. 70:825-834.
CrossRef
|
|
|
|
|
Seo SN, Mendelsohn R (2008a). A Structural Ricardian Analysis of Climate Change Impacts and Adaptations in African Agriculture. World Bank Publications.
Crossref
|
|
|
|
|
Seo SN, Mendelsohn R (2008b). Climate change impacts on Latin American farmland values: The role of farm type. Rev. Econ. Agroneg. 6:159-176.
|
|
|
|
|
Seo SN, Mendelsohn R (2008c). A Ricardian analysis of the impact of climate change on South American farms. Chil. J. Agric. Res. 68:69-79.
|
|
|
|
|
Seo SN, Mendelsohn R (2008d). Measuring impacts and adaptations to climate change: A structural Ricardian model of African livestock management. Agric. Econ. 38:151-165.
Crossref
|
|
|
|
|
Seo SN, Mendelsohn R, Dinar A, Hassan R, Kurukulasuriya P (2009). A Ricardian analysis of the distribution of climate change impacts on agriculture across agro-ecological zones in Africa. Environ. Resour. Econ. 43:313-332.
Crossref
|
|
|
|
|
Timmins C (2006). Endogenous land use and the ricardian valuation of climate change. Environ. Resour. Econ. 33:119-142.
Crossref
|
|
|
|
|
Wang, J, Mendelsohn R, Dinar A, Huang J, Rozelle S, Zhang L (2009). The impact of climate change on China's agriculture. Agric. Econ. 40:327-337.
|
|
|
|
|
Ziska HL (2011). Chapter 2: Climate Change, Carbon Dioxide and Global Crop Production: Food Security and Uncertainty. In: Dinar A, Mendelsohn R (eds.). Handbook on Climate Change and Agriculture. Edward Elgar Publishing.
Crossref
|
|