Full Length Research Paper
ABSTRACT
This study employed the input-oriented DEA approach with variable returns to scale assumption to assess the technical, scale, allocative and economic efficiencies of 124 randomly selected tomato farmers under irrigation in the Upper East Region using data of the 2017/2018 production season. The mean technical efficiency and scale efficiency were 97.1 and 97% respectively with many farmers experiencing increasing returns to scale. The mean allocative and economic efficiencies were 42.1 and 41.5% respectively. Farmer’s age, tomato land size, fuel quantity, fertilizer quantity and chemical quantity (herbicide and pesticide) were all significant determinants of technical efficiency scores whereas extension visit, tomato land size and chemical quantity significantly influenced both allocative and economic efficiencies. It is recommended that agro-inputs and fuel usage for tomato farmers under irrigation in the dry season be increased to improve technical efficiency. It is also recommended that extension education to farmers on effective inputs allocation and cost minimization strategies be intensified.
Key words: Allocative, economic and technical efficiency, data envelopment analysis, Tobit regression, tomatoes, Upper East Region of Ghana
INTRODUCTION
The crops sub-sector of Ghana forms a key component of the agricultural sector, holding a larger share of agricultural GDP of the country with annual growth of 9.4% in 2017 (Ministry of Food and Agriculture - MoFA, 2018). Tomato (Solanum lycopersicum) production which is one of the prominent farming and major activities in the country falls within the crop sub-sector. Tomato (S. lycopersicum) is a major and important vegetable which forms vital ingredient in almost every one’s diet in Ghana.
Ghana has a comparative advantage in the production of tomatoes in large scale for domestic consumption and export. This is as a result of the favourable environmental conditions that support the growth of the crop. Although reports on tomato yield in recent times indicate an increasing output levels, the average yield of the crop is still 7.2 metric tonnes per hectare, which is far below the potential yield of 15.0 metric tonnes per hectare. This therefore leaves farmers with a yield gap of about 7.8 metric tonnes per hectare (MoFA, 2013). In effect Ghana imports tomatoes from neighbouring Burkina Faso to supplement domestic consumption. Ghana Business News [GBN] (2018) reported that Ghana imports over $99.5m worth of tomatoes every year from Burkina Faso.
Tomato production is a major business of the people of the Upper East Region of Ghana especially during the dry season where the crop is grown under irrigation. This form of production is a source of livelihood to many farmers and market women living close to water sources. In their view, Sugri et al. (2013) noted that tomato production in the Upper East Region could be an important tool for tackling the widespread unemployment and poverty for the majority of households and for preventing the rampant rural – urban migration. This potential is however in limbo since the sector experiences erratic production trends according to Puozaa (2015), due mainly to higher inputs cost especially in irrigated systems. It has been established that although the cost of production of tomatoes is generally high in Ghana as compared to other countries, Upper East Region is ranked highest in terms of tomato production cost relative to other regions of the country (Robinson and Kolavalli, 2010). Kalinga (2014) indicated that farmers’ inability to combine with precision, improved inputs such as seeds and appropriate technologies like recommended rate of chemicals including fertilizer, pesticides and herbicide application lead to economic inefficiency. It is imperative therefore that to comprehensively and effectively inform policy decisions on lower tomato productivity, the levels of and factors that explain inputs usage and cost efficiencies in the frame of high cost of tomato production in the region must be understood. Several studies have been carried out to estimate and explain efficiency of smallholder farmers in many developing and developed economies using the data envelopment analysis (DEA) or the stochastic frontier modelling (SFM) approaches. Using the SFM, Weldegiorgis et al. (2018) studied farmers producing tomato under irrigation in northern Ethiopia and reported average levels of technical and economic efficiency of the tomato farmers as 0.75 and 0.67, respectively. They concluded that farmers were technically inefficient in using labour and seed inputs and were not cost efficient in using land, labour, seed, and fertilizer inputs. The study further revealed that the degree of education, experience in tomato production, and application of pesticides were variables that affected technical and economic efficiencies positively. Singh and Kumar (2014) used the DEA to estimate the farm level efficiencies of crop production and indicated that the overall technical efficiency scores were 0.75 and 0.73 for wheat and bajra respectively leading to 25 and 27% inefficiencies in the production of the two crops. According to Yusuf and Malomo (2007), a mean technical efficiency of 0.873 was recorded when they analyzed the technical efficiency of poultry egg production in Ogun State in Nigeria with the DEA. In their study, farmer experience and household size were significant determinants of technical efficiency. Through the DEA approach, Galluzzo (2018) reported that the highest level of economic efficiency of 100% was recorded among Irish farms with dairy farms having the modest levels of economic efficiency close to 77%. Mburu et al. (2014) reported technical, allocative, and economic efficiency scores of small scale wheat farmers as 85, 96, and 84% respectively with number of years of formal education, distance to extension advice and the size of farm strongly influencing the efficiency levels of wheat farmers in Kenya. Dogan et al. (2018) recorded mean technical and economic efficiencies of 98.7 and 88.7% respectively with only 17.9% of laying hen farms being fully efficient. They observed that farmer educational level and capacity utilization ratio had positive effect on technical efficiency.
In Ghana, Abdulai et al. (2018) reported that maize farmers in Northern Ghana had a mean technical efficiency of 77% and production exhibited increasing return to scale. Agricultural mechanization and farmers’ level of formal education did not show positive relationship to technical efficiency but agricultural extension influenced technical efficiency positively. Average technical and scale efficiencies of 77.26 and 94.21% were respectively recorded among farm households in the study of Abatania et al. (2012). They indicated that hired labour, geographical location of farms, gender and age of household head significantly affected technical efficiency of the farm households. Abunyuwah et al. (2019) assessed technical efficiency of carrot production in Mampong Municipality of Ghana and found out that labour and fuel used in irrigation significantly and positively influenced output levels of carrot. Socioeconomic characteristics of farmers such as farm size, access to credit, household labour, age and years of education were also significant determinants of technical inefficiency. On tomato production in Ghana, and in the Upper East region in particular, very limited research has comprehensively focused on efficiency of tomato production especially technical, allocative, scale and economic efficiencies of the farmers. Puozaa (2015) and Ayerh (2015) worked on allocative and technical efficiencies of tomato production respectively. This leaves a dearth of information and limited empirical findings for policy recommendations. This paper seeks to estimate the technical, scale, allocative and economic efficiencies of tomato farmers in selected irrigated farms in upper east region; and to explain farming and socio-economic factors that influence production efficiencies using Tobit regression and input-oriented DEA.
MATERIALS AND METHODS
Study area
The study was conducted in the Upper East Region of Ghana. The region has a total land area of 8,842 square kilometres, with a unimodal rainfall pattern, which is erratic in nature. The raining season falls between May/June and September/October with the mean annual rainfall of 800 mm to 1100 mm (GSS, 2013). It lies between longitude 0° and 1° West, and latitudes 10° 30′N and 11°N.
The Upper East Region is largely agrarian and has two major irrigation schemes which aid cultivation of vegetables such as tomatoes in the dry season (from November to April). In addition, there are 172 dams and dugouts scattered over the region (MOFA, 2013) which contribute immensely to crop production.
Theoretical concept of data envelopment analysis (DEA) models
The DEA model was used to analyse the various efficiency measures of the tomato farmers in the Upper East Region. The DEA is a non-parametric mathematical linear programming method used for the measurement of efficiencies of firms (Coelli, 1996). The purpose of DEA is to get a production frontier formed by enveloping the inputs and outputs of the most efficient enterprises that can be compared with those regarded as having the best production frontier. The use of the DEA procedure is advantageous in the sense that it simultaneously measures technical, allocative, cost and scale efficiency scores (Dao, 2013) and this can allow for the assessment of the performance of each decision making unit (DMU) with regards to each of these efficiency measures. The DEA provides efficiency scores of values in a range of zero and one with firms that are most efficient assuming the value of one whereas inefficient firms have values of efficiency less than one ( Dogan et al., 2018; Dao, 2013).
The DEA has two main approaches based on whether efficiency is measured in input or output dimensions. The input based approach attempts to measure the performance of a decision making unit in terms of its ability to minimize input quantities and still achieve the same level of output while the output –oriented approach considers the ability of firms to maximize output from a given set of inputs (Fare et al., 1994; Coelli et al., 2005). The choice of the input or output oriented approaches largely depends on which of the quantities the decision maker has control and can regulate (Coelli et al., 2005).
The input-oriented model is widely adapted in studying efficiency of agricultural firms because of the ability to regulate the usage level of inputs rather than having control over output quantities. In view of this, the study used the input – oriented approach to assess the efficiencies of tomato farmers in the Upper East Region of the country. In recent times, several studies have adopted this approach especially in analysis of agriculture efficiency (Dogan et al., 2018; Mburu et al., 2014; Yusuf and Malomo, 2007).
In DEA analysis, Charnes et al. (1978) initially proposed a model that had the assumption of constant returns to scale (CRS) which was later extended by Banker et al. (1984) who proposed a DEA with the assumption of variable returns to scale (VRS). In agricultural production system, an increase in inputs in the production system may not generally result in proportional increase in the output of the firm and therefore the variable returns to scale (VRS) was considered appropriate for this paper.
Model specification and structure
In this study, the DEA was estimated using input-oriented approach with an assumption of imperfect competition existing among the selected tomato farmers and as such their inability to operate at optimal scale (Dogan et al., 2018). The model was assumed to have variable returns to scale due to the fact that tomato producers may not be operating at optimum because of inputs and financial constraints (Banker et al., 1984).
Under variable returns to scale (VRS), it is assumed that there are i farmers using N inputs and producing M outputs, where the ith farmer can be represented by the vectors  . Due to the assumption that the tomato producers are not operating at optimal scale, the convexity constraint,
  was introduced to relax the CRS assumption. Using DEA with the assumption of variable return to scale to determine the efficiency of each farmer (θVRS), the following linear programming model was solved (Coelli, 1996).
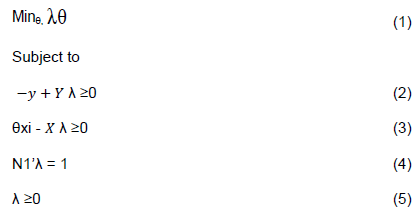
Where: N1 is an N×1 vector of ones, θ is a scalar,  forms part of the convexity constraint that efficiency scores are between 0 and 1.
The cost minimization model was estimated to help calculate the economic efficiency scores for the sampled tomato producers of the region. Similar to the above assumptions, the following mathematical model was used (Coelli et al., 2005)
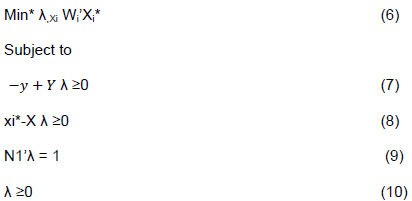
where: W is an N × 1 vector of input prices for the ith farm, Xi* is the cost minimizing vector of input quantities for the ith farm with the input prices, is an I × 1 vector of constraints. The DEAP version 2.1 software by Coelli (1996) was used in this study to analyse the technical, allocative, scale and economic efficiencies of the tomato farmers of the Upper East region of Ghana.
Tobit Regression of factors affecting efficiency scores
The factors that influenced efficiency scores of the farmers were investigated by regressing the socioeconomic factors of the individual farmers on their various efficiency scores. In efficiency studies, the DEA efficiency scores assume values between 0 and 1 thereby making the dependent variables ‘limited dependent’ or of a truncation below 0 and above 1. Such dependent variables require the application of models such as the Tobit model (Tobin, 1958). In this study, three models were estimated for the farmers which captured Technical Efficiency (TE), Allocative Efficiency (AE) and Economic Efficiency (EE). The Tobit regression models for this study were specified as follows
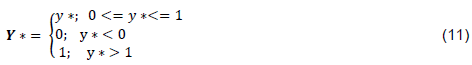
Where
y* is the DEA TE, AE, EE scores respectively, εi ~ that is, N(0, σ2)
y* represents an unobservable variable
β represents the vector of unknown parameters that establishes the relationship between the independent variables and the latent variable
xi is the vector of explanatory variables (socioeconomic factors).
εi is the disturbance term.
From the study of related literature of agricultural efficiency studies and the characteristics of tomato farmers in the Upper East Region, the following Tobit models for the various efficiencies were specified below.
TE = β0 + β1Gen + β2Age + β3EduF + β4EXTV + β5LandSize + β6FuelQ + β7FertQ + β8ChemQ + β9LAB + εi (12)
AE = β0 + β1Gen + β2Age + β3EduF + β4EXTV + β5LandSize + β6FuelQ + β7FertQ + β8ChemQ + β9LAB + εi (13)
EE = β0+ β1Gen + β2Age + β3EduF + β4EXTV + β5LandSize + β6FuelQ + β7FertQ + β8ChemQ + β9LAB + εi (14)
Where: TE = Technical Efficiency, AE = Allocative Efficiency, EE = Economic Efficiency, β0 = Constant, β1 – β9 represents coefficients of the selected factors that influence the various efficiencies. Gender was dummied with (Male = 1, Female = 0), Age = Age of farmer in years, EduF = Formal Education in years, EXTV = Extension visit received (dummy, Yes = 1, No = 0) LandSize = Land size of tomato farm in acres, FuelQ = Fuel quantity used for irrigation measured in litres, FertQ = Quantity of inorganic fertilizer in kilograms, LAB=Labour measured in man-hours and ChemQ = Quantity of inorganic chemicals made up of weedicides and insecticides measured in litres. The Tobit Model was estimated using STATA Version 15 (StataCorp, 2018).
Sampling technique and sample size
Multistage sampling technique was adopted to select respondents for this study: The first stage involved the purposive selection of the Upper East Region of Ghana. The region was selected for its prominence in irrigated tomato production. The second stage also used another purposive selection of four districts namely Talensi, Bolga Municipal, Bawku East and Kasena Nakana East for their production prominence and accessibility to irrigation facilities for irrigated tomato production in the region. The third and final stage was the random selection of a total of 124 tomato farmers for the study. The 124 was determined by taking a standard 25% of the estimated target population.
With the help of extension agents of each district, the sampling was done by listing tomato farmers using irrigation. Nineteen (19) farmers were selected from the Talensi district, 29 from the Bolga Municipality, 13 farmers were selected from the Kasena Nankana Municipality and finally 63 farmers were chosen from the Bawku West District.
Data and definition of variables
Primary data was collected for this study. This cross-sectional primary data was collected through the administration of a well-designed questionnaire. Data on inputs and output quantities as well as their respective prices for the 2017/2018 production season were collected for the study. Tomato output was measured in kilograms, tomatoes seed was measured as quantity in kilograms of either self-produced seeds or purchased seeds, tomato farm size was determined in acres, and quantity of fertilizer in kilograms used on only tomato farms was obtained. The total quantity of fuel in litres and labour were used as proxy for the inputs quantities that directly affected the efficiency of irrigation water used, since all the sampled farmers indicated that they had access to and supplied sufficient water to their crops. In this respect, water utilization efficiency is directly captured by the labour costs/hours and efficiency of water pumping machines defined by an amount of fuel used. Another input was the quantity of chemicals including weedicides and pesticides applied over the production period and lastly, labour was measured in man hours including family and hired labour. The cost efficiency component was estimated by including output quantities and input prices. Input prices were all measured in Ghana cedis and taken from the 2017/2018 production season.
RESULTS AND DISCUSSION
Descriptive statistics of variables used for the estimations
The descriptive statistics of the variables that were used in this study are presented in Table 1. The minimum age of the farmers was 17 with a mean age of about 38 years and a maximum of 71 years. The mean age of 38 years implies that the tomato farmers in the region are within the active working group. The results also indicate that some of the farmers had no formal education though the mean age of formal education in years was 5 years with some farmers having up to 17 years of formal education. The mean age of 5 years of formal education suggests that most of the farmers had only basic education level or no formal education at all. Household labour in man-hours recorded a mean of 3378.62 man-hours with 840 and 8400 as minimum and maximum household labour in man-hours respectively. The high number of man-hours of household labour could be an indication that most of the tomato farmers rely heavily on labour provided by household members to undertake their activities. This was not surprising because household members are involved in almost all activities of tomato production process.
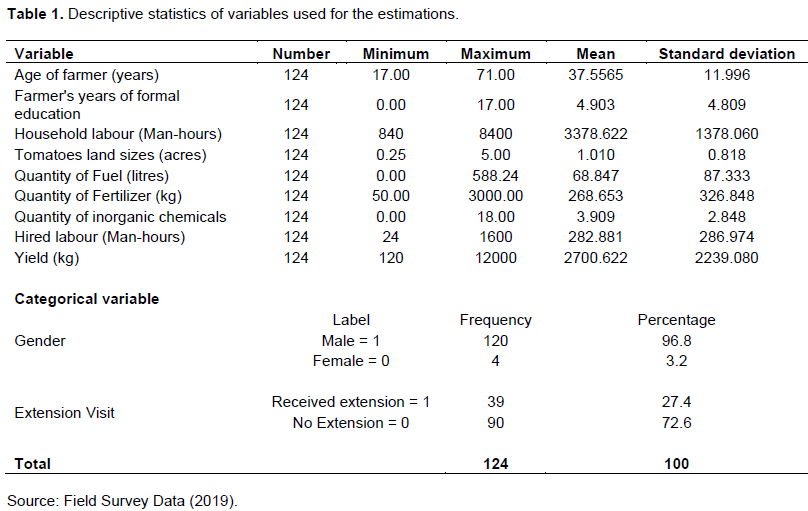
Tomato land size was in the range of 0.25 acres to 5 acres with a mean of about 1 acre. This probably implies that tomato farmers in the study area are predominantly smallholder farmers. Quantity of fuel used in powering water pumping machine recorded a mean value of 68.85 L and a maximum value of 588.24 L. Fertilizer usage in tomato production in the study area can be said to be intensive with as high as 3000 kg being the maximum and a minimum of 50 kg with at least a farmer applying 268.65 kg or about 5 bags to their farms. The continuous cropping on the same pieces of land implied loss of soil fertility and the need for intensive fertilizer usage. Inorganic chemicals comprising of weedicide and insecticide was not used extensively as some farmers reported not spraying at all whilst the mean inorganic chemicals in litres was about 4 L and a maximum of 18 L. This probably means that pest incidence in the study area is minimal. Hired labour denoted the labour that the farmers paid to undertake any production activity during the production season. The minimum hired-labour in man-hours was reported to be 24 man-hours while 1600 man-hours and 282.88 hours were recorded as the maximum and mean labour in man-hours respectively. The mean yield of tomatoes was 2700.622 kg while the minimum and maximum yields were 120 and 12000 kg respectively. This indicates that on average, the tomato yield for the 2017/2018 production season was moderate.
The categorical variables included in the Tobit model were gender and extension visit. From Table 1, men dominated the tomato farming business recording the highest percentage of 96.8% with only 3.2% being female farmers. The low female participation could be tied to issues of land tenure which favours men and probably the high capital requirements of farming under irrigation. It was revealed that an overwhelming percentage (72.6%) did not receive any extension visit during the production season although about 27.4% claimed that they had some extension visit during the production period.
Technical, allocative and economic efficiencies distribution of tomato farmers
The technical, allocative and economic efficiencies of the tomato farmers were analysed with the input-oriented DEA under the variable return to scale assumption. The results of the distribution of the technical efficiencies and descriptive summaries of the efficiency scores are presented in Table 2. These scores were organized into 7 groups ranging from >0.50 to 1.00. The mean technical efficiency was 0.97 indicating that the mean observed output of an average tomato farm was about 3% less than the maximum output that could be realized by the current inputs. This could be attributed to inefficiency in inputs management and other socioeconomic factors. Some of the farmers (n=39, 31.45%) were fully technically efficient with most (n= 80, 64.52%) clustered around technical efficiency scores of 0.90 – 0.99. High technical efficiency scores have also been observed in studies such as Yusuf and Malomo (2007), Mburu et al. (2014) and Dogan et al. (2018).
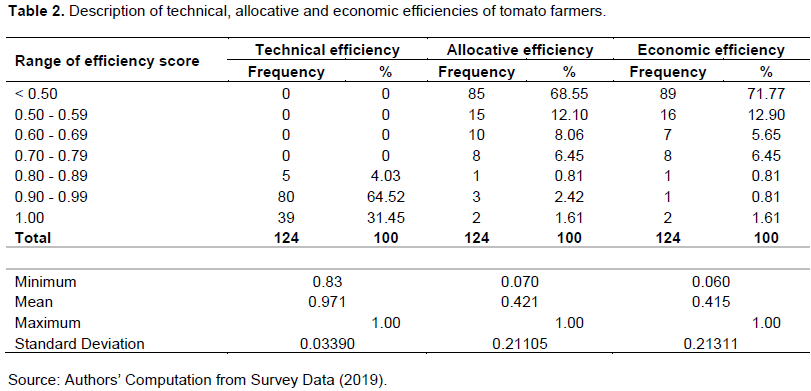
A mean allocative efficiency score of 0.421 was recorded in the study though some tomato farmers (1.61%) were fully efficient in inputs allocation with majority (68.55%) recording allocative efficiency scores of less than 50%. In all, only 31.45% of the farmers were allocatively efficient and obtained AE scores between 0.50 – 1.00. This implies that allocative efficiency could be increased by an average farmer [(1-0.421/1.00) × 100 = 57.9] by reducing cost of about 57.9% in order to achieve the level of the most allocatively efficient farmer. Low allocative efficiency score agrees with Musa et al. (2015) but contradicts that of Mburu et al. (2014) who had 96% of allocative efficiency in their study.
The economic efficiency followed a similar trend as the allocative efficiency with most of the farmers (71.77%) obtaining economic efficiency scores less than 50% and about only 28.23% managing to obtain economic efficiency scores between 50 - 100%. Although the maximum economic efficiency was 1.00, the mean efficiency score of 0.415 implies that on average, in order to be economically efficient, tomato farmers need to reduce their production cost by 58.5%. The efficiency score in this study relates to Musa et al. (2015) but contradicts those of Mburu et al. (2014), Dogan et al. (2018) and Galluzzo (2018). The results are presented in Table 2.
Scale efficiency of tomato production
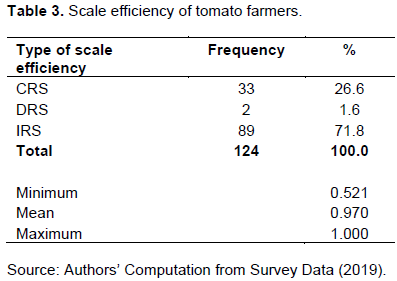
The mean scale efficiency of tomato farmers in the region was 0.97 in a range of 0.521 to 1.000. The mean scale score means that an average farmer is only about 3% scale inefficient. This is similar to Abatania et al. (2012) who recorded higher scale efficiency score among farmers in Northern Ghana. Majority of the farmers (71.8%) were experiencing increasing returns to scale (IRS) whilst 26.6% had constant return to scale (CRS) with some few (1.6%) encountering decreasing returns to scale (DRS). The mean scale and distribution of return to scale (RTS) reflect similar observation by Abdulai et al. (2018) in maize farmers of the three regions of the North. Table 3 presents the scale efficiency scores.
Factors affecting efficiency scores
The Tobit regression result of the determinants of the various efficiencies is presented in Table 4. There were five determinants that were significant in explaining the variation in Technical efficiency (TE) among the farmers. Age of farmer in years significantly reduced TE at 10% level of significance. Older farmers were less technically efficient than younger farmers and depicts that as a tomato farmer gets older, the less the technical efficiency. This is probably because older farmers are less likely to try and adopt new technologies. Tomato land size was highly significant (1%) and negatively related to TE scores. An increase in land size reduced technical efficiency of the farmer. Having larger farm size may affect the right proportion of inputs and these could affect technical efficiency. Fuel quantity and fertilizer quantity both positively influenced TE at 5 and 1% significant levels respectively. This means that farmers who irrigate their farms with pumping machines instead of manual supply of water were as expected more technically efficient. This might not imply allocative or economic efficiency, as our results on AE and EE indicate, though both coefficients of labour and fuel have insignificant values, their respective signs support the above assertion. Continuous cropping on these lands due to their proximity to the water source means that loss of soil fertility is very likely and hence farmer’s intensive application of fertilizers aimed at increasing yield. Litres of inorganic chemicals applied significantly (5%) reduced TE among the farmers probably due to the synergy between chemical applications and flowering. Though spraying is done to control pests, some inorganic pesticides are scorching and influence flower abortion thereby reducing yield and TE.
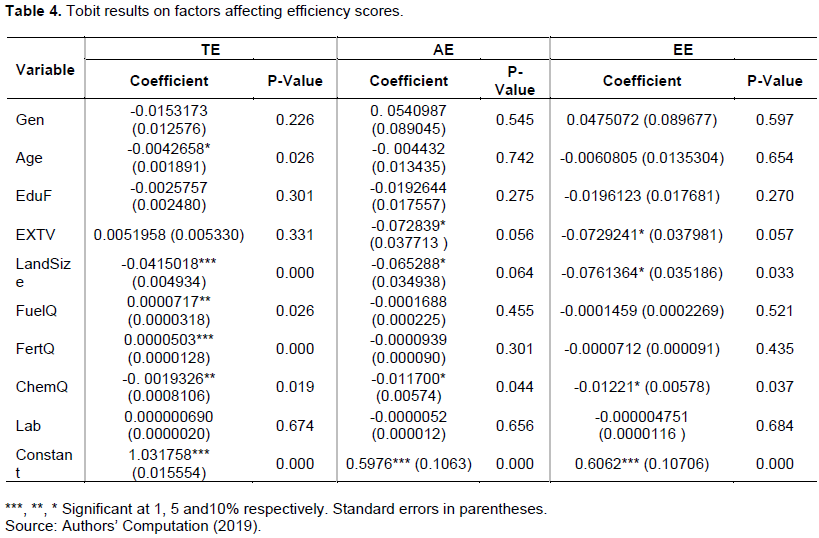
Extension visit, tomato land size and chemical quantity were all significant at 10% respectively and negatively influenced allocative efficiency (AE) of the tomato farmers. Contrary to expectation, farmers who received extension visit during the production season rather had reduced allocative efficiency. Probably these farmers were not given education on inputs allocation by these extension personnel. The findings relate to Musa et al. (2015) who also reported negative relationship between extension contact and allocative efficiency of maize producers. On the contrary, land size significantly increased the allocative efficiency, similar to that of wheat farmers as reported in Mburu et al. (2014).
Again, extension visit, tomato land size and chemical quantity were significantly and negatively related to farmers’ scores of economic efficiency (EE). Some farmers rent land and increasing the land size could increase cost and reduce EE of the farmer, as they could have used such monies for other inputs. Inorganic chemicals are costly and overusing chemicals especially when farmers disregard the appropriate spraying regime could lead to increasing cost of production thereby reducing economic efficiency. Similar findings have been reported in Mburu et al. (2014) and Musa et al. (2015). Results from the AE and EE models clearly indicate that farmers disproportionately spend on inputs supporting the relatively higher cost of producing tomatoes in the Upper East region of Ghana.
CONCLUSION AND RECOMMENDATIONS
Understanding socio-economic factors and farming practices that explain inputs combination and cost efficiencies is crucial for appropriate agricultural extension and input market policies. This study employed the input-oriented DEA with variable return to scale assumption to assess the technical, allocative and economic efficiencies of randomly selected tomato farmers of the Upper East Region using data of the 2017/2018 production season. The mean technical efficiency and scale efficiency were 97.1 and 97% respectively with many farmers experiencing increasing returns to scale. On the contrary, there were low allocative and economic efficiency scores among the farmers as the mean allocative and economic efficiencies were 42.1 and 41.5% respectively. These results imply that there are chances for tomato farmers to increase their current inputs and minimize cost of production without any compromise on tomato yield with the current available technologies.
Farmers’ age, tomato land size, fuel quantity, fertilizer quantity and chemical quantity (weedicide and pesticide) were all significant determinants of technical efficiency scores whereas extension visit, tomato land size and quantity of chemical used significantly influenced both allocative and economic efficiencies. It is recommended that government should extent subsidy on agro inputs and fuel for irrigated tomato farmers in the dry season to increase production and improve on technical efficiency.
Farmers are recommended to increase farm sizes to improve their scale efficiencies. Extension education should include allocation of inputs and cost minimization strategies to enable farmers achieve allocative and economic efficiencies in tomato production.
CONFLICT OF INTERESTS
The authors have not declared any conflict of interests.
REFERENCES
|
Abatania LN, Hailu A, Mugera AW (2012). Analysis of farm household technical efficiency in Northern Ghana using bootstrap DEA (No. 423-2016-27040). |
|
|
Abdulai S, Nkegbe PK, Donkoh SA (2018). Assessing the technical efficiency of maize production in northern Ghana: The data envelopment analysis approach. Cogent Food and Agriculture 4(1):1512390. |
|
|
Abunyuwah I, Yenibehit N, Ahiale ED (2019). Technical efficiency of carrot production in the Asante-Mampong municipality using stochastic frontier analysis. Journal of Agriculture and Environmental Sciences 8:2. |
|
|
Ayerh F (2015). Technical efficiency of tomato farmers in the Ashanti region of Ghana. Doctoral dissertation,University of Ghana, Legon |
|
|
Banker RD, Charnes A, Cooper WW (1984). Some models for estimating technical and scale inefficiencies in data envelopment analysis. Management Science 30(9):1078-1092. |
|
|
Charnes A, Cooper WW, Rhodes E (1978). Measuring the efficiency of decision making units. European Journal of Operational Research 2(6):429-444. |
|
|
Coelli T (1996). A guide to DEAP version 2.1. A Data Envelopment Analysis (Computer) program, Centre for Efficiency and Productivity Analysis, Department of Economics, University of New England, Armidale, NSW. P. 2351. |
|
|
Coelli TJ, Rao DSP, O'Donnell CJ, Battese GE (2005). An introduction to efficiency and productivity analysis. Springer Science and Business Media. |
|
|
Dao GTN (2013). An Analysis of the technical efficiency of crop farms in the Northern Region of Vietnam. Canberra: University of Canberra. |
|
|
Dogan N, Kaygisiz F, Altinel A (2018). Technical and Economic Efficiency of Laying Hen Farms in Konya, Turkey. Brazilian Journal of Poultry Science 20(2):263-272. |
|
|
Fare R, Färe R, Fèare R, Grosskopf S, Lovell CK (1994). Production frontiers. Cambridge: University Press. |
|
|
Galluzzo N (2018). Analysis of Economic Efficiency in Some Irish Farms Using the DEA Approach. Turkish Journal of Agriculture-Food Science and Technology 6(2):156-162. |
|
|
Ghana Business News [GBN] (2018). Ghana imports $99.5m worth of tomatoes every year from Burkina Faso. GBN. |
|
|
Ghana Statistical Service (GSS) (2013). 2010 Population and housing census: Regional analytical report Upper East Region. Accra, Ghana. GSS. |
|
|
Kalinga A (2014). Input use efficiency in the Madibira smallholder farmers' irrigation scheme in Tanzania (Doctoral dissertation, Sokoine University of Agriculture). |
|
|
Mburu S, Ackello-Ogutu C, Mulwa R (2014). Analysis of economic efficiency and farm size: A case study of wheat farmers in Nakuru District, Kenya. Economics Research International |
|
|
Ministry of Food and Agriculture (MoFA) (2013). Agriculture in Ghana: Facts and Figures. Accra: Ghana. MoFA. |
|
|
Ministry of Food and Agriculture (MOFA) (2018). Agriculture Sector Progress Report, 2017. Accra: Ghana. MoFA. |
|
|
Musa HA, Lemma Z, Endrias G (2015). Measuring technical, economic and allocative efficiency of maize production in subsistence farming: Evidence from the Central Rift Valley of Ethiopia. APSTRACT: Applied Studies in Agribusiness and Commerce 9:63-74. |
|
|
Puozaa FZ (2015). Allocative efficiency of irrigated tomato production in the Upper East Region, Ghana (Doctoral Dissertation, University of Ghana). |
|
|
Robinson EJ, Kolavalli SL (2010). The case of tomato in Ghana: Productivity (No. 19). International Food Policy Research Institute (IFPRI). |
|
|
Singh DR, Kumar S (2014). Estimation of Farm Level Efficiencies in Crop Production: An Application of Data Envelopment Analysis. Markets, Trade and Institutions for Agricultural Development P 64. |
|
|
Sugri I, Sargent SA, Kusi F, Berry AD, Kanton RAL, Pelletier W (2013). Improving marketable quality of tomato: A simulation of shipping conditions in Ghana. American Journal of Experimental Agriculture 3(2):392-402. |
|
|
Tobin J (1958). Estimation of relationships for limited dependent variables. Econometrica: journal of the Econometric Society 24-36. |
|
|
Weldegiorgis LG, Mezgebo GK, Gebremariam HG, Kahsay ZA (2018). Resources use efficiency of irrigated tomato production of small-scale farmers. International Journal of Vegetable Science 24(5):456-465. |
|
|
Yusuf SA, Malomo O (2007). Technical efficiency of poultry egg production in Ogun state: a data envelopment analysis (DEA) approach. International Journal of Poultry Science 6(9):622-629. |
|
Copyright © 2024 Author(s) retain the copyright of this article.
This article is published under the terms of the Creative Commons Attribution License 4.0


