Full Length Research Paper
ABSTRACT
Hunger and undernourishment are the main challenges of today’s world. The objective of this study is to assess severity of household food insecurity and local coping strategies in the study area. Three-stage sampling technique was used to select sampled household in Analemmo woreda Hadiya Zone. A total of 200 households were selected by using systematic random sampling with proportional to population size. Both primary and secondary data were collected. Both descriptive and econometric models were used to analyze the collected data. Household calorie acquisition was employed to categorize into severely food secure and severely food in secure. For econometric analysis ordered probit model were used to identify determinates of severity of household food insecurity in the study area. The survey results show that severity food insecurity 36%, 18%, 13% and 33% food secure, mild, moderately and severely food insecure respectively. Thus, based on the results of ordered probit model agro-ecology of land, age and education level of household head, number of oxen, drought-tolerant seeds, soil and water conservation, credit amount, productive safety net program participation, access to climatic information, access to extension service and off-farm activities and non- farm activity determine severity of household food insecurity in study area. Different common coping strategies was used to cope food .It was recommended that government should provide productive saftent program participation, capacity building on age and educational level household head, providing climatic information for farmers, providing drought-tolerant seed, provision of veterinary service for oxen health, providing training on soil and water conservation.
Key words: Analemmo, coping strategies, food insecurity, ordered probit model.
INTRODUCTION
Undernourished people found in sub-Saharan Africa and Asia are one-third of the world’s population (Belachew, 2018). Food insecurity is inadequate or uncertain availability of nutritionally and safe foods for productive and healthy life (Keino et al., 2014). The world estimated that 815 million people live in hunger and one individual from ten individuals in the world has a chronic food security challenge. In African, 27.4% of the populations estimated to have chronic food security problem are four times more than any other continent in the world (Mustapha et al., 2018). Rural households in Ethiopia cope with this by cutting consumption, seasonal migration, eating wild plants and animals, engaging in daily labor both in rural and urban areas, selling cow dung and crop residues (Teklay et al., 2015). According to USAID (2018), in Ethiopia, 7.9 million people need to be helped with food immediately. In addition, food shortage is more likely found in the rural areas of Ethiopia, the highest being in Somali (25% of urban, 31% of rural), Southern Nation Nationality People Regional Rural (37%), Gambela (35%) and Amhara (26%) (World Bank, 2014; CARE, 2014). Food insecurity is an enduring and critical challenge in the Federal Democratic Republic of Ethiopia. The government implemented policies and programs relevant for food security and nutrition in Ethiopia include GTP 2010-2015, the agriculture sector policy and investment framework (PIF) and food security programs (2010-2014). In spite of this, repeated exposure to a wide range of hazards such as drought, floods, low level of farm technology and country vulnerable to climatic shocks have effect on agricultural productivity and food security status of HHs (WFP, 2014; FAO, 2016). In addition, in Ethiopia there are some things that can reduce food insecurity and poverty, but poverty and food insecurity remain the big challenge of the country. Over 30% of the population below the food poverty line, cannot afford the minimum caloric intake consumption below 2100 Kcal/AE/day for a healthy and active life (WFP, 2014).
Many of the studies were carried out to consider the determinants of food insecurity but fail to capture or identify the severity of food insecurity and its differences in different agro-ecology. This study was conducted to identify the determinants of severity of households’ food insecurity and how food security is different in agro-ecology. Adinew (2007)studied the determinants and coping strategies of households’ food insecurity: the case of Lemo Woreda, Hadiya Zone. He did not incorporate relevant variables such as agro-ecology of land, access to irrigation, soil and water conservation and non-farm income and did not consider the coping strategies index to examine how food insecure households mitigate food shortage. He did not incorporate the severity of food insecurity. Therefore, this study incorporated those important variables to determine food insecurity and severity of food insecurity.
Based on reports from the zone and Woreda Office of Agriculture (2018), the estimated food insecure household was 50 and 70% households were food insecure (HZADO, 2018; AWADO, 2018).Even if the government implements the PSNP and non-governmental organization helps to solve the problem, there would still be food insecurity problem in the study area. To the best of the researchers’ knowledge, no research has been conducted in Analemmo Woreda on severity of households’ food insecurity and coping strategies.
METHODOLOGY
Description of the study area
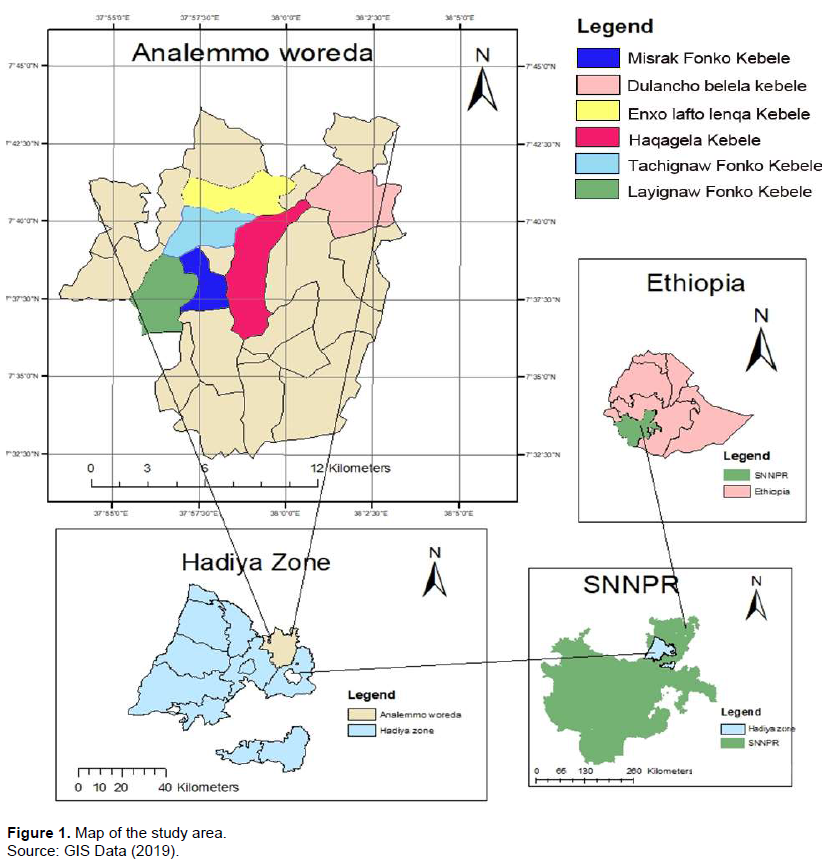
This study was conducted in Analemmo Woreda, Hadiya Zone; it is 214 km far from Addis Ababa, the capital city of Ethiopia. It has 27 rural kebeles and its altitude ranges from 1100 to 2500 m above sea level; the agro-climatic zone of Woreda is lowland, 40% kola and midland and 60% (Woina Dega). Mixed cropping system is mainly practiced in the Woreda. The main cereal crops are teff, barley, wheat, maize, sorghum, bean, and haricot bean produced in Meher season. The mean annual rainfall ranges from 1000 to 1400 mm and the mean annual temperature ranges from 15 to 20°C. The administrative map of Analemmo Woreda is presented in Figure 1. The emerald indicates the map of the SNNPRS (Southern Region) and sky-blue indicates the Hadiya zone. The taupe color indicates the map of the Analemmo Woreda, while the blue, pink, yellow, red, ruby, and green colors on the map of the study area indicate the location of the six kebeles sampled from lowland and midland agro-ecological zones of the study area.
Research design
The study is a cross-sectional survey research design. The data were collected using semi-structured interview. A total of 200 households were selected using a systematic sampling technique. Both qualitative and quantitative data were used in this study.
Sampling techniques and procedures
This study used a three-stage sampling technique. In the first stage, Analemmo Woreda was selected purposively due to drought and high level of food insecure households existing in the Woreda from the zone and high number of productive safety net program beneficiaries found more in the zone than Woreda. The total kebeles of the Woreda were stratified into 11 lowland and 16 midland based on the agro-ecological zone. In the second stage, from each stratum kebele, two kebeles were selected from lowland and four kebeles from midland using the simple random technique. In the third stage, a total of 200 households were selected using systematic random sampling with proportional to population size. The lists were taken from the sampled kebele administration office.
Data sources and collection methods
Both primary and secondary data which are qualitative and quantitative in nature were used. Primary data were collected from sample households through households’ head survey. Semi-structured questionnaire was used to collect the quantitative data to get first-hand information about food security severity and determinant of food insecurity. The qualitative data were collected from focus group discussion and key informant interview. Secondary data were collected from different published and unpublished documents used as sources of data.
Methods of data analysis
Households’ data on food consumed within seven days were converted into kilocalorie using national recommended kilocalorie (EHNRI, 2000). Households’ daily caloric intake per adult equivalent was calculated by dividing the households’ daily caloric intake by the family size after adjusting for adult equivalent using the consumption factor for age-sex categories (Smith and Subandoro, 2007). Households who consume below this minimum requirement (2100 kcal per adult equivalent per day) were categorized as food insecure and those households who consume above the threshold were considered as food secure. Coping strategy index (CSI) was formulated and local coping strategies adopted by the rural households were ranked by using the weighted mean score. The frequency of coping strategies requires the mean scores of relative frequency which measures how many days per week a household’s head relies on the various coping strategies; it was ranked on a four-point scale as 3, 2, 1, 0 for frequently, sometimes, rarely and never (Adebo and Falowo, 2015).

Where Ni=number of the households using a particular coping strategy and Xi= scoring order for frequency. The CSI was used in ranking order to reflect the comparative position of each of the coping strategy in terms of use. However, calculating the weighted mean score of households, we get:

where WMS=weighted mean score, Z=total number of households’ head, and I=individual coping strategies. Later the local strategies used to cope with food shortage in the study area were ranked.
Model specification
Dependent variables were the severity of households’ food insecurity in the study area. In this study, ordered probit model was used because the dependent variable is a categorical variable classified as food secure, mild food insecure, moderately food insecure and severely food insecure. Calorie intake greater than or equal to 2100 kilocalorie per adult equivalent per day is food secure encoded as “0”; calorie intake between 2100 and 1800 kilocalorie per adult equivalent per day is mild food insecure encoded as “1”; calorie intake between 1800 and 1500 kilocalorie per adult equivalent per day is moderately food insecure encoded as “2”, and calorie intake below 1500 kilocalorie per adult equivalent per day is severely food insecure encoded as “3” (Devereux, 2006).
Ordered probit is one among the maximum likelihood estimators which are appropriate to explain a variable in an ordered type of responses. This model is an extension of the binary probit model. Binary models usually throw away information as they lump responses together (Wooldridge, 2012). Multinomial logit and probit models neglect the data ordinarily; it requires estimation of more parameters. But, ordered response has the advantage of keeping data ordinarily, does not require more parameters and enables degrees of freedom (Kockelman and Kweon, 2002).
There is a continuous latent variable underlying the response variable. In associating the latent, there is a normal distribution of the error term. Here is the model specification:
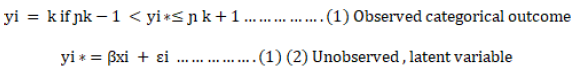
where k=0, 1, 2……….k and the categorical variable ɲ’s are the parameters (explanatory variables).
Hypothesis and operational definition of the study variable
The dependent variable in this study is the severity of households’ food insecurity. It is hypothesized as function of the following variables.
Age of household head (AHH): It is a continuous variable measured in years. As the ages of the households’ head increased, it is assumed that farmers can acquire more knowledge and experience easily and adopt modern technology. The aged households’ head can avert risk more and their chance to become more food secure increases (Adugna and Wagayehu, 2012; Shishay and Messay, 2014). It has a negative effect on the severity of households’ food insecurity.
Education of households’ head (EDUHH): It is a continuous variable measured by year of schooling. Educated households easily adopt modern technology for farming and are risk taker. They manage their farm better by adopting improved practices, which in turn increases total yield (Ermias, 2018). This study is expected to have a negative effect on the severity of households’ food insecurity.
Sex of households’ head (SEXHH): It is a dummy variable (that is 1 if it is female and 0 otherwise). Male headed households have more access to agricultural technologies and off-farm activity than the female headed households and also they diversify their income source (Teklay et al., 2015; Karale, 2015). In this study, it is expected to have a positive effect on severity of households’ food insecurity.
Family size of household head (FSHH): It is a continuous variable measured by adult equivalent that live and consume from the same household. An increase in household size implies more people to be fed from the limited resource (Mequanent and Esubalew, 2015; Ahmed et al., 2018). Large household size is negatively associated with food security. In this study, family size is expected to have a positive effect on severity of households’ food insecurity.
Agro-ecology of land (AGRECO): This is a dummy variable with value 0 assigned to lowland and 1 assigned to midland and agro-climatic zone household. Lowland agro-ecology is more likely to be food insecure relative to midland; the rural households in the midland produce enset potato and sweet potato that than adapt to drought or enest produced in the midland agro-ecology that resists disease (Abayineh and Belay, 2017). In this study, agro-ecology of land is expected to have a positive effect on severity of households’ food insecurity.
Number of oxen owned (TNO): It is a continuous variable measured in number in tropical livestock unit. Households’ head at slack periods carry out both farm and non-farm activities for their source of income when there is food shortage; the households sell oxen. Thus, the number of oxen available to the household increases the probability of the household being food secure (Hiwot, 2014;Mohammed, 2016;Ahmed et al., 2018). It is expected for it to have negative effect on the severity of households’ food insecurity.
Tropical livestock unit (TLU): It is a continuous variable measured. Households with large livestock size are less vulnerable to food insecurity (Mequanent and Esubalew, 2015). It is expected to have negative effect on the severity of households’ food insecurity.
Use of chemical fertilizer (UCF): It is a dummy variable having the value 1 if a farmer uses fertilizer and 0 if otherwise. Households’ heads that use chemical fertilizer have increased agricultural productivity by boosting overall production and contributing to attain food security (Shishay and Messay, 2014;Ahmed et al., 2018). It is expected to have negative effect on the severity of households’ food insecurity.
Drought-tolerant seeds (DRRESEED): It is a dummy variable with the value 1 if farmers use improved seeds and 0 if otherwise. A household’s head who uses improved seeds is expected to be more food secure than non-users (Abayineh and Belay, 2017). It is expected to have negative effect on the severity of households’ food insecurity.
Soil and water conservation measures (SWC): It is dummy variable with 1 value if a household is practicing soil and water conservation and 0 if otherwise. Techniques mitigate land degradation problem by maintaining soil fertility, which increases crop production and soil fertility. Erosion and soil degradation are constraints to food production. They cause soil acidity that leads to low production and food insecurity. Also it reduces land productivity (Mequanent and Esubalew, 2015; Abayineh and Belay, 2017). It is expected to have negative effect on the severity of households’ food insecurity.
Distance to nearest market (DISTMKT): It is a continuous variable measured by minute. Households close to the market center have a better chance to improve their income. Distance to market and food insecurity have a positive relationship (Ermias, 2018). It is expected to have negative effect on the severity of households’ food insecurity.
Credit Amount (CREDAMO): It is a continuous variable measured by birr. Credit is used for the purpose of consumption or acquisition of agricultural inputs like improved seed and chemical fertilizers. Thus, a household with access to credit does initiate investment in farm and non-farm activities and achieve food security (Fekadu and Mequanent, 2010). It is expected to have negative effect on the severity of households’ food insecurity.
Receiving remittance (REMAMO): It is a continuous variable. It is assumed that households that get financial support from migrant family members buy food from the market and it increases their access to food and buying of agricultural inputs (Zhou et al., 2019). It is expected to have negative effect on the severity of households’ food insecurity.
Participation in Productive safety net program (PSNP): It is a dummy variable with value 1 assigned as participating in the program and 0 if otherwise. Participation in safety net program is to protect asset depletion at the household level and create communal assets at the community level. Households who get opportunity to participate in the safety net program are more likely to obtain food and cash aid. It is expected to have negative effect on the severity of households’ food insecurity.
Access to climate information (CLMATE): It is a dummy variable with value 1 if households have access to climate information and 0 if otherwise. Farmers who have access to climate information have better intensity on food security, access drought-tolerant crop varieties, invest in soil conservation measures, use irrigation and diversify livelihood (Nhemachena and Hassan, 2007). It is expected to have negative effect on the severity of households’ food insecurity.
Size of cultivated land (CULLAND): Size of cultivated land is a continuous variable measured in hectare. Size of cultivated land increases the possibility that a household gets more output as it remains a basic resource for food production (Ahmed, 2015). It is expected to have negative effect on the severity of households’ food insecurity.
Access to irrigation (IRRIGA): It is a dummy variable coded with a numeric value of 1 if households have access to irrigation and 0 if otherwise. Households that use irrigation reduce the risk of crop failure and the increment in yields can be substantial if properly managed thus ensuring food security for the households (Karale, 2015). It is expected to have negative effect on the severity of households’ food insecurity.
Access to extension service (EXN): It is a dummy variable assigned the value 1 if households can access agricultural extension service and 0 if otherwise. Farmers well visited by farming training center agents are likely to improve their knowledge in using and managing their inputs compared to those who do not get the service. This can probably improve their products which can minimize the probability of being food insecure (Hana and Dereje, 2016). It is expected to have negative effect on the severity of households’ food insecurity.
Off-farm activities and non-farm activity (OFFANO): It is continuous variable measured in birr. Households’ heads that engage in gainful employment have higher income and greater chances of being food secure (Adugna and Wagayehu, 2012). It is expected to have negative effect on the severity of households’ food insecurity.
EMPIRICAL RESULTS AND DISCUSSION
Severity of households’ food insecurity in the study area
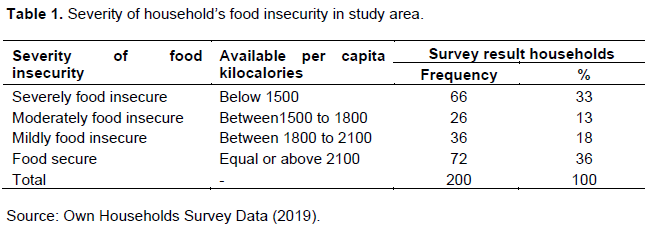
Accordingly, in Table 1 out of the 200 rural households, 66 (33%) have available per capita kilocalorie of less than 1500 kilocalorie per adult equivalent per day and are severely food insecure households (households at the hunger stage); 26 (13%) have available per capita kilocalorie of 1500 to 1800 Kcal and are severely moderately food insecure households (reduce their food consumption size); 36 (18%) of the sample households have kilocalorie between 1800 and 2100 Kcal and are severely mildly food insecure (feeding on less quality food); and 72 (36%) of the households have equal or greater than 2100 Kcal. This shows that they are severely food secure households. In general, 64% of the sampled households feed below the national recommended kilocalories and 36% of them feed according to the national recommended kilocalories in the study area.
Severity of household’s food insecurity in the study area
Econometric results of the determinants of severity of households’ food insecurity
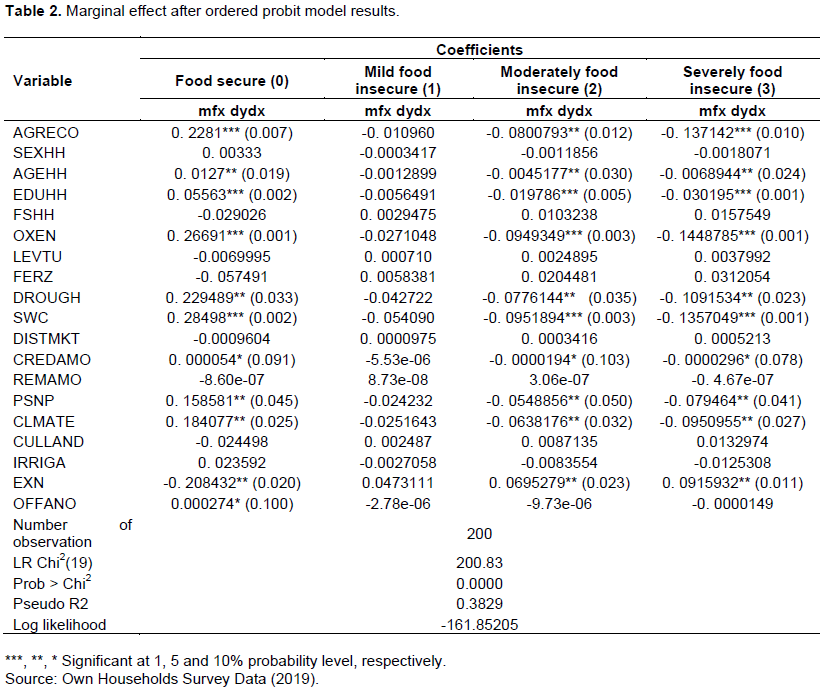
Ordered probit model was used to identify the determinants of severity of households’ food insecurity in the study area. The survey result indicates that from the nineteen variables, eleven variables are of statistical significance that affects the dependent variable with different significance level. Based on the summarized model result, explanations for each significant independent variable on dependent variables are given as follows with ten variables following the expected direction.
Agro-ecology (AGRECO): This variable is significant at less than 1% probability level in severely households’ food security; it has positive relationship with all other things being constant. The probability of being severely food secures increases by 22.8%, if the household’s head lives in midland. Also it is significant at less than 5% probability level and is negatively related with severely moderately food insecure, all other things being constant. The probability of being severely and moderately food insecure increases by 8%, if the household lives in lowland. It is also significantly less than 1% with severe food insecure, all other things being constant. The probability of being severely food insecure increases by 13.7%, if the household lives in low land. This result is in conformity with the study done by Abayineh and Belay (2017).
Age of households’ head (AGEHH): The model result shows that age of the households’ head has positive relationship with severely food security and is significant at less than 5% probability level, all other things being constant. The the probability of being severely food secure increases by 1.27%, if the household’s age increases in one year. Age of households’ head is significant at less than 5% and is negatively related with severely moderately food insecurity, all other things being constant. The probability of being severely and moderately food insecurity decreases by 0.45%, if the household’s head’s age increases in one year. Furthermore, it is significant with severely food insecure at less than 5% and has negative relationship, all other things being constant. The probability of being severely food insecure decreases by 0.68%, if the household’s age increases in one year. This result is in conformity with the study done byHiwot (2014).
Education level of households’ head (EDUHH): The model result indicates that it is significant at less than 1% probability level with severely food security, all other things bring constant. The education of households increases with one year schooling; the probability of being severely food secure is more likely to increase by 5.5%. In addition, it is significant at less than 1% with severely moderately food insecure, all other things being constant. One year increase in education level of households is associated with 1.9%; they are less likely to be severely and moderately food insecure. Also it is significant at less than 1% probability level with severely food insecure; as education level of households increases in one year with 3%, they are less likely to be severely food insecure. In general, as education level of households increases in one year of schooling, the households’ food insecurity decreases. This result is in conformity with the study done by Hiwot (2014) and Tagese and Berhanu (2015).
Number of ox/oxen owned (OXEN): This variable is significant at less than 1% probability level and has positive relationship with severely food secure, all other things being constant. The probability of being severely food secure increases by 26.6%, as the number of oxen increases by one. In addition, it is significant with less than 1% probability level and has negative relationship with severely moderately food insecure, all other things being constant. The probability of being severely moderately food insecurity decreases by 9.4% as the number of oxen increases by one. Furthermore, it is significant at less than 1% probability level and has negative relationship with severely food insecure, all other things being constant. The probability of being severely food insecure decreases by 14.4% as the number of oxen increases by one. This result is in conformity with the study done by Hiwot (2014) and Ahmed et al. (2018).
Drought-tolerant seeds (DRRESEED): The model results show that this variable is significant at less than 5% probability level and has positive relationship with severely food security, all other things being constant. The probability of being severely food secures increases by 22.9%, if the household uses drought-tolerant seeds for production. Also, it is significant at less than 5% probability level and has negative relation with severely moderately food insecure, all other things being constant. The probability of being severely and moderately food insecure increases by 7.7%, if the households do not use drought-tolerant crop for production. Furthermore, it is significant at less than 5% probability level and has negative relation with severely food insecure, all other things being constant. The probability of being severely food insecure increases by 10.9%, if the households do not use drought-tolerant seeds for production. In general, the households that use drought-tolerant seeds for production resist moisture content and drought during shortage of rainfall in the study area like enset, potato and sweet potato that resist drought condition and disease. In focus group discussion, the households that produce enset are more likely to be food secure than those household that do not produce drought-tolerant seeds. This model output is similar with the findings of Abayineh and Belay (2017).
Soil and water conservation (SWC): This variable is significant at less than 1% probability level and has positive relationship with severely food secure, all other things being constant. The probability of being severely food secures increases by 28.4%, if the households engage in soil and water conservation practice. Also, it is significant at less than 1% and negatively related with severely and moderately food insecure, all other things being constant. The probability of being severely and moderately food insecure increases by 9.55%, if the households practice soil and water conservation. In addition, it is significant at less than 1%. The probability of being severely food insecure increases by 13.5%, if the households do not practice soil and water conservation. This model output is similar with the finding of Mequanent and Esubalew (2015).
Credit amount (CREDAMO): According to the model output amount of credit is significant at less than 10%; it has positive relationship with severely food secure. Households that have access to credit buy agricultural inputs on time and they diversify their livelihood strategies to ensure their food security. All other things being constant, the probability of being severely food secure increases by 0.0054% as credit amount increases by one birr. In addition, it is significant at less than 10% and has negative relationship with severely and moderately food insecure, all other things being constant. The probability of being severely and moderately food insecure decreases by 0.0019% as credit amount increases by one birr. It is significant at less than 10% and has negative relationship with severely food insecure, all other things being constant. The probability of being severely food insecure decreases by 0.0029% as credit amount increases by one birr. This indicates that the access of credit reduces the severity of food insecurity of the household. This result is in conformity with the study done byHiwot (2014).
Productive safety net program participation (PSNP): It has a positive and significant relationship with severely food secure. It is significant at less than 5% probability level. The positive sign showed that, households that participate in productive safety net have more probability of becoming severely food secure than non-participants in PSNP. The possible explanation is that the program provides additional income for the households with which they purchase foods from the market when their stock is very low, thus ensuring food security and building of households’ asset. All other things being constant, the probability of households participating in productive safety net program increases by 15.8%. In addition, it is significant at less than 5% and has negative relationship with severely and moderately food insecure. The negative sign showed that, households with large income from safety net had more probability of becoming food secure than others, all other things being constant. The probability of being severely moderately food insecure increases by 5.6%, if the households do not participate in productive safety net program. Furthermore, it is significant at less than 5%. All other things being constant, the probability of being severely food insecure increases by 7.9%, if the households do not participate in productive safety net program. In general, the focus group discussion and key informants suggest that households that participate in productive safety program protect their assets at the household level and formulate fixed asset at the community level. In the study area, graduation from the productive safety net program was not based on the improvement of the households’ livelihood strategies, but based on the quota of the household and government intervention. This model output is similar with the finding of Teklay et al. (2015).
Access to climatic information (CLMATE): This variable is significant at less than 5% probability level and has positive relationship with severely food secure, all other things constant. The probability of being severely food secures increases by 18.4%, if the households have access to climate information. The positive relationship indicates that households are responsive to changes in the climatic condition through what is commonly called "response farming", where farmers change their cropping patterns based on the climatic condition they anticipate and observe, reducing the production risk of total crop failure and resisting the crop disease. Farmers who have access to climate information have a better intensity of food security and drought-tolerant crop varieties, invest in soil conservation measures, use irrigation and diversify their livelihood. Also, it is significant at less than 5% probability level and has negative relationship with severely and moderately food insecure, all other things being constant. The probability of being severely and moderately food insecure increases by 6.9%, if the households have no access to climate information. Furthermore, it is significant at less than 5% probability level and has negative relationship with severely food insecure all other things being constant. The probability of being severely food insecure increases by 9.5%, if the households have no access to climate information. This result is in conformity with the study done by Abayineh and Belay (2017).
Access to extension service (EXN): The model result shows that this variable is significant at less than 5% probability level and negatively affects severely food secure, which is in contrast to what is expected. The model output indicates that if households’ head have access to extension service, they would be less likely to be food secure by 20.8%, while holding all other independent factors constant. Also, it is significant at less than 5% with severely and moderately food insecure households. The model predicts that if households have access to extension service and all other things being constant, the probability of being severely and moderately food insecure would increase by 6.7%. In addition, it is significant at less 5% with severely food insecure households. The probability of being food insecurity increases by 9.1%, if the households have access to extension service. However, in the present study there is a negative relationship between access to extension services and food security. This model output is similar with the finding of Tekle and Berhanu (2015). This indicates that in study area that there is lack of awareness among the extension agent and lack of monitoring and evaluation of extension agent. In addition, in the study area most extension agents lack awareness to advice farmers; for example on how to disseminate improved seeds that do not match with the environment rather than using locally improved seeds.
Off-farm activities and non-farm activity (OFFANO): The model results indicate that this variable is significant at less than 10% probability level and has a positive relationship with severely food secure all other things being constant. The probability of being severely food secure increases by 0.027%, as income of households from off and non-farm income increases by one birr (Table 2). This model output is similar with the finding of Hiwot (2014).
Households’ food insecurity and local coping strategies
The coping strategies of the households’ food insecurity were measured on a four-point scale: frequently, sometimes, rarely and never used. Generally, about 11 different local coping strategies were very prominent among the available strategies employed. This study shows that relying on less preferred and less expensive food was ranked first in the coping strategy index (2.285) among the other coping strategies. The high rates of use of this strategy in the study area were linked to the high market price of basic foodstuffs (inflation of food price). The information from focus group discussions and key informant interview is that most rural households consume low quality food, that the available cash within the household can afford just to feed (Table 3).
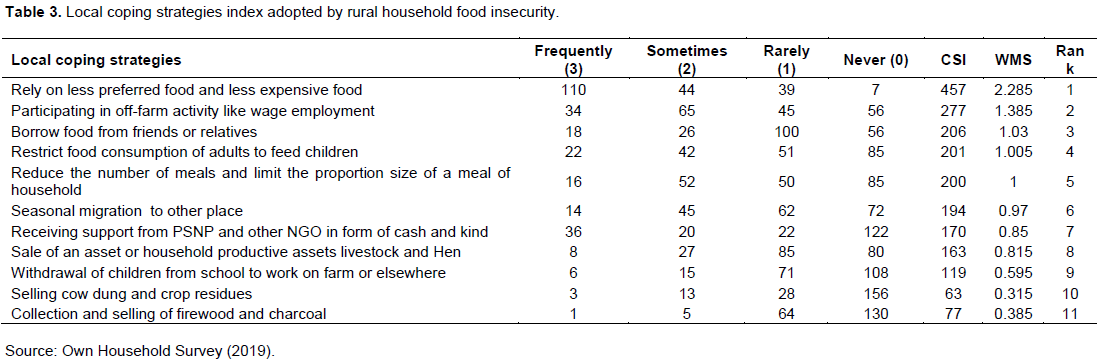
The second local strategy used to mitigate food shortage was participating in off-farm activity; its coping strategy index was 1.385. The most common off-farm activity in the study area was working to earn wages and rent land for household consumption. The third local coping strategies were to borrow food from friends or relatives; its coping strategy index was 1.03. In the study area, most rural households borrow food from relatives and friends at the time of food shortage.
The fourth local coping strategies were restricting food consumption of adults to feed children; its coping strategy index was 1.005. Restricting food consumption to feed children reduces the feeding and preparation of food for the adult age population, because the adult population work for the household and get their income from different from off-farm and non-farm activity. Reducing the amount of meals and proportion size is another coping strategy; its index was 1. According to focus group discussions and key informant interview, they reduce the preparation time and also amount of food prepared at their harvest decreases; for example the feeding times are reduced from three to two times in a day to feed the family. Seasonal migration to other places is another one; its coping strategy index was 0.97. Most rural households family migrates from rural to urban area in search of work to feed their family. Another coping strategy is receiving of support in cash and kind from PSNP and other NGO. The survey result shows that households that participate in the productive safety net program get their daily food, because they borrow cash from the organization. They sell household assets, livestock (0.815) and other productive asset during food shortage. Withdrawal of children from school is also a coping strategy; its index was 0.595. In the study area, most rural households search for daily work to feed their family; in this case their children do not go to school. From the focus group discussions and key informant interview, most food insecure households search for food using different coping strategies like doing the off-farm activity and migrating from rural to urban and withdrawal of their children from school.
CONCLUSIONS AND RECOMMENDATIONS
This study examines the determinants of severity of households’ head food insecurity in the study area. Food insecurity is a critical challenge for Ethiopian government.
More than half of the rural households were food insecure. The study revealed that severity of food insecure households is categoried into severely food insecure (33%), moderately food insecure (13%), mildly food insecure (18%) and 36% households were able to meet the daily standard calorie requirement. Using ordered probit model eleven significant determinants of severity of household food insecurity were found.
This study indicates that agro-ecology has significant and negative effect on severity of households’ food insecurity. The households who live in mid land agro-ecology are more food secure compared to low land agro-ecology. Households that live in mid land produce drought-tolerant seeds like enset and potato than households in low land; there was high population density in low land compared to mid land. Farmers in low land produce drought-tolerant seeds and access health extension agent; they should engage in family planning. Age and education of households’ head has significant and negative effect on severity of households’ food insecurity. As the age and education of households’ head increases there is more severe food secure. It is assumed that aged farmers can acquire more knowledge and experience easily as well as adopt modern technology. Therefore, government should develop capacity building for young households and give vocational training and adult education for illiterate farmers to adopt agricultural technology. Number of oxen owned has significant and negative effect on severity of households’ food insecurity. That means as the number of oxen increases, they will have more to sell during drought period to purchase food and agricultural input. Government should improve oxen health services through the provision of veterinary services for effective artificial insemination to up-grade the oxen production and productivity.
Drought-tolerant seeds and soil and water conservation have significant and negative relationship with severity of households’ food insecurity. Households that practice soil and water conservation and produce drought-tolerant seeds are more food secure. Government should train farmers to conserve water and soil to enhance sustainable development in agriculture by using different conservation method such as crop rotation, intercropping, mulching, using crop residue, soil bands and afforestation of plants to minimize soil acidity. Credit amount, participation in productive safety net program and off-farm activities and non-farm activity have significant and negative relationship with severity of households’ food insecurity. The households that have access to credit and participate in productive safety net program and off-farm and non-farm activity become severely food secure. Access to climate information has significant and negative effect on severity of households’ food insecurity.
Households that access climate information are more food secure. Government should distribute the information received from metrologies to farmers to develop time of production and harvesting. Access to extension service has significant and unexpected sign with severity of households’ food insecurity. The negative sign indicates the extension agent lack awareness in educating farmers and lack monitoring and evaluation of extension agent. Extension agent and expertise of the Woreda should check agricultural technology before applying it in the farmers’ land and they should check the farmers’ training center. Extension agent should demonstrate and visit site lagging behind in adopting (low adopters) new technology.
Finally, the local coping strategies practiced by most of the rural households to mitigate food shortage in the study area are by using coping strategies index, relying on less preferred food, participating in off-farm activity, borrowing food from friends or relatives, restricting food consumption of adults to feed children, reducing the number of meals and receiving support from Productive Safety Net program and other non-governmental organization.
CONFLICT OF INTERESTS
The authors have not declared any conflict of interests.
ACKNOWLEDGEMENT
The authors thank Arba Minch University for sponsoring this study.
REFERENCES
|
Abayineh A, Belay S (2017). Assessment of household food security in the face of climate change and variability in the upper Blue-Nile of Ethiopia. Doctoral dissertation, Addis Ababa University. |
|
|
Adebo GM, Falowo OO (2015). Rural household food security and Coping Strategies in South-West, Nigeria : A Gender Differentials Perspective. Food Science and Quality Management 41:44-50. |
|
|
Adinew L (2007). Determinants and coping strategies of household food insecurity: The Case of Rural Setting in Lemo Woreda, Hadiya Zone 67(6):14-21. |
|
|
Adugna E, Wagayehu B (2012). Causes of household food insecurity in Wolayta: Southern Ethiopia. Journal of Stored Products and Postharvest Research 3(3):35-48. |
|
|
Ahmed K, Jema H, Lemma Z (2018). Determinants of food insecurity and coping strategies of rural households: The case of Shalla District, West Arsi Zone, Oromia Region, Ethiopia. Journal of Development and Agricultural Economics 10(6):200-212. |
|
|
Ahmed M (2015). Determinants of household food security and coping strategies: The Case Of Bule-Hora District, Borana Zone, Oromia, Ethiopia. European Journal of Food Science and Technology (Vol. 3). |
|
|
AWADO (2018). Analemmo Woreda Agricultural Development Office. Annual Progressive Report of Analemmo Aricultural Development Office. Fonko: Unpublished. |
|
|
Belachew D (2018). Transitory coping strategies of food insecure smallholder farmer households: The Case of Ilu Gelan District, West Shoa Zone, Oromia Reginal State, Ethiopia. Agriculture and Food Security 7(1):70. |
|
|
CARE (2014). Achieving food and nutrition security in Ethiopia". Finding from the CARE Learning Tour to Ethiopia, January 19-24, 2014, CARE, Washington, DC. pp. 1-15. |
|
|
Devereux S (2006). Distinguishing between chronic and transitory food insecurity in emergency deeds assessments, institute of development Studies, Rome. Development pp. 0-40. |
|
|
Ermias G (2018). Empirical examination of the determinants of food insecurity among rural farm households: evidence from Kindo Didaye District of Southern Ethiopia. Business and Economics Journal 09(01):1-12. |
|
|
FAO (2016). El Niño response plan report 2016 in Ethiopia. pp. 0-21. |
|
|
Fekadu B, Mequanent M (2010). Determinants of food security among rural households of Central Ethiopia: An empirical analysis. Quarterly Journal of International Agriculture 49(4):299-318. |
|
|
Hana M, Dereje H (2016). Analysis of household food insecurity and its covariates in Girar Jarso Woreda, Oromia Regional State, Ethiopia. Journal of Economics and Sustainable Development 7(3):16-30. |
|
|
Hiwot Y (2014). Determinants of food security in rural farm households in Ethiopia. Master thesis, International Institute of Social Studies. |
|
|
Hadiya Zone Agricultural Development Office, HZADO (2018). Hadiya Zone Agricultural Development Office . Annual Progressive Report of Analemmo Aricultural Development Office. Fonko: Unpublished. |
|
|
Karale K (2015). Household food security status and its determinants in rural Konso Woreda, Segen Area Peoples' Zone, Southern Ethiopia. MSc Thesis, College of Agriculture, Hawassa University. |
|
|
Keino S, Plasqui G, Borne B (2014). Household food insecurity access: A predictor of overweight and underweight among Kenyan women. Agriculture and Food Security 3:2. |
|
|
Kockelman KM, Kweon YJ (2002). Driver injury severity: An application of ordered probit Models. Accident Analysis and Prevention 34:313-321. |
|
|
Mequanent M, Esubalew T (2015). Analysis of Household Level Determinants of Food Security in Jimma Zone, Ethiopia. Journal of Economics and Sustainable Development 6(9):230-241. |
|
|
Mohammed A (2016). Food Insecurity and copping Strategies of Agro Pastoral Households in Awbar Woreda, Ethiopian Somali Regional State. St. Mary's University. |
|
|
Mustapha M, Kamaruddin RB, Dewi S (2018). Assessing the food security determinants among rural households in Kano, Nigeria AJAERD, (October). |
|
|
Nhemachena C, Hassan R (2007). Micro-level analysis of farmers' adaptation to climate change in Southern Africa. International Food Policy Research Institute, Technical Report, (August). |
|
|
Shishay K, Messay M (2014). Determinants of rural household food insecurity in Laelay Maichew Woreda Tigray, Ethiopia. African Journal of Agriculture and Food Security 2(1):106-112. |
|
|
Smith LC, Subandoro A (2007). Measuring food security using household expenditure surveys. Food security in practice technical guide series. Washington, D.C.; International Food Policy Research Institute 147pp. |
|
|
Tagese A, Berhanu K (2015). Determinants of food security status of female-headed households: The case of Wolaita Sodo town, South Nations, Nationalities and Peoples Region, Ethiopia. International Journal of Scientific Footprints. |
|
|
Teklay N, Aynalem S, Nega A (2015). Determinants and coping strategies of household food insecurity evidence from Agro Pastoralists of Afar Region (Zone Two). Journal of Poverty, Investment and Development 12:51-61. |
|
|
Tekle L, Berhanu K (2015). Determinants of Rural Farm Household Food Security in Boloso Sore District of Wolaita Zone in Ethiopia. Asian Journal of Agricultural Extension, Economics and Sociology 5(2):57-68. |
|
|
USAID (2018). Food assistance fact sheet total contributions per fiscal year report, 2018. |
|
|
WFP (World Food Programme) (2014). Comprehensive food security and vulnerability analysis (CFSVA): Executive summary, Ethiopia, (March). |
|
|
Wooldridge JM (2012). Introductory Econometrics: A Modern Approach. 5th Ed. USA: Library of Congress. |
|
|
World Bank (2014). "World Bank open data report ". Washington, DC. Retrieved October 21, 2014, from The World Bank Website: |
|
|
Zhou D, Shah T, Ali S (2019). Factors affecting household food security in rural northern hinter land of Pakistan. Journal of the Saudi Society of Agricultural Sciences 18(2):201-210. |
|
Copyright © 2024 Author(s) retain the copyright of this article.
This article is published under the terms of the Creative Commons Attribution License 4.0


