ABSTRACT
Plant composition of urban green spaces is an important component of urban ecosystem as it influences the provision of many environmental and social services that contribute to the quality life. In Nairobi, a few remnants of continuous highland forest exist but they are under increasing pressure from the rapidly changing surrounding landscape. The plant composition is being altered by human encroachment and other related activities. The status of the current plant composition in relation to location and disturbance level is unknown. This study was therefore carried out to determine the variation in tree composition and distribution in three major green spaces within Nairobi city namely City Park, Karura and Ngong’ forests. Transects were laid out along environmental gradients, and the type, size, abundance and diameter at breast height (DBH) of tree species recorded within 20*15 m quadrats. The following aspects were calculated; abundance, species richness and distribution of tree diameters at breast height (DBH) and importance value (IVI). Indigenous species contributed 82% whilst exotic species accounted for 18% of the total species recorded. A mean quadrat species richness of 6.3, 4.7 and 4.1 was recorded in City Park, Karura and Ngong’ forests, respectively. It was observed that few tree species dominate and this reduces the diversity. At forest edges, exotic species were abundant, but this changed as one moves to the center, where the composition was mainly indigenous due to minimal disturbance. It can be concluded from this study that for conservation of the green urban spaces, there should be proper planning in place to minimize the human encroachment and to enhance plant diversity especially indigenous species. Further, it is necessary to encourage all stakeholders to participate in the conservation of these important sites.
Key words: Urban vegetation, remnant habitat, anthropogenic effects, phytosociology, species richness, importance value.
Urbanization in developing countries has accelerated in the past twenty years and nearly half of world’s population are urbanized and projected to increase (K’Akumu et al., 2007). As urban areas expand existing forests may be destroyed, fragmented, or included as part of urban landscapes, exposing them to a number of threats including destruction of native species, invasion by exotic species, fires caused by human activities, pest and pathogen outbreaks, and unmanaged outdoor recreation activities (Chavez, 2005). Additionally, the process of urbanization leads to destruction and removal of vast area of the forests with serious impacts on the indigenous tree species (Ouinsavi and Sokpon, 2010). The replacement of indigenous species with exotic results in biotic homogenization and reduction in the biological uniqueness of local ecosystems (Blair, 1999). Nairobi’s large and growing population is one of the main forces driving the city’s overwhelming environmental challenges. Ongoing rural to urban migration, high natural birth rates, and poor or inappropriate city planning conspire to continue degrading the city’s water and air quality. In turn, environmental degradation has impacts on human health and the economy (Tibaijuka, 2007).
The physical expansion of Nairobi has come at the expense of the natural environment. The urban sprawl, construction of roads and other city infrastructure has led to the loss of forests and other natural areas, such as mixed rangeland and bush lands (Tibaijuka, 2007). As a result, the forest cover receded and was replaced by coffee plantations. Later, the demand for food for the growing population led to the transformation of the city’s outskirts to other agricultural uses, which in turn were threatened by further urban growth. The rise of unplanned settlements poses a threat to the protected areas in terms of depletion, pollution, plant diversity and destruction of habitats.
From the aforementioned challenges, this study aimed to determine the tree variation and distribution in the major green spaces in Nairobi city, Kenya.
Description of study area
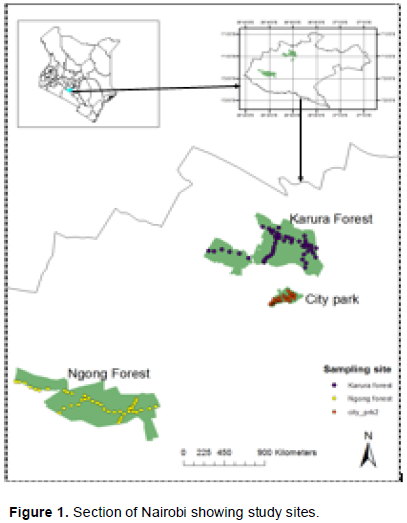
The city is located at the South-eastern end of Kenya’s agricultural heartland, between approximately longitude 1° 9’S, 1° 28’S and latitude 36° 4’E, 37° 10’E (Figure 1). It occupies an area of about 696 km2 and the altitude varies between 1,500 and 1,850 m above sea level (Tibaijuka, 2007).
City Park is located between Limuru road and forest road. It was curved from Karura forest and maintained as a recreation facility.
Part of it was landscaped, and the rest of the land is a remnant forest acting as habitat for plants and animals. It is one of the only few remaining intact portions of the rich indigenous forest that once extended over much of greater Nairobi.
Karura Forest Reserve is located in the north central part of Nairobi city. It is a dry upland forest and a water catchment for Thigiri, Karura, Ruaraka and Gitathura river systems. The forest supports plantation trees, indigenous trees and grasslands. It has a unique indigenous trees species composition that provides shelter to various fauna and below ground biodiversity. The forest has plantations that cover 632 ha while 260 ha are covered by indigenous plants.
Ngong forest is a dry land forest located within the confines of Nairobi city in the western part. It supports planted trees, indigenous trees and grasslands. The forest has had several excisions since its gazettement, most of them occurring between 1963 and 1994 (Sousa et. al., 2007).
Geographical characteristics of the study sites
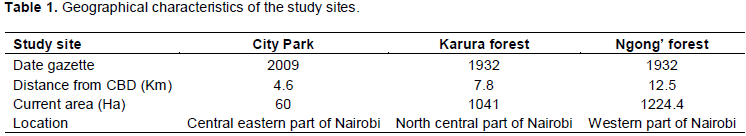
The geographical characteristic of the study sites is given in Table 1.
Sampling and sampling plots layout
Quadrat plot’s area 300 m² (20 m × 15 m) were used to collect data on trees, shrubs, saplings and herbaceous species for City Park. Grids of 20 m × 15 m were laid on a map, then a starting point was set at the starting edge of the park on the lower end and extended upslope to make a belt transect. Sampling quadrats were set at every 50 m interval. Subsequent transects were set in parallel manner with a separating distance of 150 m. In Karura and Ngong’ forests transect belts were laid from one edge of the forest section to the other, and quadrats of 20 m × 15 m set along the transects at an interval of 100m between the quadrats. Transects were selected to represent the main environmental gradients in the study areas. The environmental gradients considered included, slope, riverine conditions and site exterior boundary to interior of the green space. The total numbers of quadrats sampled were 36, 51 and 41 for City Park, Karura and Ngong’ forests, respectively.
Data collection
Within the quadrats all trees of height 8 m and above were identified up to species level and classified according to Beentje (1994). Diameter at breast height (DBH) was measured at a height of 1.3 m from the ground for all trees within the quadrat. For trees with multi-stems, each stem was measured separately and reported as a single index by taking the square root of the sum of all squared stem DBHs (Height et al., 2006). The geographical positions of the studied quadrants were recorded by the use of global positioning system (GPS).
Data analysis
In order to understand the population structure and distribution pattern of tree vegetation in these semi-natural forest sites the data collected was used to derive several ecological variables. For each species, the number of individual trees recorded in all the quadrats and transects was summed to give the value of tree species abundance for the whole study site. The number of quadrats where a given species occurred was counted to give incidence. Species richness was derived from the total count of different types of tree species observed in all transects for each study site. Tree size was assessed using average DBH of all trees in the quadrats (Nagendra and Gopal, 2011). For each transect the average and standard deviations in diameters at breast height (DBH) of all trees were calculated. Trees were assigned to six different DBH size classes: 0-15, 15-30, 30-45, 45-60, 65-75 and >75 cm. The distribution of trees amongst different size classes was calculated using a measure similar to shannon diversity to give size class diversity (Nagendra and Gopal, 2011). The other variables such as species diversity, density, basal area and frequency were calculated or derived using standard formulas (Kigomo et al., 2015) as follows:
1. Shannon index of diversity (H); obtained using the following equation:
Where: H', Shannon diversity index; Pi, proportion (n/N) of individuals of one particular species found (n) divided by total number of individuals found (N); ln, is natural log and Σ is the sum calculations.
2. Basal area (BA): The cross sectional area of each stem measured at 1.3 m above the ground; obtained using the equation:
3. Relative basal area (RBA): Basal area of a given species divided by the total basal areas of all the species *100:
i. Absolute frequency: The number of quadrats in which a given species was found divided by the total number of quadrats sampled.
ii. Relative frequency: Frequency of a given species divided by the total frequencies of all the sampled species*100
iii. Absolute density: The total number of individuals tallied for a given species divided by the total area of the measured plots (plants per hectare).
iv. Relative density: Density of a given species divided by the sum of the densities of all of the species* 100.
v. Importance value index (IVI): Relative frequency + Relative density + Relative basal area for each species.
All the computed phytosociological parameters in the three sites were tabulated for all the recorded tree species to show species variations according to method of Lenza et al. (2015).
Type of tree species and distribution
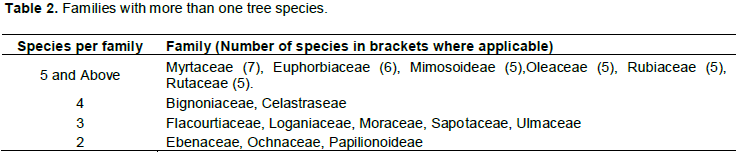
A total of 1,850 trees were sampled in 128 quadrats. Of these, 69.3% of the trees were native species, while the rest were exotic species. A total of 84 tree species were encountered which were distributed across 37 families; 69 out of 84 were native while 15 species were exotic. Plants in the Mrytaceae and Euphorbiaceae families were most common each with seven and six species, respectively. Four families had 5 species, two families had 4 species, five families had 3, and three families had 2 species each (Table 2). Overall, Karura forest recorded the highest abundance with 916 trees followed by City Park and Ngong’ forest which had 491 and 445 trees, respectively. Overall, the most dominant species was
Eucalyptus paniculata followed by
Drypetes gerrardii and
Teclea trichocarpa. Among the ten dominant species, eight were indigenous and only two were exotic.

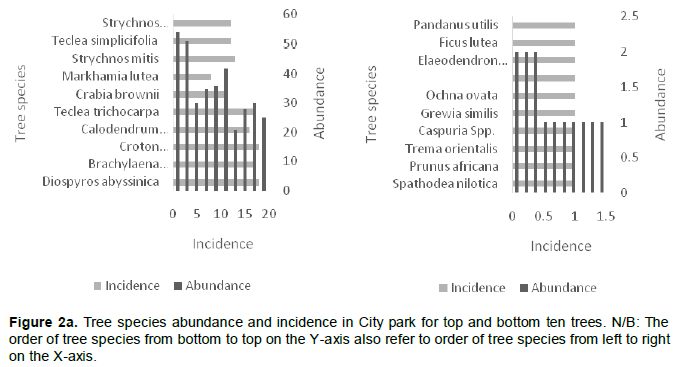
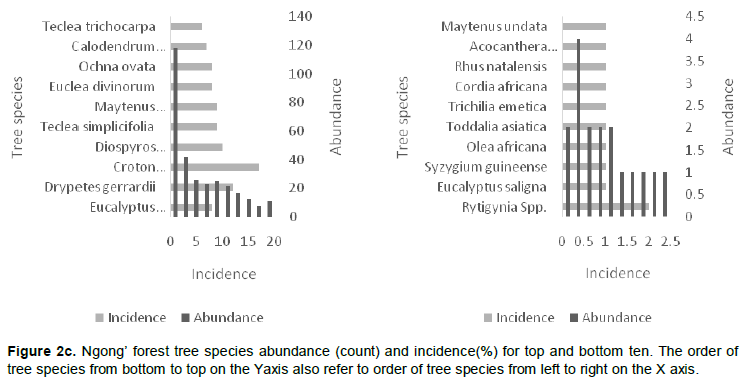
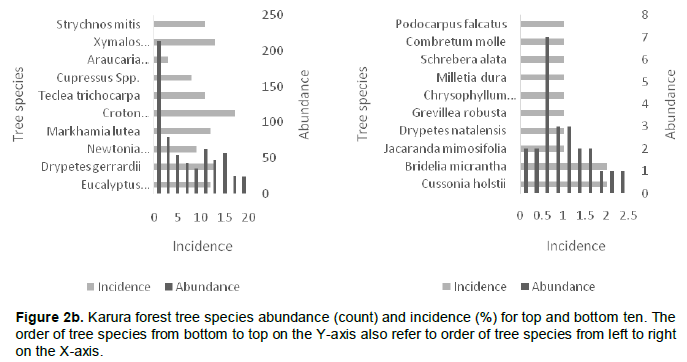
Karura forest contributed seven of the top ten most abundant tree species, followed by City Park with two and Ngong’ forest with one. In City Park, D. abysinnica was the most abundant tree species with a count of 54 while the least abundant trees were Ficus lutea, Elaeodendron buchananii, Pandanus utilis and Mystroxylon ethiopicum with a count of 1. At Karura forest, E. paniculata was the most abundant tree species with a count of 214 with trees like Croton aleinus, Combretum mole, Grewia similis and Vangueria madagascariensis having a count of 1. In Ngong’ forest, E. paniculata was the most abundant tree species with a count of 118 and with trees like Acocanthera oppositifolia, Cordia africana, and Maytenus undata having a count of 1 (Figure 2a to c).
The abundance of the identified species when compared with incidence indicates that at city park D. abysinnica was more evenly distributed, occurring in 18 of the 36 sampled quadrats; unlike E. paniculata which was unevenly distributed as it appeared only in 12 and 8 out of the sampled 51 and 41 quadrats in Karura and Ngong’ forests respectively. In Karura and Ngong’ forests, the plantations done at specific areas were the contributing factor of the unevenness of E. paniculata (Figure 2a to c).

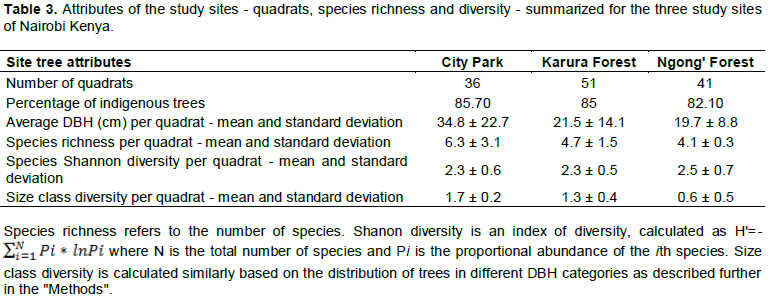
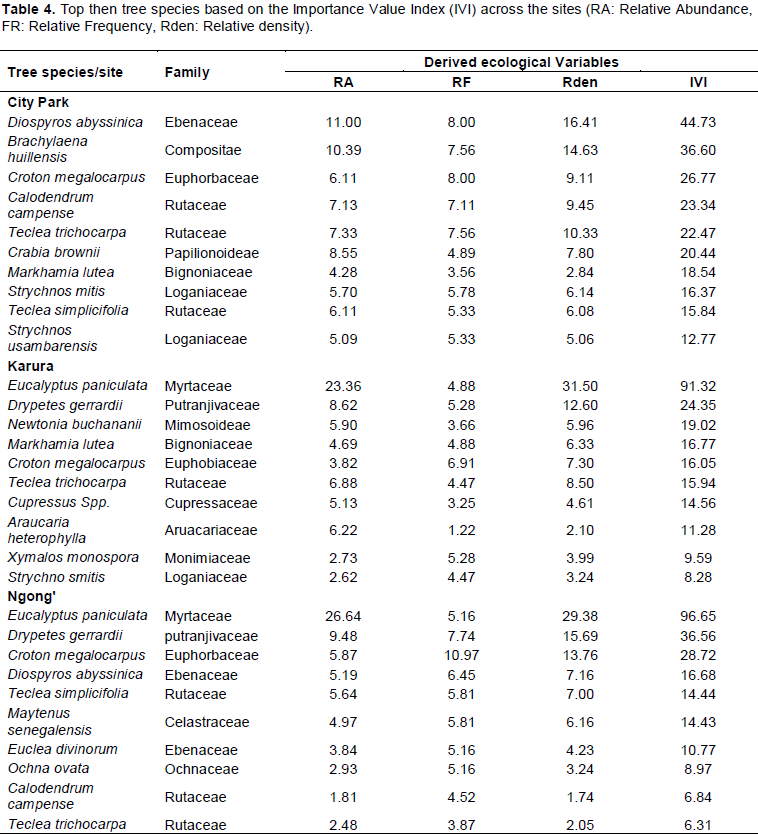
The computed mean tree species richness per quadrat was 6.3, 4.7 and 4.1 for City Park, Karura and Ngong’ forests, respectively (Table 3). Tree species frequency curves indicated that at City Park D. abysinnica and C. megalocarpus were the most common occurring in 18 out of the 36 sampled quadrats followed by Teclea trichocarpa and Brachylaena huillensis (17/38); while Pandanus utilis, Trema orientalis, Ochna ovata and Ficus lutea were the least common occurring only in 1 out of the 36 sampled quadrats. In Karura forest Croton megalocarpus was the most common occurring in 17 out of the 51 sampled quadrats, followed by D. gerrardii and Xymalos monospora (13/51). Grewia similis, Milletia dura and Trema orientalis were the least common occurring in 1 out of the 51 sampled quadrats. In Ngong’ forest C. megalocarpus was the most common occurring in 17 out of the 41 sampled quadrats, followed by D. gerrardii (12/41); while Rhus natalensis, Cordia africana, Markhamia lutea. Toddalia asiatica, Trichilia emetica, Olea Africana and Syzygium guineense were the least common occurring in 1 out of the 41 sampled quadrats (Figure 3).


Relative tree sizes and density
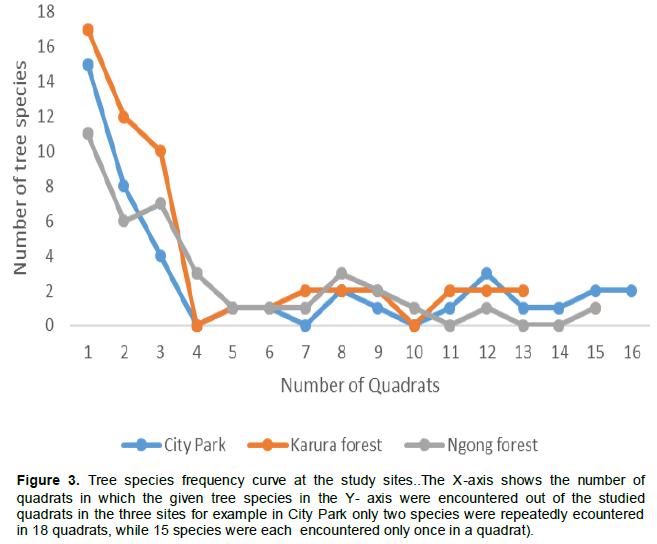
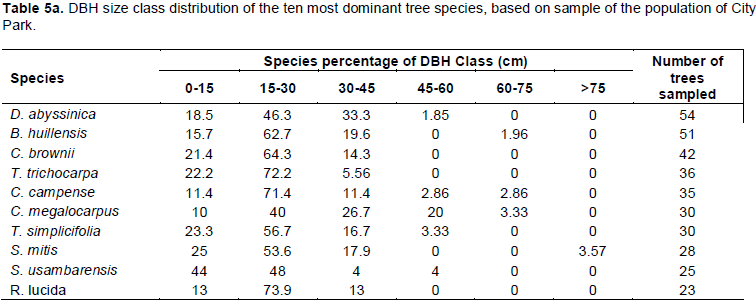
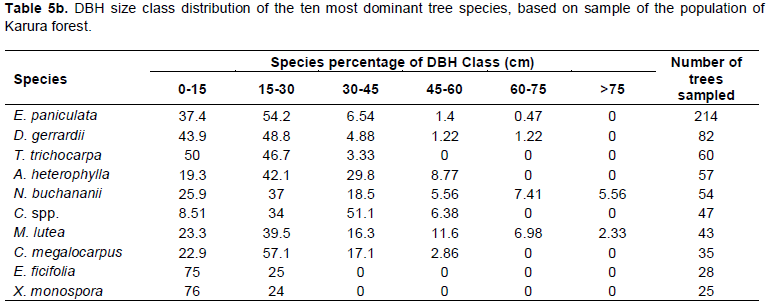
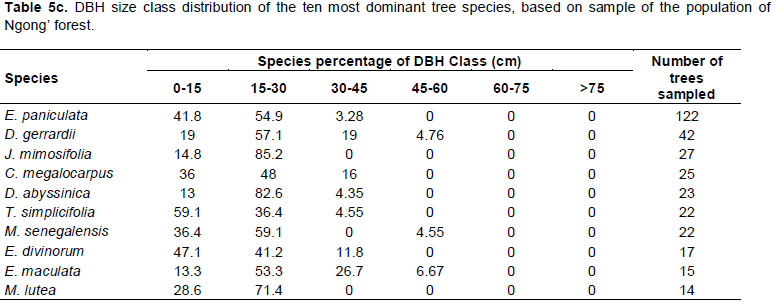
Majority of the trees encountered were in the DBH class 15-30 cm, followed by 0-15 cm and lastly the 60-75 cm class (Figure 4). Table 5a to c shows the tree species distribution among the DBH classes. E. paniculata, T. trichocarpa, and Crabia brownii were dominated by individuals in the two lower classes <15 cm and 15-30 cm DBH and do not have individuals in the size categories of 60-75 and >75 cm DBH. Newtonia buchananii and Markhamia lutea were fairly represented in all size categories.

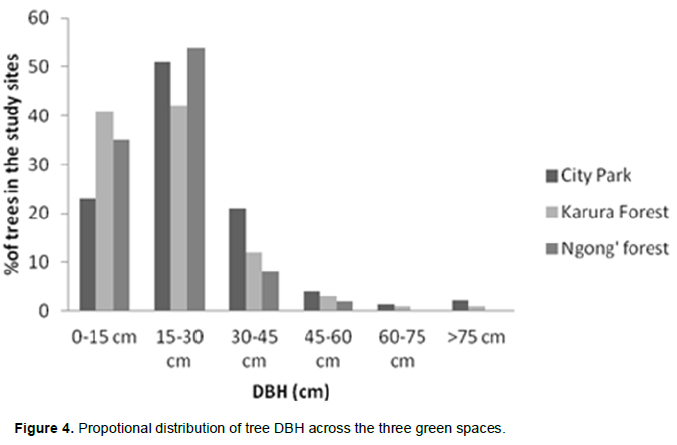
Tree species important value index (IVI) has been used in other studies before to show the ecological importance of a given ecosystem (Aerts et al., 2011; Kacholi, 2014). At City Park D. abyssinica had the highest relative density and importance value followed by B. huillensis and C. megalocarpus. At Karura and Ngong’ forests; E. paniculata had the highest IVI followed by D.gerrardii, Newtonia buchananii and C. megalocarpus respectively (Table 4). Table 6 shows a complete table of the phytosociological parameters of the species identified in the study sites.
Disturbance of the green spaces leads to increased unused resources which gives way to the invasive species that takes over the gaps created due to the disturbance (Davies et al., 2008). The boundaries of unprotected green space especially City Park, therefore had more invasive species dominating unlike the interior parts which were less disturbed. The study showed that Nairobi green spaces had high tree species richness; with 84 species recorded from128 quadrats sampled containing a total of 1850 trees. The tree distribution was however dominated by a few species with the top five species accounting for almost 50% of all tree species. There was a clear variation in species richness between City Park, Karura forest and Ngong forest. City Park leads in mean species richness followed by Karura forest and Ngong’ forest respectively. This could be due to higher disturbance which opens space for other species to develop as the space regenerates. City Park is more open to visitation and the bushes regularly cleared by the management thus creating some level of disturbance that allows other plant species to establish. Karura and Ngong forests though enclosed, they have experienced various levels of uncontrolled disturbance and encroachment from the surrounding communities in informal settlements. In order to protect the many indigenous plant species that create these invaluable habitats, efforts are needed to continually manage them in sustainable manner by engaging the key stakeholders. Recent initiatives such as by the ‘Friends of Karura Forest’ to fence the forest, conduct tree plantings, and initiate guided nature walks for visitors, through the Kenya Forest Service and by involving the neighboring residents of Huruma community will contribute greatly in the conservation of Karura forest. In City Park, Nature Kenya, through ‘The Friends of City’ contributes in gathering useful ecological information and on many occasions has helped to protect the habitat from encroachment and elevate its value as conservation and natural recreation site for City residents. Similar efforts at Ngong Forest will broaden the understanding about green spaces to a wider population, change perception and help to inform on best management practices to sustain their value. Stakeholders such as the Kenya Forest Services (KFS), the Department of Environment of Nairobi County, researchers, planners and the civil society should continue engaging the surrounding communities in the protection of urban green spaces through training and initiating environmentally friendly alternative sources of income rather than those deemed destructive. As indicated by the Shannon’s index of diversity in the various transects for the three sites the value is low mainly due to over dominance of few species, some exotic. These green spaces must be continually managed to protect and enhance species composition and distribution as they are essential habitats for biodiversity and serve other key ecological functions.
The authors have not declared any conflict of interests.
The authors wish to thank the International Foundation for Science (IFS) for providing funds to carry out this research, the Kenya Forest Services for the permit to access the sites and personnel from National Museums of Kenya for support in field survey.
REFERENCES
|
Aerts R, Thijs KW, Lehouck V, Beentje H, Bytebier B, Matthysen E, Gulinck H, Lens L, Muys B (2011). Woody plant communities of isolated Afromontane cloud forests in Taita Hills, Kenya. Plant Ecol. 212(4):639-649.
Crossref
|
|
|
|
Beentje H (1994). Kenya trees, shrubs and lianas, National Museums of Kenya, Nairobi. P 722.
|
|
|
|
|
Blair RB (1999). Birds And Butterflies Along An Urban Gradient: Surrogate Taxa For Assessing Biodiversity? Ecol. Appl. 9(1):164-170.
Crossref
|
|
|
|
|
Chavez DJ (2005). Natural areas and urban populations: Communication and environmental education challenges and actions in outdoor recreation. J. For. 103(8):407-410.
|
|
|
|
|
Davies RG, Barbosa O, Fuller RA, Tratalos J, Burke N, Lewis D, Warren PH, Gaston KJ (2008). City-wide relationships between green spaces, urban land use and topography. Urban Ecosyst. 11(3):269-287.
Crossref
|
|
|
|
|
Height B, Note P, States U (2006). Agriculture, Fisheries and Conservation Department Conservation Branch. Nature Conservation Practice Note 02(02):1-6.
|
|
|
|
|
K'Akumu OA, Olima WH (2007). The dynamics and implications of residential segregation in Nairobi. Habitat Int. 31(1):87-99.
Crossref
|
|
|
|
|
Kacholi DS (2014). Analysis of structure and diversity of the Kilengwe forest in the Morogoro region, Tanzania. Int. J. Biodivers. P 8.
Crossref
|
|
|
|
|
Kigomo JN, Muturi GM, Gachathi FN, Kimani SM, Kuria MN, Waweru EM (2015). Vegetation composition and dynamics along degradation gradient of Kiang'ombe hill forest in the drylands of Kenya. J. Hortic. For. 7(7):168-178.
Crossref
|
|
|
|
|
Lenza E, Santos JO, Maracahipes-Santos L (2015). Species composition, diversity, and vegetation structure in a gallery forest-cerrado sensu stricto transition zone in eastern Mato Grosso, Brazil. Acta Bot. Bras. 29(3):327-338.
Crossref
|
|
|
|
|
Nagendra H, Gopal D (2011). Tree diversity, distribution, history and change in urban parks: Studies in Bangalore, India. Urban Ecosyst. 14(2):211-223.
Crossref
|
|
|
|
|
Ouinsavi C, Sokpon N (2010). Morphological Variation and Ecological Structure of Iroko (Milicia excelsa Welw. C.C. Berg) Populations across Different Biogeographical Zones in Benin. Int. J. For. Res. pp. 1-10.
Crossref
|
|
|
|
|
Sousa MV de, Compton PD, Kelleher NL (2007). City of Nairobi environmental outlook. Nairobi.
|
|
|
|
|
Tibaijuka A (2007). Chapter 5: Nairobi and its Environment. Kenya Atlas. Barr J, Shisanya C (Eds.). City pp. 145-160.
|
|


.png)
.png)


