ABSTRACT
The study uses conjoint analysis to determine the preferences of different groups of people on specific urban forest attributes such as plant variety, planting pattern, color variety and growth form. A year-long face-to-face survey was employed to collect data and conjoint analysis was conducted to estimate the relative importance of the attributes as well as the part-worth values of the specific levels under each attribute. Furthermore, the respondents were segmented into various groups based on demographics and the corresponding preferences were estimated for each group. The study revealed that, all the aforementioned attributes were important with plant variety being the most important and growth form being the least important. Specifically, the respondents preferred urban forests to be predominantly trees and grass, planted in patches that are scattered throughout the city, mainly green with many other colors, and trimmed. Various sub-groups of respondents showed slight variations in preferences which entail specific adjustments on management strategies and maintenance techniques.
Key words: Conjoint analysis, urban forest management.
Urban forests as defined by Konijnendijk (2008) are areas inside cities and urban centers that are planted to vegetation that varies from any combination of trees, shrubs and grasses. These areas serve a variety of functions among which include: improving the aesthetics of the built landscape, providing shade and protection for wildlife, serving as a venue for recreation and socialization, and helping regulate ambient urban temperature conditions. In the United States, major cities have set aside specific areas where urban forests are established and maintained. The major forms of urban forests are embodied in parks, gardens, urban trails and greenways. A number of studies have proven the key role that urban forests play in establishing the character of the city; in improving real estate value; in contributing to the health and well-being of residents; and in contributing to the local economy. It is in this light that management and maintenance of urban forests need to continue to be responsive to the needs of the population it serves (O’Brien, 2006).
It is evident that one of the primary beneficiaries of urban forest services is the local people; therefore, in the effective management of urban forests it is important to solicit feedback from them, particularly the actual users of these areas. In the aspect of aesthetics, preferences of users are varied and may at times be contradictory. Thus, studies that aim to understand the nature of these differences can aid managers in developing a management scheme that can address this. This study investigates the preferences of the users of Washington DC’s urban forests in terms of specific characteristics that can be influenced by management as well as observing similarities and differences in the preferences of specific demographics of people. Lastly, findings on people’s preferences are also discussed in relation to management implications.
This study is one of the few that used conjoint analysis to urban forests treated as a product because most studies that use conjoint analysis are involved in the field of marketing where producers or manufacturers of products try to determine specific attributes and characteristics of the product that are preferred by consumers (Louviere, 1988). However, through the years there has been a recommendation that the use of conjoint analysis be expanded to other fields for the improvement of its application (Green and Srinivasan, 1990). A study used conjoint analysis in exploring the economics, impacts and implications of green product development (Chen, 2001). Unconventionally, another study used conjoint analysis in valuing a phenomenon called ecosystem change, and compared its applicability against the more popular contingent valuation method (Farber and Griver, 2000). The study succeeds in noting the methods’ similarities and differences. Moreover, conjoint analysis was also used in investigating services and not just actual tangible products (Gustafsson et al., 1999).
Studies outside of marketing that involve the use of conjoint analysis are often geared towards investigating people’s preferences. One study attempted to develop an urban housing design based on preferences of people elicited using the conjoint approach. Among the attributes studied were proximity to work, commercial areas, air quality, presence of green spaces and recreational areas (Katoshevski and Timmermans, 2001). In line with studies conducted in urban areas, conjoint analysis was also used in determining city attributes most preferred by tourists in the interest of developing city tourism (van Limburg, 1998).
Urban forests also have its share of studies that use conjoint analysis. A study looked at the differences of urban forest preferences based on race and revealed that one race preferred areas with a more natural setting where trees are abundant and not groomed while another preferred a more developed urban forest with more open spaces, established trails and facilities (Elmendorf et al., 2005). In addition, another study looked into the preferences of forest management planners on the composition and structure of urban forests, finding that a group of respondents preferred pure stands of urban forests with little understory vegetation and devoid of dead trees, while others preferred a more natural looking stand of mixed tree species (Tyrväinen et al., 2003).
There are a number of other studies that explored people’s preferences of various urban resources using methods other than conjoint analysis. For example, Turpie and Joubert (2004) investigated the preferences of visitors to specific flower attributes and associated impacts on flower tourism in a city. Lohr (2006) examined people’s responses to trees of different shapes, finding that respondents rated significantly more attractive or felt pleased for the scenes with a spreading tree than those with a conical or rounded tree. Qin et al. (2013) examined visitors’ responses to the color, size and scents of major plants in Shanghai Botanical Garden, finding that color is one of the most important factors affecting visitors’ overall satisfaction with vegetation. More recently, Plot and Akay (2015), in examining the relationships between the visual quality of urban recreational areas and the structural and vegetation landscape elements of these areas, found that plant and color compositions and plant species diversity are the most important factors that define the visual quality of landscape areas and that visitor’s visual quality can be negatively affected by a lack of bush-type plants.
In the United States, one study related people’s preferences with their tendencies to support local businesses. Wolf (2005) investigated the preferences of residents and visitors on business districts with tree-lined streets and related it to their patronage behavior. The study revealed that respondents were more keen on shopping and spending more time at business districts with a more lush and relaxing atmosphere. They viewed areas with well-maintained tree-lined streets to have shops with better product quality, value and selection. Lastly, the respondents expressed their willingness to travel and spend a considerable amount of time enjoying such areas.
The studies described previously prove that conjoint analysis is more than a marketing tool used to develop products and segment markets. It is evident that this tool can be used to obtain important information that can be used in designing and managing places such as residential areas, tourist destinations and urban parks, to name a few. This study is geared towards contributing to this body of literature where the preferences of different groups of people are observed and related to the management of urban forests in a city as important as Washington DC.
Survey site and data collection
The capital of the United States, Washington DC, was the study site and it was chosen because of its extensive urban forests that are scattered throughout its area. This fact is corroborated by Nowak et al. (2006) citing the moniker, “a city within a park”. The city is home to 1,928,000 trees, with park acres per 1000 people being 12.40 and percentage of land as park being 18.99 (American Forests, 2015). These elements make Washington DC an appropriate venue to explore public preferences on its expansive greenery for the benefit of its management. Data were collected at the following sites: United States Botanic Garden, United States National Arboretum, and the National Mall (area in front of the Lincoln Memorial, tidal basin, and the area in front of the Smithsonian Institute museums).
Self-administered questionnaires were distributed to the respondents during the survey, which was done twice a month from October, 2009 to September, 2010. Survey activities were limited during weekends, that is, Friday to Sunday from 10 am to 5 pm. These particular days and times were chosen because this is the peak time when people arrive and spend time in the city. Both residents and visitors were approached and purposive sampling was employed to identify prospective respondents. Prior to letting respondents answer the questionnaire, they were briefed on the objectives of the study and given a short background on the definition of urban forests. The surveyors were also tasked to guide the respondents in the proper way of answering the questionnaire.
Questionnaire design
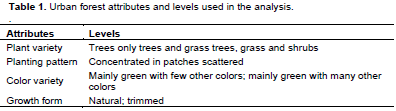
This study uses the conjoint approach in eliciting the preferences of respondents to attributes of urban forests that are outlined in Table 1. The attributes have corresponding levels that detail specific conditions under each attribute. These attributes were identified and chosen based on the recommendation of professionals from the Urban Forest Administration of the city (Table 1). From a total of 36 (3x3x2x2) possible mix of attributes and levels, the Statistical Package for the Social Sciences (SPSS.20) software was used to generate plan cards orthogonally and a total of nine cards were used. The first part of the questionnaire lists all plan cards and each respondent was asked to score each plan card using a scale of 1 to 10 where 1 = least preferred and 10 = most preferred. The second part of the questionnaire asks the respondent’s background information and trip characteristics for the purpose of sub-grouping and comparison.
Data analysis
The sample was characterized using the background information and visit characteristics obtained and the scores given by the respondents on each plan card of the conjoint experiment was analyzed using regression analysis. Equation 1 gives the regression model used for this purpose.
Where Y denotes the respondent’s preferences for a given combination of urban forest attributes, b1 through b4 are the utility values for the levels in each attribute, and e is an error term. For each attribute, the relative importance value was calculated by dividing the part-worth of a specific attribute by the total part-worth value of all attributes. The part-worth values are the unstandardized regression coefficients from the regression model (Won et al., 2009). The sample was then divided into sub-groups based on their social and trip background and comparisons among sub-groups were conducted using t tests and ANOVA.
The sample
There were a total of 3,210 people asked to participate in the year-long survey and data collection produced 1,146 completed questionnaires posting a response rate of 35.7%. The main reason why people were not willing to participate is their absence of time to spend answering the questionnaire. For foreign visitors, many cited their low English reading proficiency as their hindrance from participating in the survey. Data processing and organization were conducted to eliminate incomplete questionnaires which dropped the total responses used for the analysis to 1,065.
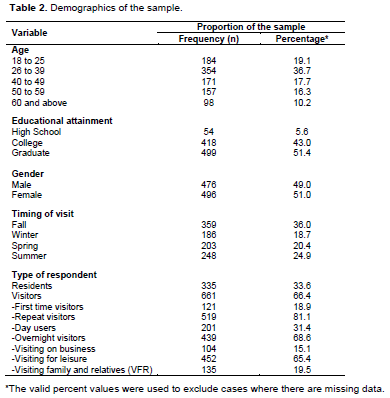
Table 2 characterizes the respondents for the study based on their socio-demographics and trip characteristics. The table shows that there are slightly more female respondents (51.0%) than their male counterparts (49.0%). The largest portion (36.7 %) of respondents is aged 26 to 39 years old and almost half (44.2%) aged 40 years or older. About 36.0 % of the respondents visited the city during the fall season; and about two-thirds (66.4%) were visitors while the rest are local residents. Lastly, the respondents were considerably well-educated with 94.4% of them having at least a college degree. Visitors totaled 661 respondents and of this, a majority (81.1%) was repeat visitors with only 18.9% being first timers. Furthermore, 68.6% stayed overnight and 65.4% visited the city for leisure (Table 2).
Overall conjoint analysis results
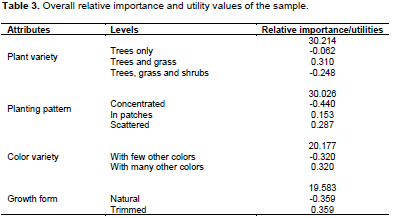
For the overall sample, Table 3 summarizes the relative importance values of the attributes as well as the part-worth utility values of each level under the attributes. It can be observed from the table that all attributes earned a relative importance value greater than 15% which means that all attributes are important considerations in understanding the preference of the respondents (Chiam et al., 2009). Plant variety and planting pattern are the most important with values over 30% each, followed by color variety and growth form with 20.2 and 19.6%, respectively. Part-worth utility values indicate the specific level of each attribute the respondents prefer and the highest positive values indicate the preferred level. Therefore, in Table 3, it can be noted that for the plant variety attribute, respondents preferred having urban forests with trees and grass that are scattered throughout the area. The respondents also preferred urban forests that are mainly green with many other colors and urban forests that are trimmed or groomed (Table 3).
Results by sub-groups
Table 4 lists the relative importance and part-worth utility values of visitors, residents, male and female respondents. As shown, both residents and visitors regarded plant variety as the most important attribute and growth form as the least important attribute. On the other hand, both male and female respondents agreed that plant variety is the most important attribute while growth form is the least important. However, female respondents put a significantly higher relative importance value for growth form compared to male respondents. Specifically, all sub-groups agreed that they preferred urban forests that are dominated by trees and grass, that are scattered or in patches throughout the city. These urban forests are preferred to be mainly green with many other colors and are trimmed (Table 4).
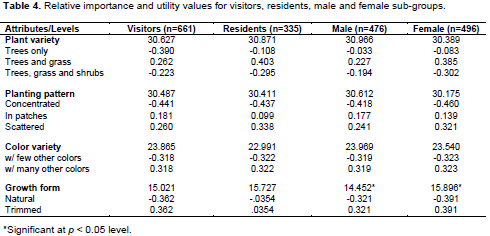
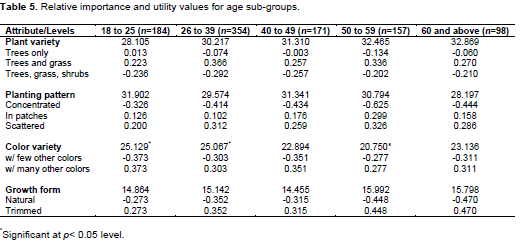
Table 5 shows the results of the conjoint analysis by age group. As the table indicates, the 18 to 25 year old group indicated that planting pattern is the most important attribute while the 40 to 49 year old group found planting pattern and plant variety as almost equally important. All groups showed that growth form is the least important attribute with the 18 to 25 and 40 to 49 year old groups assigning a relative importance value of less than 15%. Additionally, across all age groups, respondents preferred urban forests that are mainly trees and grass scattered or planted in patches throughout the city, mainly green but colorful and trimmed.
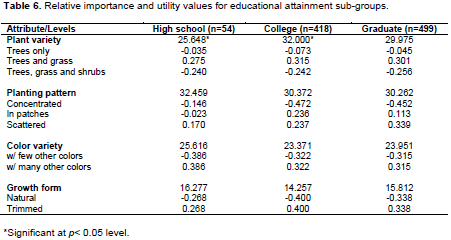
It was mentioned previously that the respondents were well educated but still offered differences in perspectives. As can be seen in Table 6, for respondents with a college degree perceived plant variety as the most important urban forest attribute while the other two sub-groups considered planting pattern as the most important attribute. Respondents with a high school diploma perceived plant variety and color variety as almost equally important. Furthermore, the sub-group with a high school diploma had a significantly lower mean relative importance value while the opposite is true for those respondents with a college degree. In terms of utility values, these groups followed the overall preference of urban forests described previously.
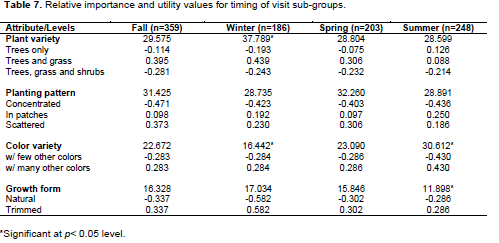
In order to explore differences among visitors, respondents were also divided into sub-groups based on their trip characteristics and the preferences of each group were observed. The first grouping was based on the timing of their trip to Washington DC and the seasons were the categories of time used in the study since the appearance of urban forests change through these periods. The results are presented in Table 7. As shown, for visitors in the fall and spring, planting pattern is the most important attribute. Respondents in winter assigned a significantly higher relative importance value to plant variety and a significantly lower value to color variety. In contrast, respondents during summer assigned a significantly higher relative importance value for the color variety attribute. Moreover, this group regarded plant variety and planting pattern as almost equally important. Fall, spring and summer visitors viewed growth form as the least important of the four attributes and summer respondents indicated a mean relative importance value for growth form of less than 15%, which means that it is not an important attribute for them in terms of their preferences. Lastly, all groups agreed that they preferred urban forests that are composed of trees and grass, scattered or planted in patches throughout the city, green with many other colors, and trimmed.
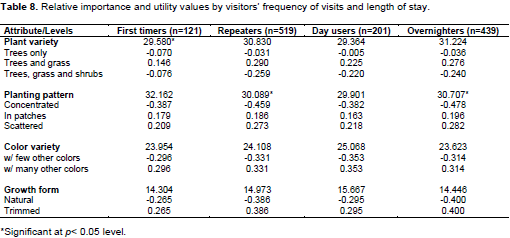
Another factor believed to have an impact on visitors’ preferences is the frequency of their visits and the length of their stay. In this study, the visitors were also grouped based on whether they were first timers or repeaters in the city; or whether they were day users or overnight users. Table 8 summarizes the relative importance and utility values for these groups of respondents.As shown, first time visitors held planting pattern as the most important attribute while repeat visitors and overnighters viewed plant variety as the most important attribute. All four groups agreed that growth form is the least important attribute with only the day users assigning a relative importance value of greater than 15%. In terms of the part-worth utility values, the groups shared the same preferences for urban forests that are composed mainly of trees and grass, planted either in patches or scattered through the city, mainly green with many other colors and are trimmed.
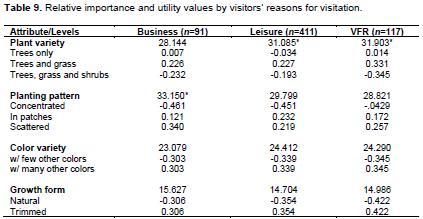
The last basis for grouping visitors is the purpose of visit and from this, visitors were grouped as those visiting for business purposes including studying and education or training; those who were visiting for leisure or vacation; and those who were visiting family or relatives. Table 9 presents the relative importance and part-worth utility values for these groups of respondents. It is found that those visiting family or relatives and those visiting for leisure regarded plant variety as the most important attribute while those visiting for business deemed planting pattern as the most important. All groups regarded growth form as the least important but only those visiting for business gave it a mean relative importance value of greater than 15%. In terms of the specific levels under each attribute, these groups of respondents preferred the same set of attribute levels as the previous visitor subgroups. There were no observed significant differences on the relative importance and part worth utility values for these subgroups.
The results of the study showed that sub-groups based on demographics and trip characteristics exhibit some differences in their preferences, particularly on the urban forest attribute that they regarded as most important. Some groups regarded plant variety as the most important while others regarded planting pattern as the most important and there were others who considered that both were equally important. Subsequently, all groups were unanimous that growth form was the least important attribute with some groups regarding it as not an important attribute with regards to their preferences. In terms of the specific levels under each attribute, all groups preferred urban forests with the same characteristics. The management implications of these results are discussed further in the succeeding section.
The four attributes explored in this study are the main attributes that urban forest managers have the capability to manipulate when maintaining such areas. The respondents indicated that plant variety and planting pattern are the most important attributes, giving managers a feedback on which urban forest attributes to focus more on, specifically on the establishment or redevelopment of areas devoted for urban forests. Secondary to these two attributes are considerations on color variety and growth form. These findings also suggest that people who enjoy Washington DC took notice of urban forests with specific points-of-view on the appearance and establishment of urban forests throughout the city.
On a management stand point, this variation in preferences exhibited by the respondents can validate and promote initiatives that can encourage urban forest managers to maintain urban forests that have variety in terms of the attributes highlighted in the study. Through this, the gamut of preferences of most visitors and residents can be addressed in one way or another. Urban forest managers who aim to provide an assortment of urban forest settings make the landscape more dynamic from an aesthetic perspective. Moreover, this variety of settings can cater to the different preferences that urban forests users have (Schroeder, 1987).
The general preference of the respondents indicate that people choose urban forests to be more dominated by trees and grass which means they are partisan to a more open type of urban forest where there are trees that shade the areas but at the same time have grass that can serve as a natural ground cover where people can enjoy spending time. People want these urban forests to be scattered or planted in patches which adds to the openness that people prefer since they will be accessible to people from all directions and will be located all over the city area. The results of this study reinforce past studies on preferences of urban forests for recreation where the respondents had more affinity to open and natural-looking urban landscapes (Schroeder, 1991). From the perspective of landscape ecology, this study also endorses Parsons’s (1995) argument that people tend to prefer moderately open settings featured by open grassy areas scattered with occasional groupings of trees and shrubs. However, some other studies found that some people prefer landscapes with relatively dense vegetation (example, De Groot and van den Born, 2003; Bjerke et al., 2006).
People’s preferences for open spaces with trees may pose a challenge on a management point of view especially with most urban forest areas in Washington DC being currently well established. With this in mind, the managers can increase the accessibility of the parks and gardens to make it more open and more inviting to most people. Furthermore, managers can also consider identifying areas with a dominantly built up landscape and set aside pockets of land where vegetation can be established.
The study found that respondents also preferred urban forests that are mainly green with many other colors. This finding is consistent with previous studies. For example, Qin et al. (2013) reported that color is one of the most important factors affecting visitors’ overall satisfaction with vegetation, and Plot and Akay (2015) found that plant and color compositions and plant species diversity are the most important factors that define the visual quality of landscape areas. The preferences for color variety could also be challenging considering the preference of people are biased towards trees and grass only. There are many other creative ways to add color to urban forests. For one, managers can add flowering plants that do not gain much height as shrubs to keep the openness of the area or construct footpaths or small trails, when applicable, and use trail materials that will add color to the area. When there are some small structures like benches, signs, or fences, these can be painted with colors that blend with the natural setting but will add to the color palette. Moreover, during special holidays or events, colorful decorations can be incorporated to the area and this can be done seasonally and annually which can eventually become an attraction to people. Lastly, people’s preference to growth form means that constant maintenance need to be done on urban forests regularly especially those places with high human traffic.
This study is a novel attempt at understanding the preferences of people on specific characteristics of urban forests and the findings have provided a glimpse at what different groups of people respond to positively when it comes to the characteristics of urban forests they enjoy and experience. Other characteristics that are not included in this study can be explored in future studies to obtain a more accurate picture of the preferred type and appearance of urban forests for a city that is as diverse and as popular as Washington DC. Studies similar to this can be conducted at the park level, which is site specific so managers of individual parks or gardens can get a more precise picture of people’s preferences.
From a research method standpoint, the methods used for this study can be altered to include more survey sites and expand the versions of the survey instrument to include respondents who do not use English as their main language. Differences in language may reflect differences in culture so the perspective of such segments of the population also needs to be represented and perhaps new insights can be gleaned from them.
The authors have not declared any conflict of interests.
Funding for this study is from a grant awarded to the second author by the USDA Forest Service. The authors would like to thank Ms. Mary Willeford Bair of the National Park Service, Ms. Christine Flanagan of the US Botanic Gardens, Dr. Monica Lear of the Urban Forestry Administration, DDOT, Ms. Nancy Luria of the US National Arboretum, Mr. David Dyre, Mr. Ishwar Dhami, Ms. Sudiksha Dhami, and Ms. Rosheila Rodriguez for their support and cooperation in the conduct of the study.
REFERENCES
|
American Forests (2015). Washington D.C. urban forest facts.
View
|
|
|
|
Bjerke T, Østdahl T, Thrane C, Strumse E (2006).Vegetation density of urban parks and perceived appropriatenessfor recreation.Urban Forestry & Urban Greening. 5:35-44.
Crossref
|
|
|
|
|
Chen C (2001). Design for the environmental: Aquality-based model for green product development. Manage. Sci. 47:250-263.
Crossref
|
|
|
|
|
Chiam M, Soutar G, Yeo A (2009). Online and off-line travel packages preferences: A conjoint analysis. Int. J. Tourism Res.11:31-40.
Crossref
|
|
|
|
|
De Groot WT, Van den Born RJG (2003). Visions of natureand the landscape type preferences: An exploration in the Netherlands. Landscape and Urban Planning. 63:127-138.
Crossref
|
|
|
|
|
Elmendorf WF, Willits FK, Sisidharan V (2005). Urban park and forest participation and landscape preference: A review of the relevant literature. J. Arboric. 31:311-317.
|
|
|
|
|
Farber S, Griver B (2000). Using conjoint analysis to value ecosystem change Environ. Sci. Technol. 34:1407-1412.
Crossref
|
|
|
|
|
Green PE, Srinivasan V (1990). Conjoint analysis in marketing: new developments with implications for research and practice. J. Mark. 54:3-19.
Crossref
|
|
|
|
|
Gustafsson A, Ekdahl F, Bergman B (1999). Conjoint analysis: A useful tool in the design process. Total Qual. Manage. 10:327-343.
Crossref
|
|
|
|
|
Katoshevski R, Timmermans H (2001). Using conjoint analysis to formulate user-centered guidelines for urban design: the example of new residential development in Israel. J. Urban Des. 6:37-53.
Crossref
|
|
|
|
|
Konijnendijk CC (2008). The forest and the city: The cultural landscape of urban woodland. NY: Springer.
Crossref
|
|
|
|
|
Lohr VI (2006). Responses to scenes with spreading, rounded, and conical tree forms.Environment and Behavior. 38(5):667-688.
Crossref
|
|
|
|
|
Louviere JJ (1988). Analyzing decision making: Metric conjoint analysis. CA: Sage Publications.
|
|
|
|
|
Nowak DJ, Hoehn III RE, Crane DE, Stevens JC, Walton JT (2006). Assessing urban forest effects and values: Washington, DC's urban forest.Resource Bulletin NRS-1. Newtown Square, PA: U.S. Department of Agric. Forest Service, Northern Research Station.
View
|
|
|
|
|
O' Brien E (2006). Social housing and greenspace: A case study in inner London. Forestry 79:535-549.
Crossref
|
|
|
|
|
Parsons R (1995). Conflict between ecological sustainability and environmental aesthetics: Conundrum, canärd or curiosity. Landsc. Urban Plan. 32(3):227-244.
Crossref
|
|
|
|
|
Plot AT, Akay A (2015).Relationships between the visual preferences of urban recreation areausers and various landscape design elements. Urban Forestry Urban Greening. 14:573-582.
Crossref
|
|
|
|
|
Qin J, Zhou X, Sun C, Leng H, Lian Z (2013). Influence of green spaces on environmental satisfaction and physiological status of urban residents. Urban Forestry Urban Greening 12(4):490-497.
Crossref
|
|
|
|
|
Schroeder HW (1991). Preferences and meaning of arboretum landscapes: Combining quantitative and qualitative data. J. Environ. Psychol. 3:231-248.
Crossref
|
|
|
|
|
Schroeder HW (1987). Dimensions in variations of urban park preference. J. Environ. Psychol. 7:123-141.
Crossref
|
|
|
|
|
Turpie J, Joubert A (2004). The value of flower tourism on the Bokkeveld plateau – a botanical hotspot.Development South Africa. 21:645-662.
Crossref
|
|
|
|
|
Tyrväinen L, Silvennoinen H, Kolehmainen O (2003). Ecological and aesthetic values in urban forest management. Urban Forestry Urban Greening. 1:135-149.
Crossref
|
|
|
|
|
Van Limburg B (1998). City marketing: A multi-attribute approach. Tourism Management. 19:475-477.
Crossref
|
|
|
|
|
Wolf KL (2005). Trees in the small city retail business district: comparing resident and visitor preferences. J. For. 103: 390-395.
|
|
|
|
|
Won D, Hwang S, Kleiber D (2009). How do golfers choose a course? A conjoint analysis of influencing factors. J. Park Recreat. Admin. 27:1-16.
|
|